3059
Cortical Surface-based Index Change in Alzheimer's Continuum: a Structural MRI Study1Radiology, Second Affiliated Hospital of Zhejiang University School of Medicine, Hangzhou, China, 2GE Healthcare, Shanghai, China
Synopsis
Alzheimer’s disease remains the most common cause of dementia. To identify morphological difference in an early stage, we used surface-based method to detect the cerebral alternation in the Alzheimer’s continuum (subdivided into Alzheimer’s pathologic change and AD) based on the 2018 NIA-AA research framework. We found that the reductions in surface measures were greater in individuals labeled as AD than in participants with Alzheimer’s pathologic change, while these metrics were more significantly decreased in AD dementia patients. Our findings suggest that AD biological definition would be beneficial for earlier detection which could lead to early diagnosis and intervention.
Synopsis
Alzheimer’s disease remains the most common cause of dementia. To identify morphological difference in an early stage, we used surface-based method to detect the cerebral alternation in the Alzheimer’s continuum (subdivided into Alzheimer’s pathologic change and AD) based on the 2018 NIA-AA research framework. We found that the reductions in surface measures were greater in individuals labeled as AD than in participants with Alzheimer’s pathologic change, while these metrics were more significantly decreased in AD dementia patients. Our findings suggest that AD biological definition would be beneficial for earlier detection which could lead to early diagnosis and intervention.Introduction
Alzheimer's disease remains the most common cause of dementia and AD pathological process begins years even decades before cognitive symptoms.Conventional clinical diagnosis of the AD is too late for therapy. Recently, NIA-AA has proposed a biological definition in 2018 research framework. We aimed to identify cerebral change in Alzheimer's continuum(subdivide into AD and Alzheimer's pathologic change).Methods
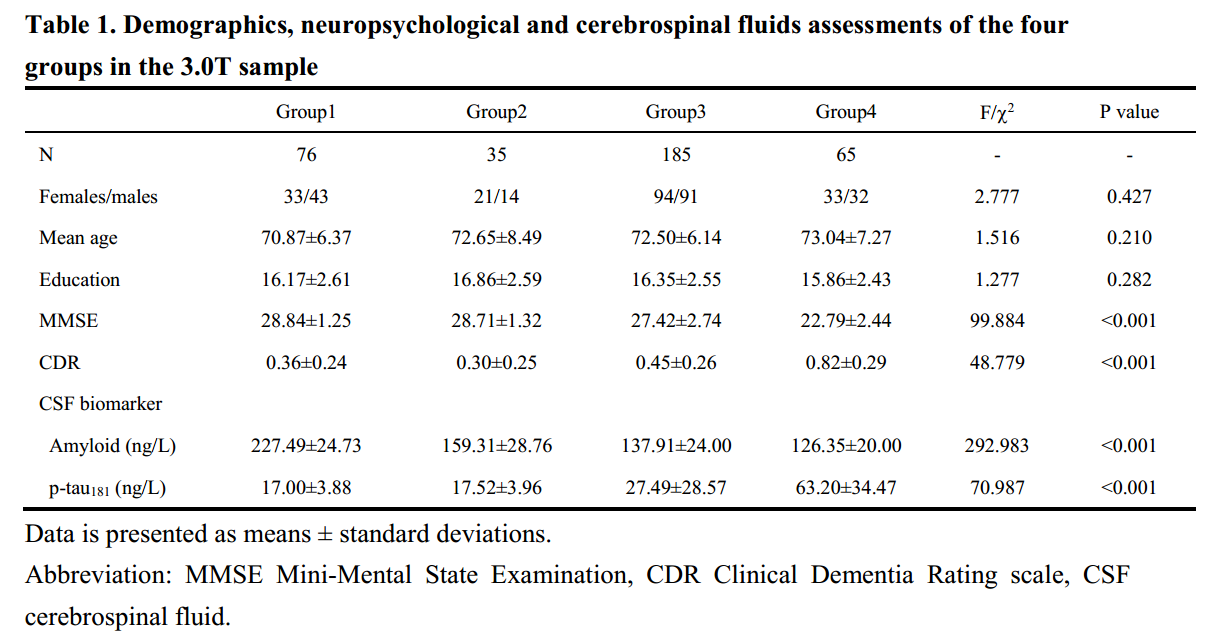
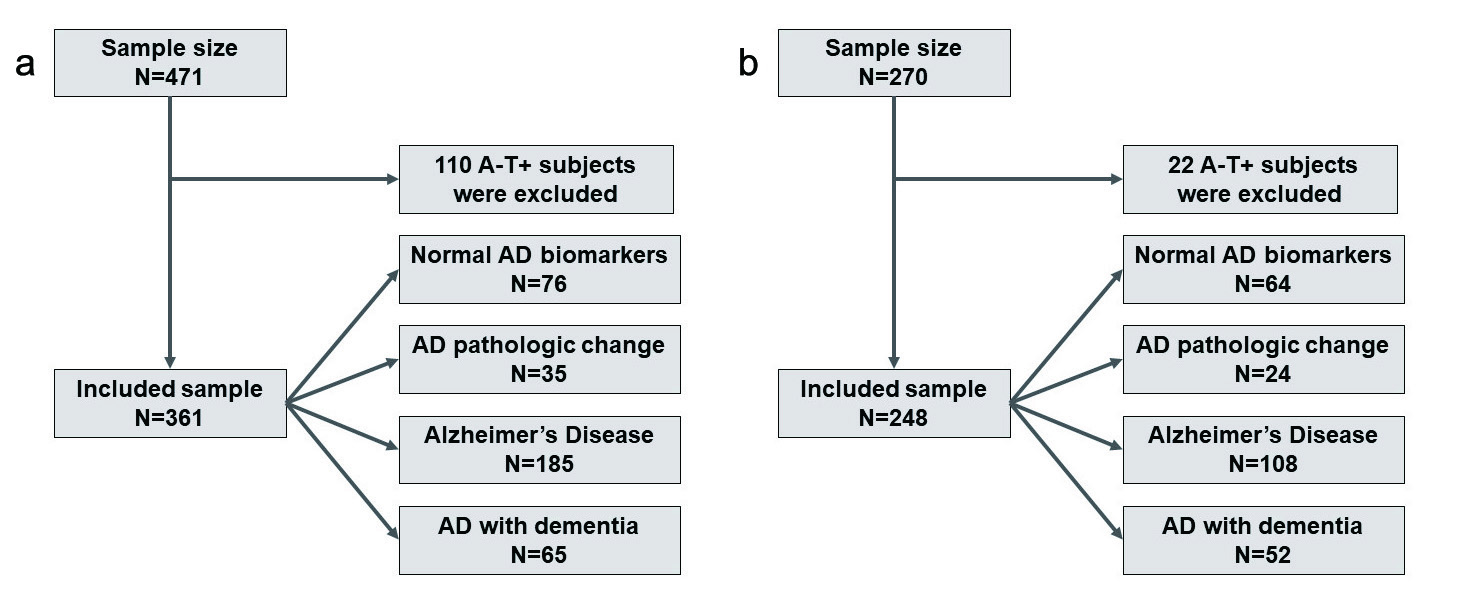
Based on the previous cut-off value of CSF amyloid-beta and p-tau level2, we divided non-demented subjects from the ADNI in to three groups: 1) normal AD biomarkers (group1); 2) Alzheimer's pathologic change (group2); and 3) AD (group3). Moreover, we selected AD dementia patients with biomarker profile "A+T+" to comprise the forth group (group4). We applied a surface-based method to detect cortical difference in Alzheimer's continuum compared to the group1 on a regional level. Surface-based measures include cortical thickness (CTh), fractal dimension (FD), and gyrification index (GI) which have been widely used in neuropsychiatric disorders. For the reproducibility and generalizability of results, we repeated analysis in another sample.
Results
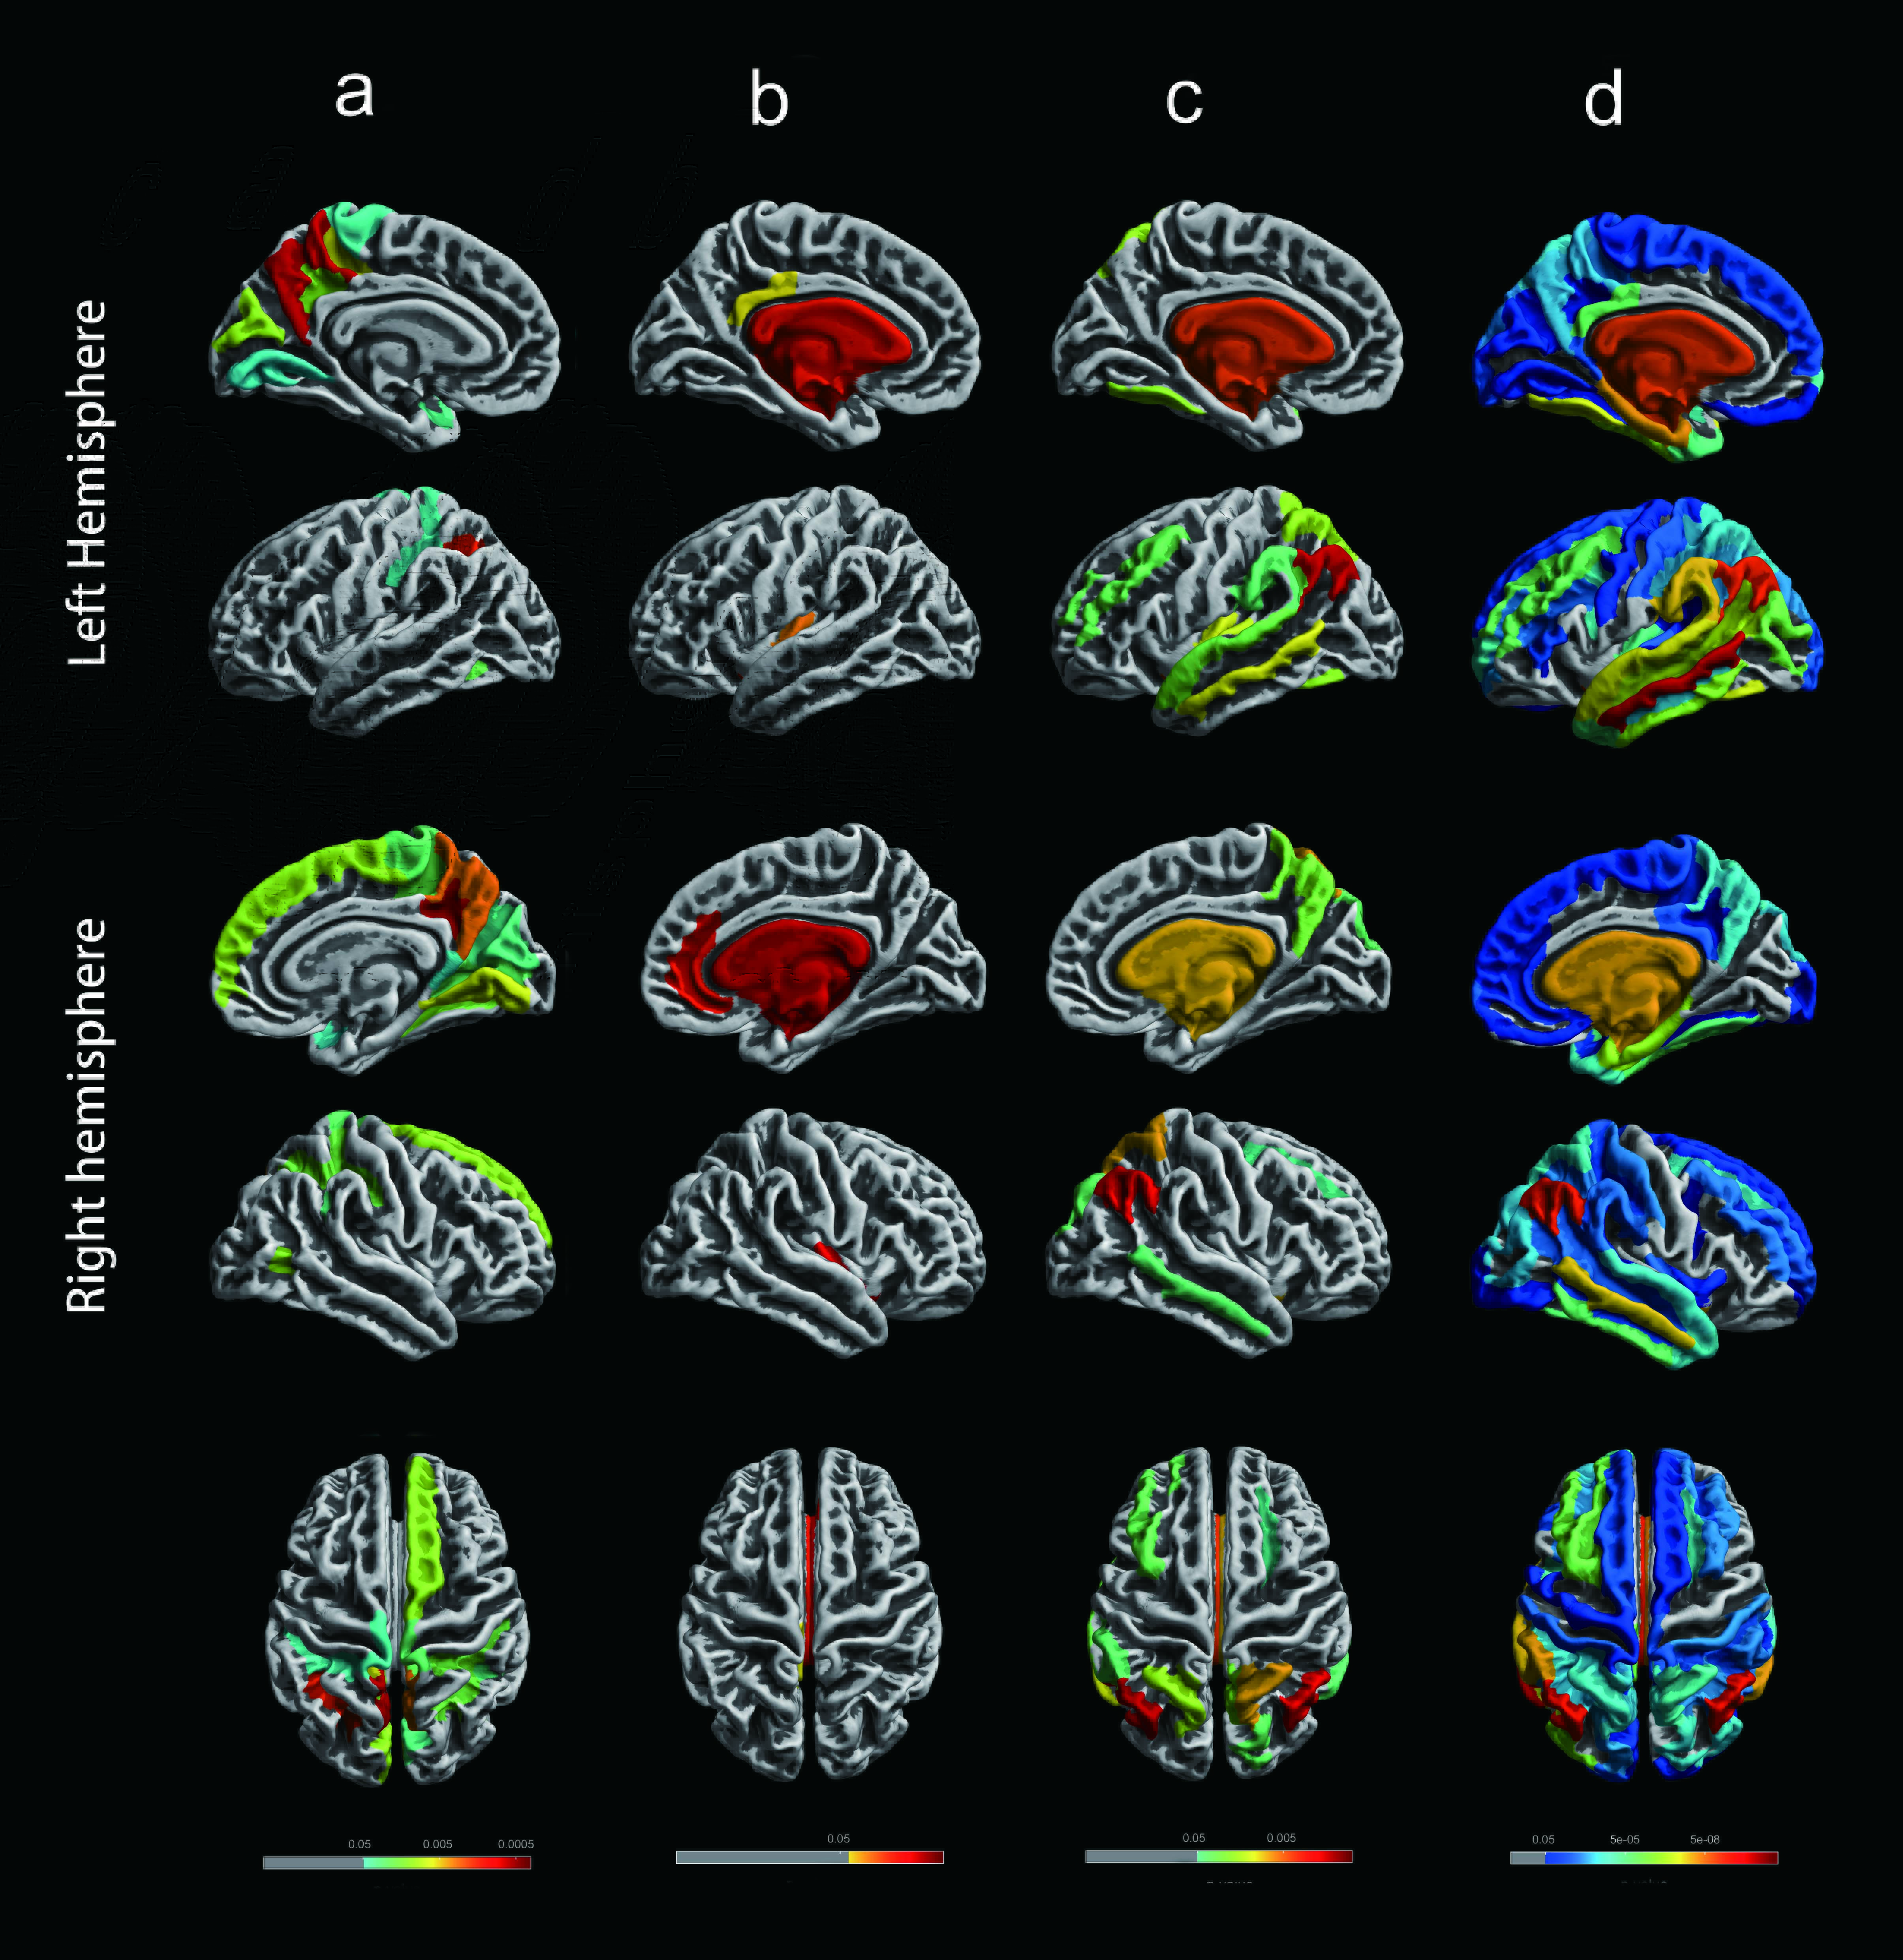
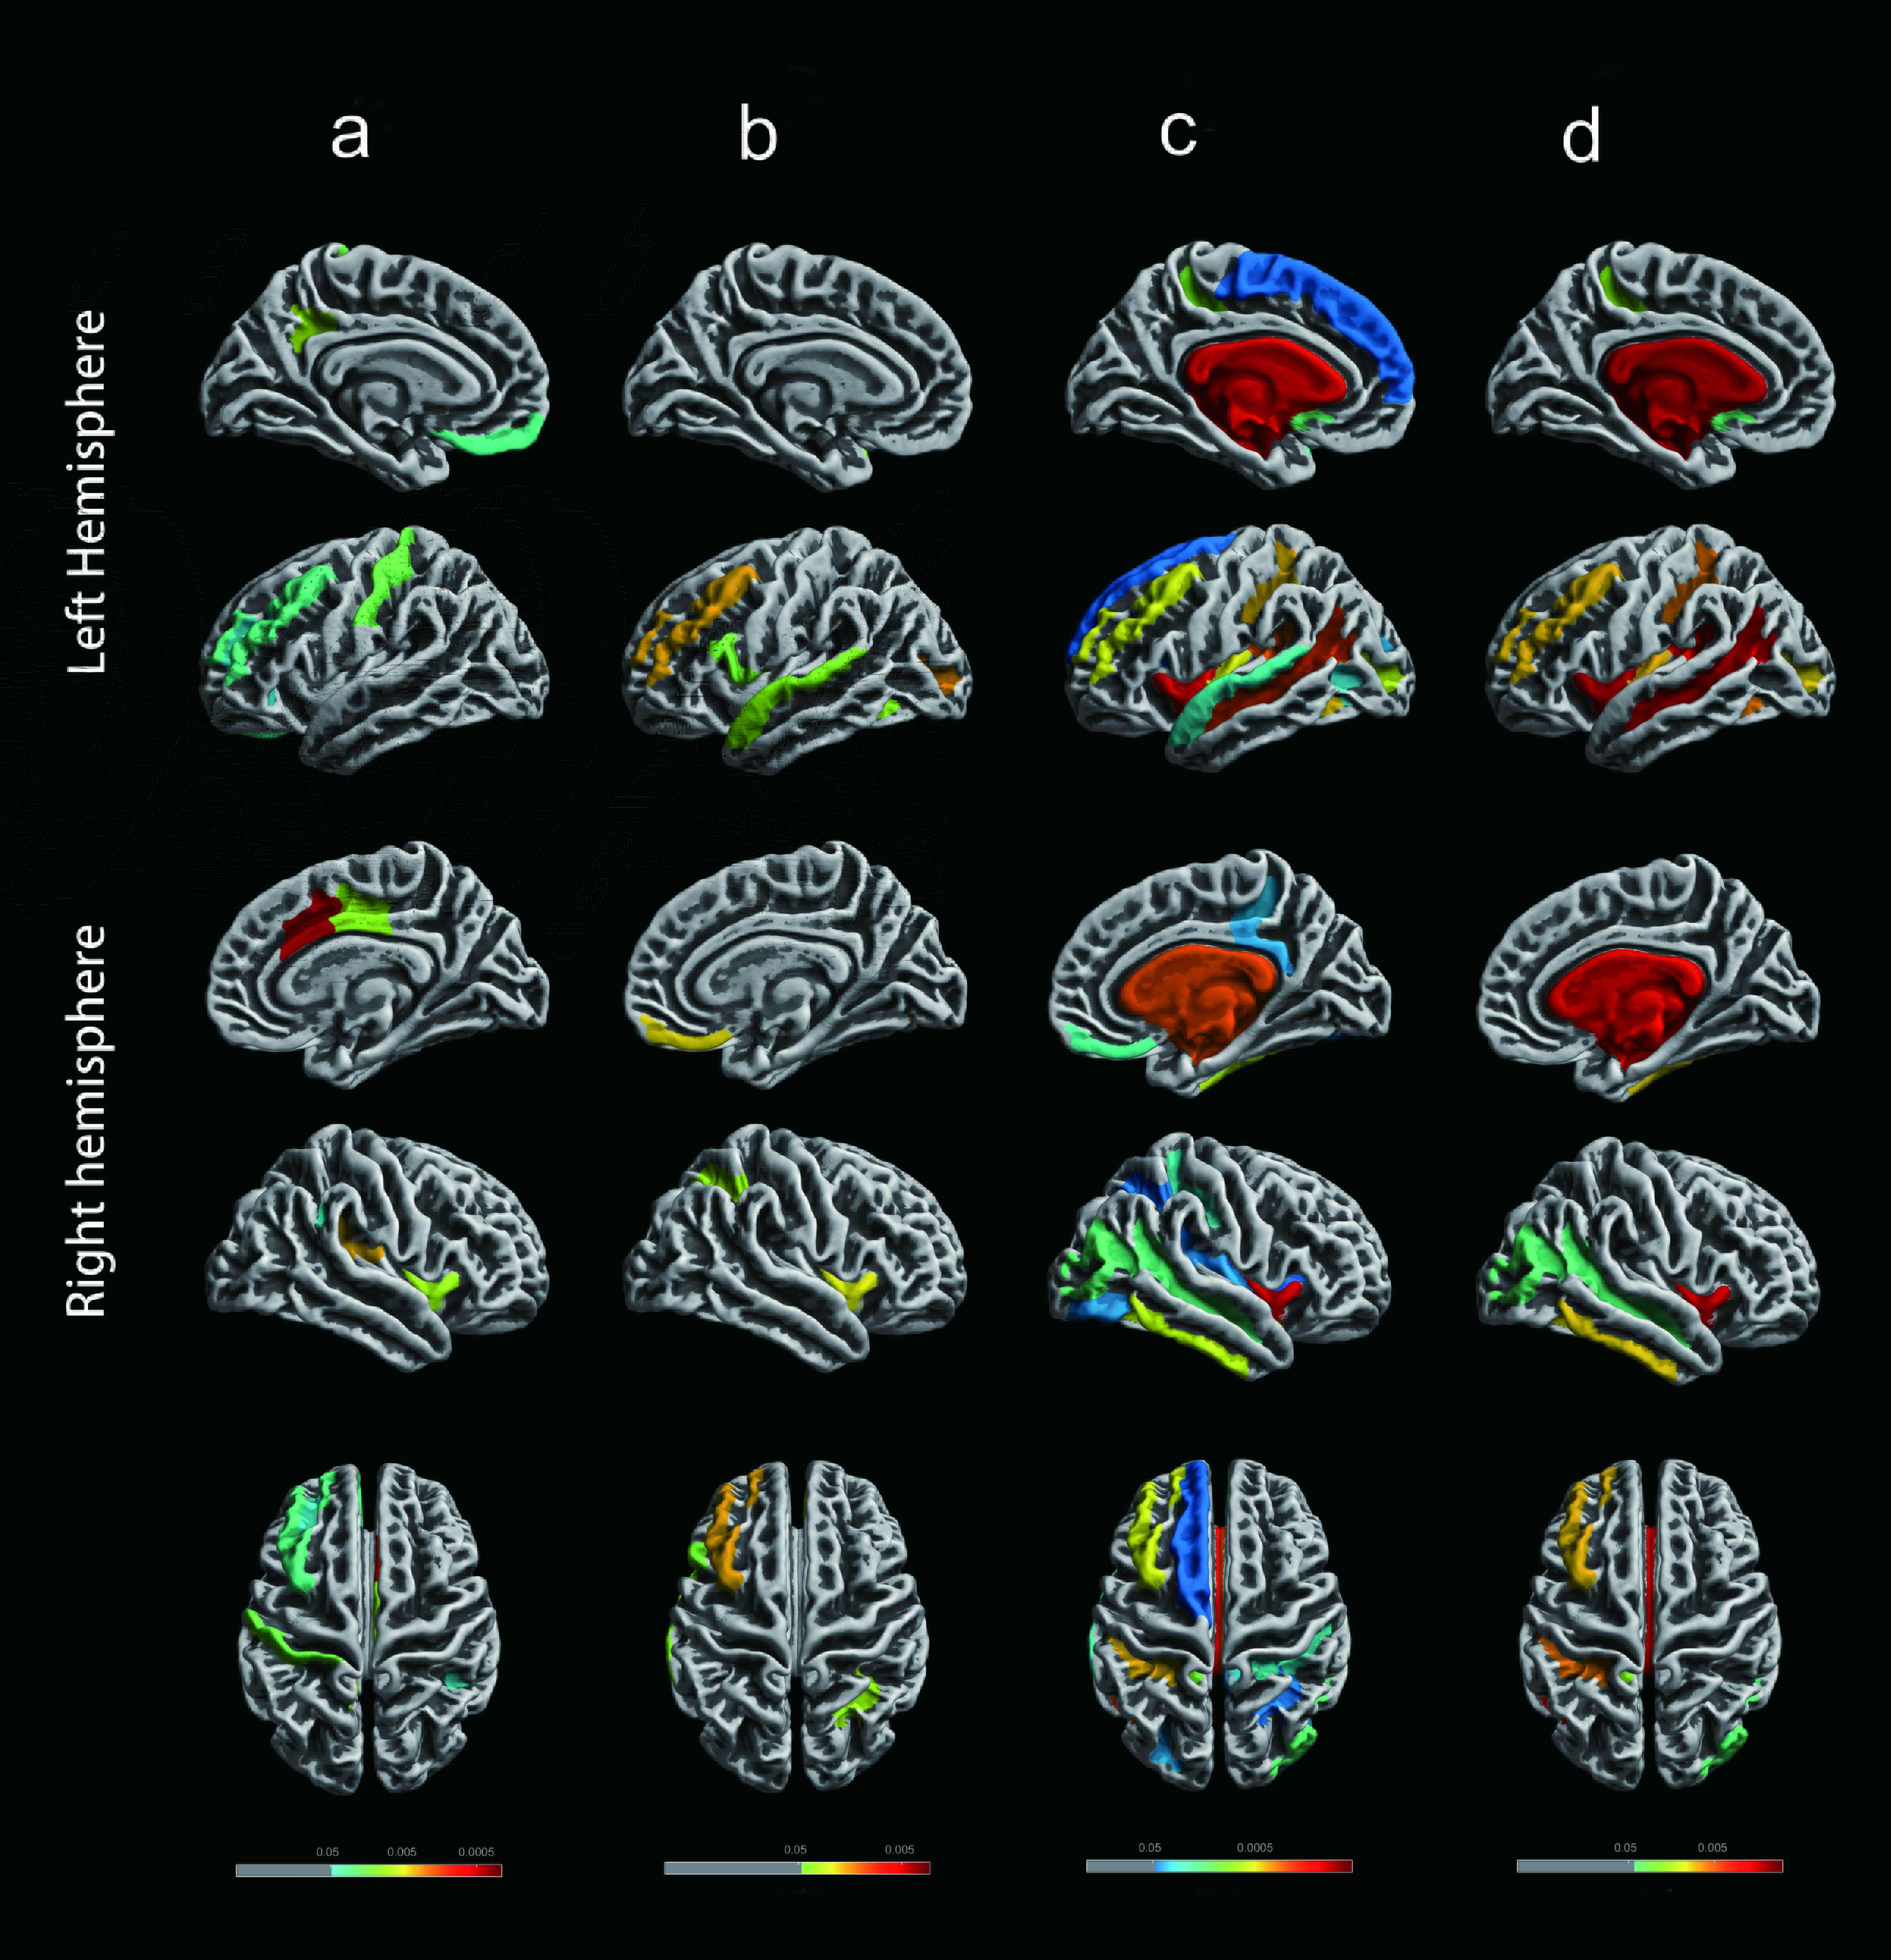
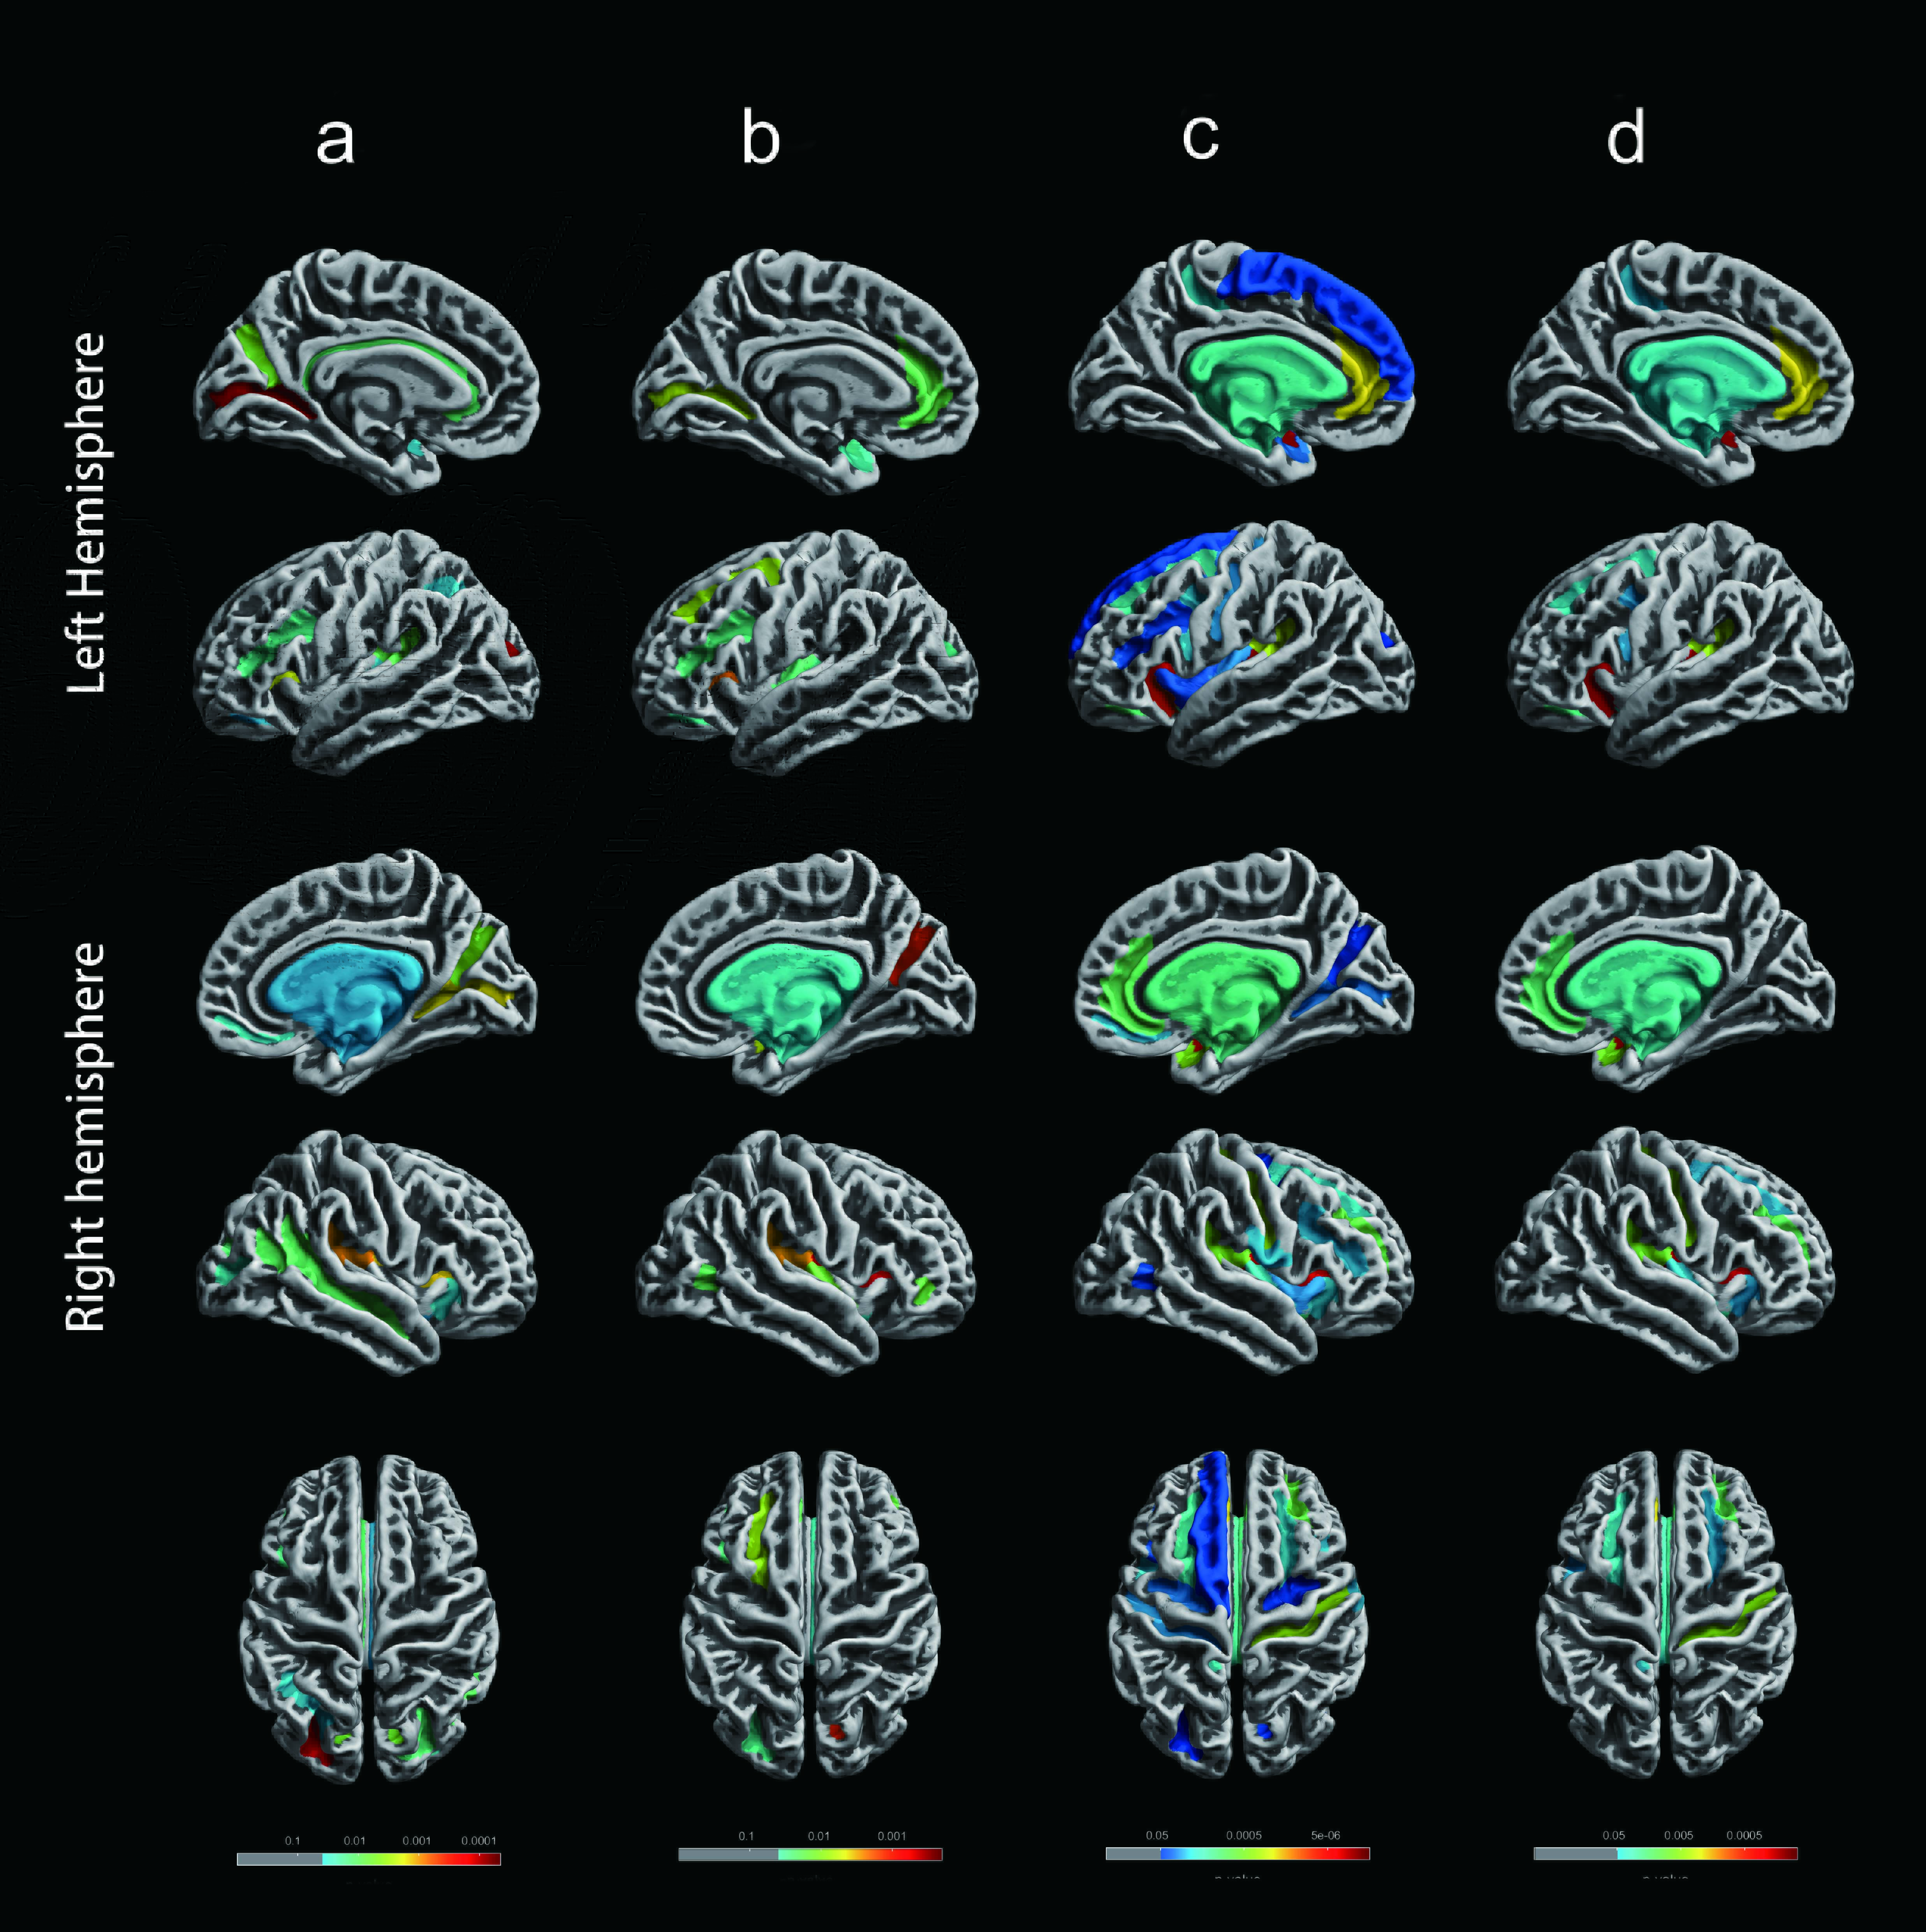
Compared to the group1, we found subjects in the group2 showed both the thinner (bilateral insular gyrus and cingulate gyrus) and thicker CTh (left precuneus, middle temporal, and the middle frontal areas). Furthermore, the group3 exhibited decreased CTh in the bilateral angular gyrus, , middle temporal, left middle frontal, right precuneus and superior parietal cortex. Results from the group4 showed the most widespread cortical atrophy than group1, involving most neocortex. About FD value, we found the group2 exhibited reduced FD including left postcentral, middle frontal, right cingulate and insula gyrus, and the group3 showed decreased FD in left middle frontal and superior temporal gyrus as well as right insular gyri and straight gyrus. Within the group4 reductions included bilateral insula gyrus, left middle frontal, right inferior temporal and middle occipital areas. Regarding the GI, we found that GI decreased in the bilateral transverse occipital sulcus, calcarine sulcus, circular sulcus of the insula, lateral sulcus and parieto-occipital sulcus in the group2. The group3 showed reductions in the bilateral circular sulcus of the insula, left calcarine sulcus, cingulate gyrus, right parieto-occipital sulcus, and lateral sulcus. Compared to the group3, the group4 showed more reduction regions such as bilateral central sulcus and superior temporal gyrus.In another sample, we obtained similar results.
Discussion
First, our results supported a biphasic trajectory of changes for CTh which have been reported in previous studies3-5.In the group2, we observed cortical thickening in left precuneus, middle temporal and the middle frontal areas. The group3 exhibited more significant atrophy, including bilateral angular gyrus, middle temporal, superior parietal, right precuneus and left middle frontal cortex. Some studies have suggested that cortical thickening occurs long before cognitive impairment, and it is likely the result of neuronal compensatory hypertrophy under the influence of amyloid deposition6-7.Then, the interaction between amyloid and p-tau could cause the regional cortical thinning8.Second, the locations of brain regions with significantly decreased CTh in the group3 were as same as that in the group4, but the latter showed wider range CTh reduction. Conventional AD diagnosis mainly relied on cognitive assessment which could find cognitive deficit9. In AD patients with dementia, related pathophysiological progress has already lasted and interfered with the brain for a very long period. But the biological AD is defined by indicative biomarkers independent from cognitive assessment. Most of the subjects in group3 were asymptomatic and decreased CTh were detected in an early stage.Third, we found more regions with reduced surface index in the group3 and group4 compared to the group2. It is likely that with the more biomarkers group becoming abnormal, the more serious cerebral pathologic change. There may be an unknown interaction between amyloid and p-tau.Conclusion
Our study supported that applying biological definition to the research could be beneficial for early detection, diagnosis, and intervention. Also our finding confirmed that CTh showed a biphasic trajectory of change in Alzheimer's continuum.Acknowledgements
No acknowledgement found.References
1.Jack CR, Jr. et al. (2018) NIA-AA Research Framework: Toward a biological definition of Alzheimer's disease Alzheimers Dement 14:535-562 doi:10.1016/j.jalz.2018.02.018
2.Shaw LM et al. (2009) Cerebrospinal fluid biomarker signature in Alzheimer's disease neuroimaging initiative subjects Ann Neurol 65:403-413 doi:10.1002/ana.21610
3.Dickerson BC et al. (2009) The cortical signature of Alzheimer's disease: regionally specific cortical thinning relates to symptom severity in very mild to mild AD dementia and is detectable in asymptomatic amyloid-positive individuals Cereb Cortex 19:497-510 doi:10.1093/cercor/bhn113
4.Cantero JL et al. (2018) Cerebral changes and disrupted gray matter cortical networks in asymptomatic older adults at risk for Alzheimer's disease Neurobiol Aging 64:58-67 doi:10.1016/j.neurobiolaging.2017.12.010
5.Montal V et al. (2018) Cortical microstructural changes along the Alzheimer's disease continuum Alzheimers Dement 14:340-351 doi:10.1016/j.jalz.2017.09.013
6.Chetelat G et al. (2010) Larger temporal volume in elderly with high versus low beta-amyloid deposition Brain 133:3349-3358 doi:10.1093/brain/awq187
7.Iacono D et al. (2008) Neuronal hypertrophy in asymptomatic Alzheimer disease J Neuropathol Exp Neurol 67:578-589 doi:10.1097/NEN.0b013e3181772794
8.Fortea J et al. (2014) Cerebrospinal fluid beta-amyloid and phospho-tau biomarker interactions affecting brain structure in preclinical Alzheimer disease Ann Neurol 76:223-230 doi:10.1002/ana.24186
9.McKhann GM et al. (2011) The diagnosis of dementia due to Alzheimer's disease: recommendations from the National Institute on Aging-Alzheimer's Association workgroups on diagnostic guidelines for Alzheimer's disease Alzheimers Dement 7:263-269 doi:10.1016/j.jalz.2011.03.005
Figures