3058
Towards a better understanding of Alzheimer’s Disease: Rasch transformation of cognitive assessment data yields better linear description of cognition using neurometabolite concentrations as explanatory variables1Physikalisch-Technische Bundesanstalt (PTB), Braunschweig and Berlin, Germany, 2RISE Metrology, Gothenburg, Sweden, 3Corporate Member of Freie Universität Berlin, Humboldt-Universität zu Berlin, and Berlin Institute of Health, Klinik und Hochschulambulanz für Neurologie, Charité - Universitätsmedizin Berlin, Berlin, Germany, 4Corporate Member of Freie Universität Berlin, Humboldt-Universität zu Berlin, and Berlin Institute of Health, NeuroCure Clinical Research Center, Charité - Universitätsmedizin Berlin, Berlin, Germany, 5Modus Outcomes, Letchworth Garden City, United Kingdom, 6Studies on Prevention of Alzheimer's Disease (StOP-AD) Centre, Douglas Mental Health University Institute, Montreal, QC, Canada, 7Department of Psychiatry, McGill University, Montreal, QC, Canada, 8Department of Neurology, University Medicine Greifswald, Greifswald, Germany
Synopsis
Due to its non-invasive nature, magnetic resonance spectroscopy is a promising tool for investigating neurochemical disease processes, monitoring potential therapy responses, and diagnosis of Alzheimer’s disease (AD). Changes of γ-amino-butyric acid (GABA) and glutamate (Glu) concentrations have been associated with AD, however, their relationship to other disease parameters is still unknown. This work aims to investigate the relationship of GABA and Glu with cognitive measures and demonstrates that the application of Rasch transformation to cognitive assessment data yields more reliable descriptions of cognitive outcome using metabolite concentrations as explanatory variables.
Introduction
Alzheimer’s Disease (AD) is a progressive and debilitating disease, of which underlying mechanisms are still not understood. The ongoing, multidisciplinary European research project NeuroMET1, aims to reduce measurement uncertainties of AD biomarkers and further the understanding of development and progression of the disease. Magnetic resonance spectroscopy (MRS) holds great potential as a non-invasive tool for investigating neurochemical disease processes, monitoring potential therapy responses, and diagnosis. It was shown previously2 that changes of γ-amino-butyric acid (GABA) and glutamate (Glu) concentrations might be potential biomarkers for AD, however, their relationship to other disease parameters is hitherto unknown.
Cognitive status of AD patients is usually assessed by ordinal scores of neuropsychological tests, i.e. sum of task scores to total scores. However, this neither accounts for the difficulty of the different sub-tasks within the tests, nor for potential non-linearities in that ordinal score3,4. Regarding the Mini-Mental State Examination5 (MMSE) and the Alzheimer’s Disease Assessment Scale – Cognitive subscale test6,7 (ADAS-Cog), this leads to decreased sensitivity to detect subtle changes in cognitive performance and hence, might even undermine the outcome of AD-drug trials8,9,10. To overcome these issues, Rasch measurement analysis11 has been suggested, to transform the assessment scales of commonly used neuropsychological tests into linear, interval-level variables and thereby improve reliability of cognitive performance measures. It has already been demonstrated that Rasch transformation of MMSE data yields improved correlation with the volume of the right amygdala in AD8. This work aims to investigate the relationship of metabolite concentrations with ordinal and Rasch transformed cognitive measures.
Methods
Data were acquired on a 7T scanner (Magnetom, Siemens Healthineers, Erlangen, Germany) using a 1TX/32RX head coil (NOVA Medical, Wilmington, USA).
Cohort: A subcohort of 74 subjects (36 healthy controls (HC), 17 mild cognitive impaired (MCI), and 21 AD patients; mean age (SD): 71.6 (7.2) years) from the ongoing NeuroMET study were examined so far, after giving written, informed consent according to local ethics regulations.
Neuropsychological Testing: Cognitive performance was assessed using the MMSE and the Digital Span Test12 (DST) Forward. Cognitive assessment data was acquired on a single item basis and then Rasch transformed using the WINSTEPS® Rasch Analysis and Rasch Measurement software version 4.2.013.
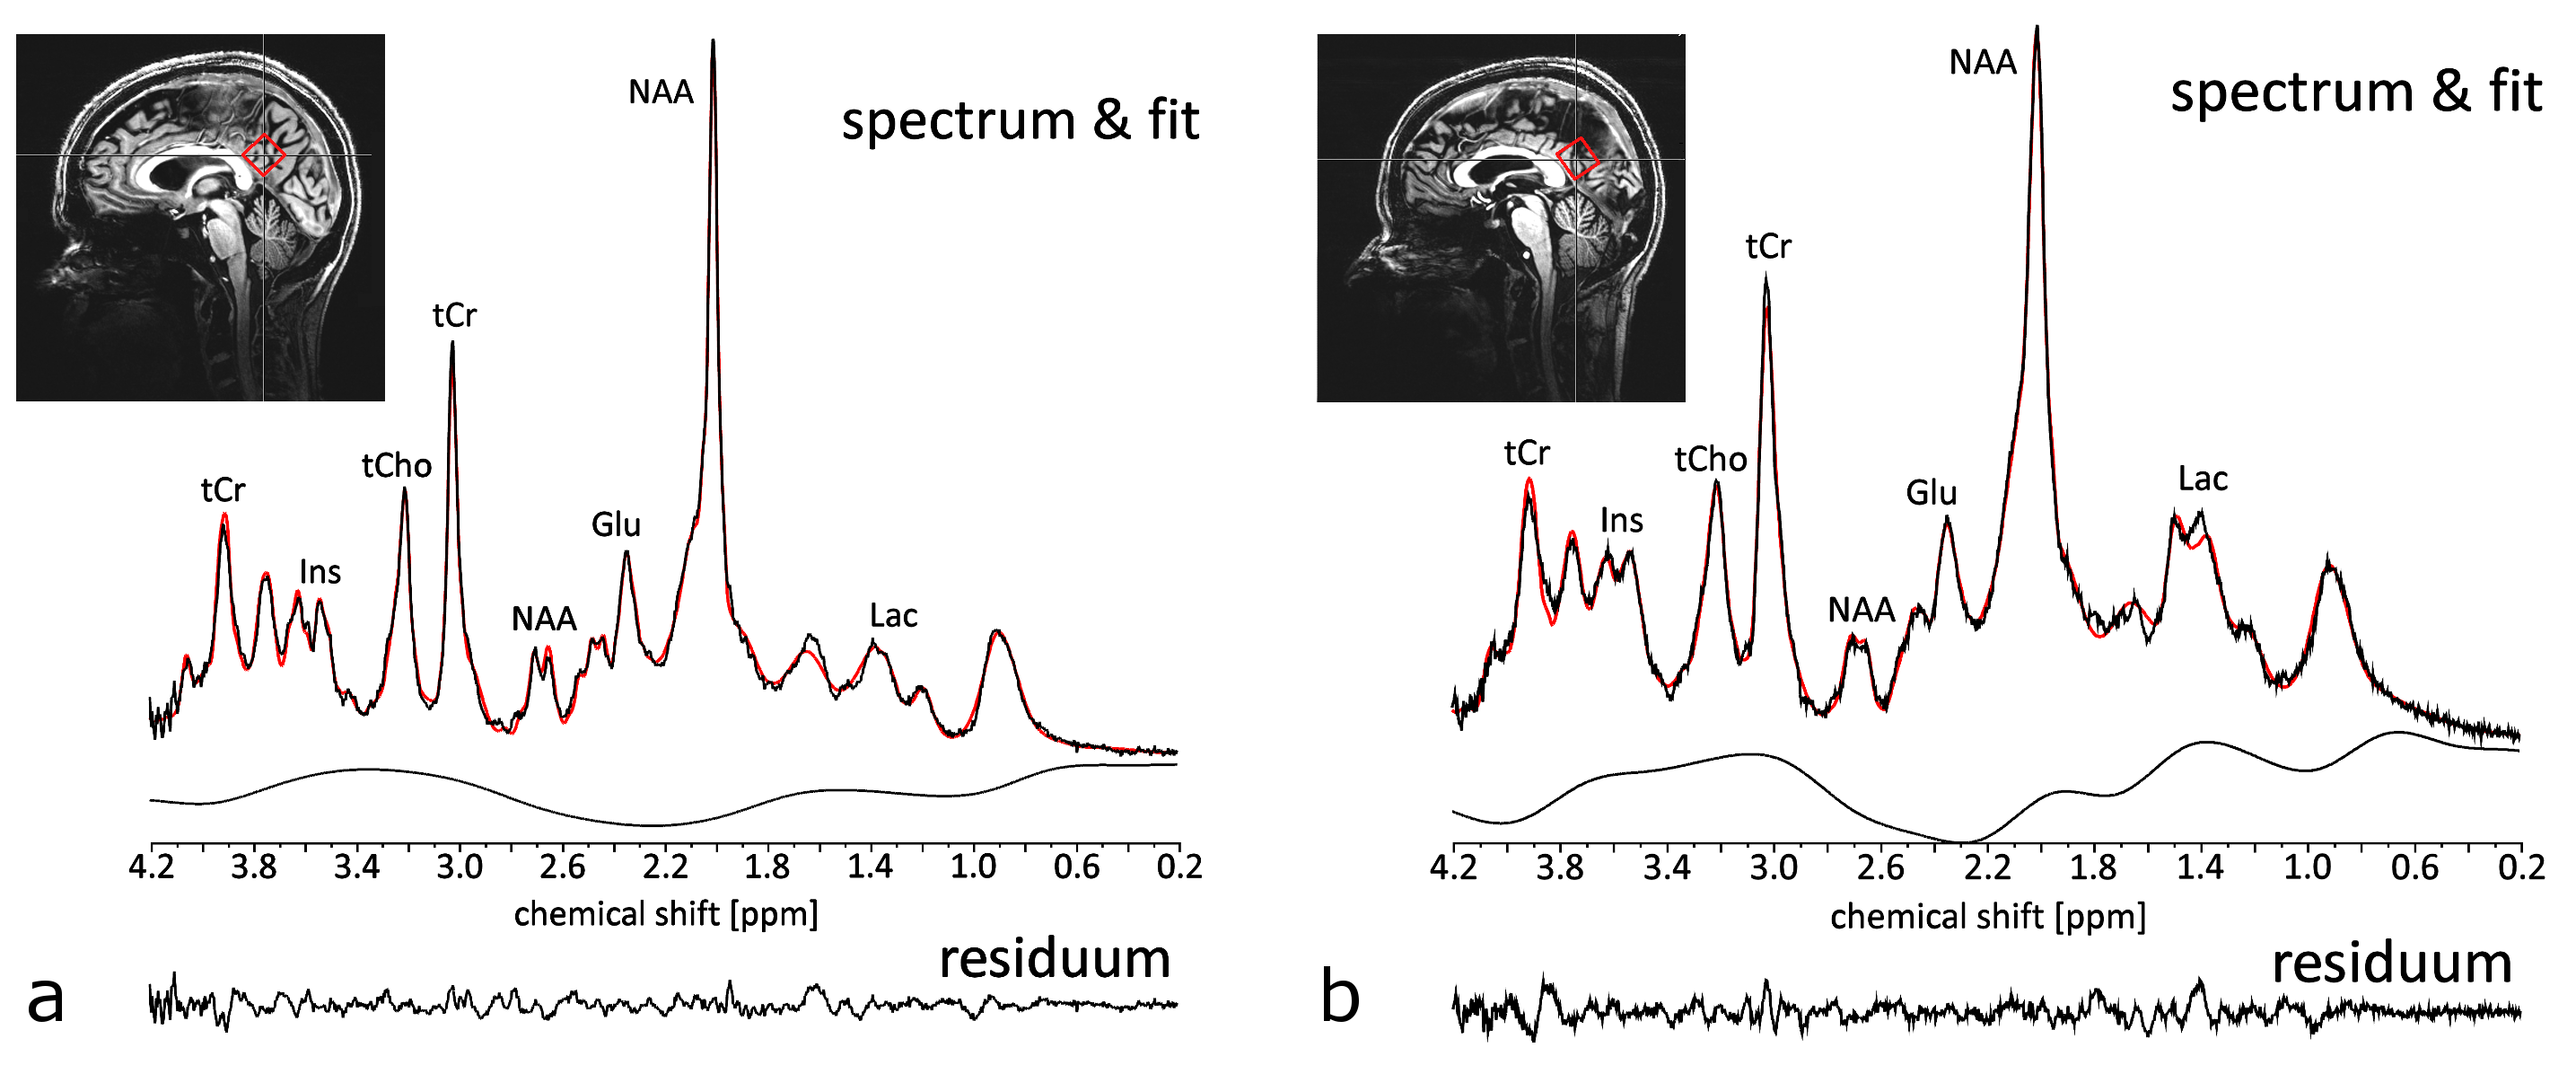
Spectroscopy: After acquiring an MP2RAGE14,15 anatomical image the MRS voxel (20×20×20mm3) was positioned in the posterior cingulate cortex. Localized RF calibration and 2nd order B0 shimming16 were performed prior to MRS measurements using SPECIAL17,18 (TE/TR=9ms/6500ms; 64 averages; VAPOR water suppression). A non-water-suppressed reference spectrum (4 averages) from the same voxel was acquired. Coil combination, frequency correction, and averaging were performed using a home-written reconstruction algorithm. LCModel19 was employed for quantification. Metabolite concentrations were corrected for relaxation and CSF fraction within the voxel. Metabolite concentrations with Cramer-Rao lower bounds (CRLBs) >20% were excluded from further analysis.
Statistics: The significance of correlations between metabolite concentrations associated with AD and the performance on the MMSE and the DST were investigated. Correlations were adjusted for age and sex.
Results and Discussion
The high spectral quality achieved by SPECIAL and careful RF calibration and B0 shimming, allowed a robust metabolite quantification including neurotransmitters Glu and GABA. Figure 1 displays typical spectra from an HC and an AD patient.
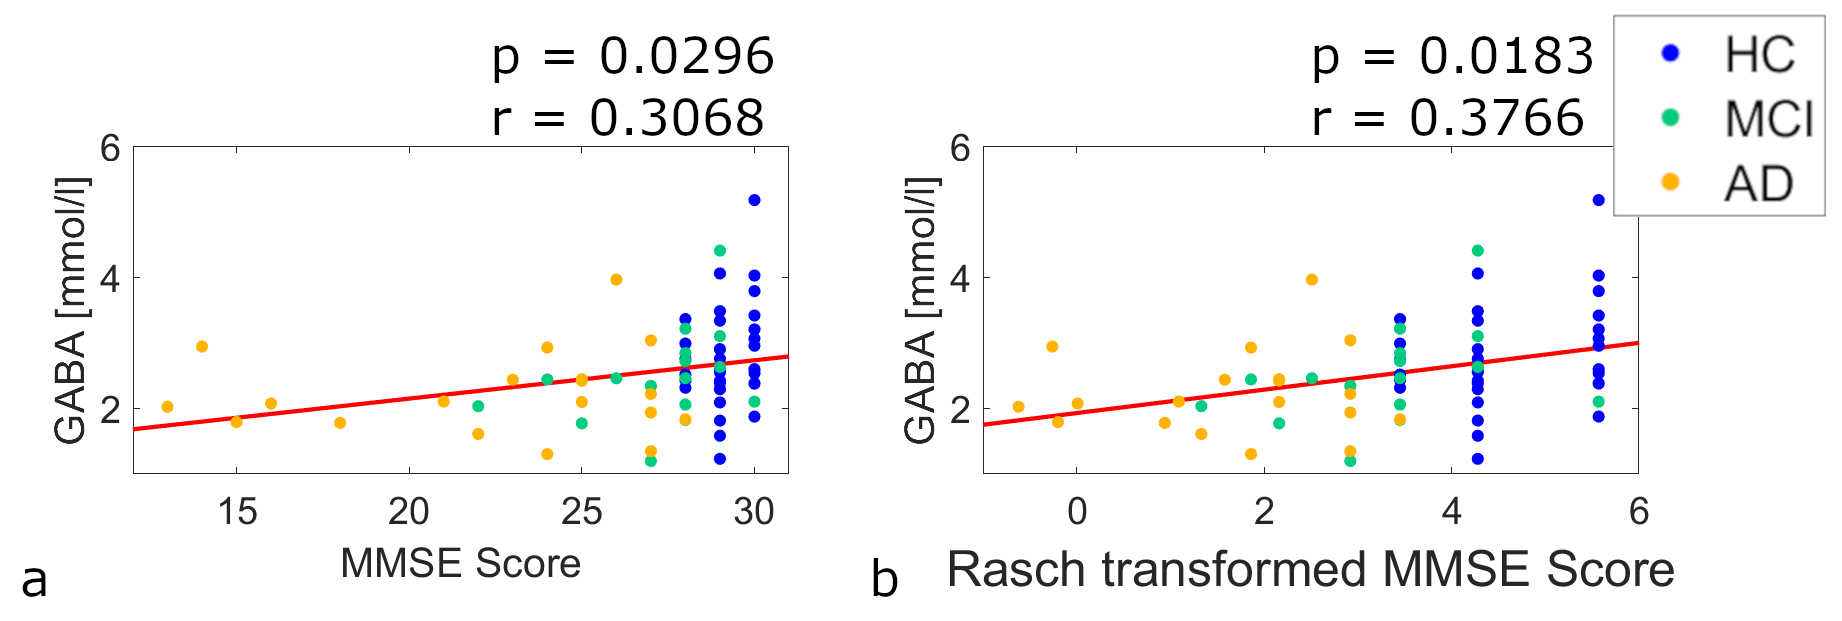
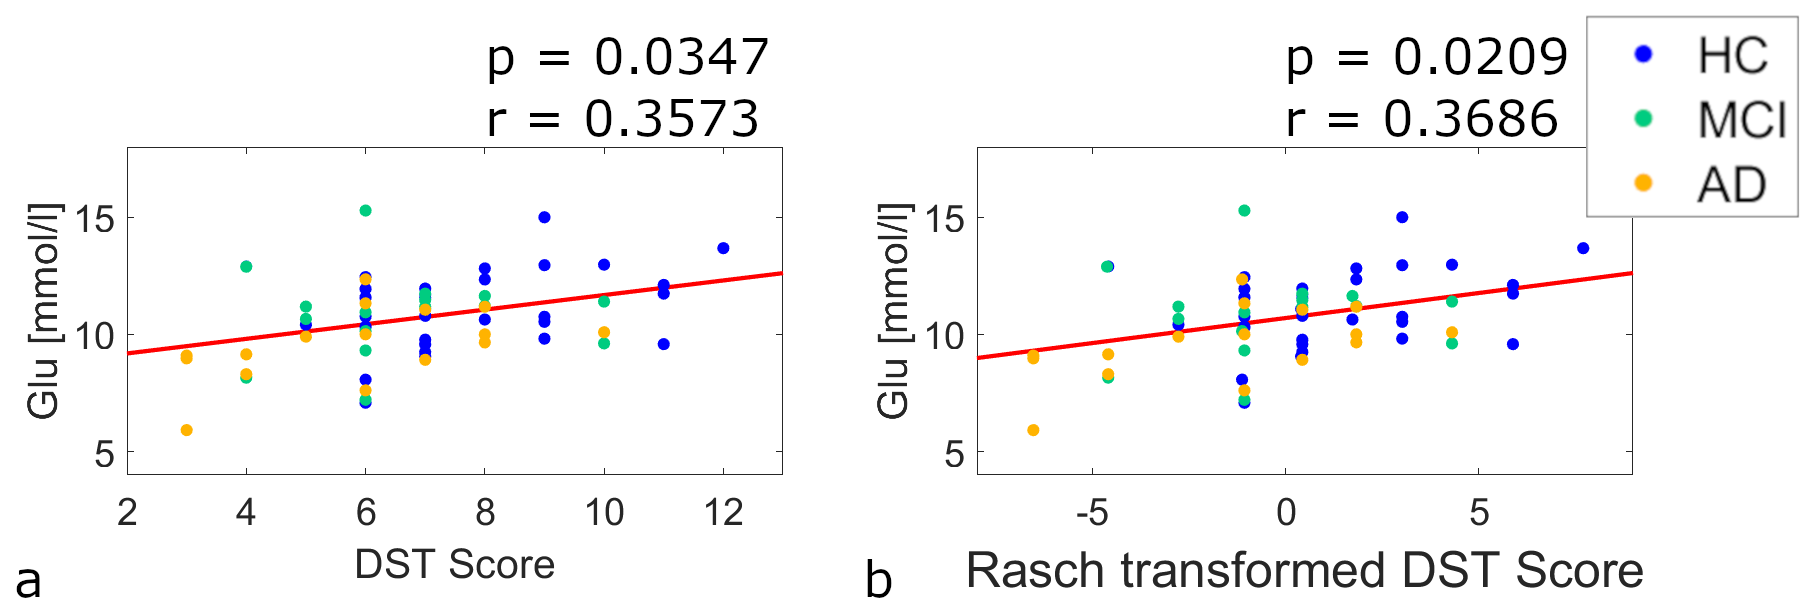
Since not all participants completed both cognitive tests, we ended up with 67 datasets for the DST Forward and 70 data sets for the MMSE. Figure 2 shows the correlation of the GABA concentration with the MMSE score obtained by ordinal scoring (a), and by Rasch transformation (b). It can be seen that after Rasch transformation the correlation between the GABA concentration and the MMSE score is slightly stronger and exhibits increased significance. In Figure 3, the relationship between Glu and the DST score is depicted. Correlation strength is unchanged but a slightly higher significance can be observed when Rasch transformation is used on the DST Forward score. No other significant correlations were found between metabolite concentrations and either of the two cognitive tests (p>0.05). Since the MMSE assesses various cognitive domains, and the DST Forward specifically assesses the short-term memory performance, these results might indicate that changes in GABA concentration affect several cognitive domains whereas changes in Glu concentrations mostly affect short term memory. Further research is required, however, to confirm these results.
Conclusion
Across the NeuroMET cohort of HC, MCI, and AD subjects, GABA and Glu concentrations exhibit a significant correlation with global cognition and short-term memory, respectively. Rasch transformation of cognitive measures icreases reliability of correlations between cognitive performance and physiological the biomarkers GABA and Glu, thereby allowing for a better linear description of cognitive outcome using MR biomarkers as explanatory variables.Acknowledgements
This project has received funding from the EMPIR programme co-financed by the Participating States and from the European Union’s Horizon 2020 research and innovation programme. This paper reflects only the author's view and EURAMET is not responsible for any use that may be made of the information it contains.References
[1] https://www.lgcgroup.com/our-science/national-measurement-laboratory/european-metrology-programme-for-innovation-and-re/neuromet/
[2] A. Fillmer, T. Köbe, S. Aydin, L. Göschel, A. Flöel, F. Schubert, B. Ittermann. "Correlations Between Brain Structural Volumes and Brain Metabolite Concentrations in Alzheimer’s Disease: Preliminary Results from the NeuroMET Project". Proc Int Soc Magn Reson Med 26: 3903 (2018)
[3] A. Tennant, P.G. Conaghan. "The Rasch Measurement Model in Rheumatology: What is It and Why Use It? When Should It Be Applied, and What Should One Look for in a Rasch Paper?". Arthritis & Rheumatism 57: 1358-1362 (2007)
[4] J. Hobart, S. Cano. "Improving the evaluation of therapeutic interventions in multiple sclerosis: the role of new psychometric methods". Health technology assessment 13: 1-177.(2009)
[5] J.C. Morris, A. Heyman, R.C. Mohs, J.P. Hughes, G. van Belle, G. Fillenbaum, E.D. Mellits, C. Clark, the CERAD investigators. "The Consortium to Establish a Registry for Alzheimer’s Disease (CERAD). Part 1. Clinical and Neuropsychological Assessment of Alzheimer’s Disease". Neurology 39: 1159-1165 (1989)
[6] K. Mohs, W. Rosen, K. Davis. "The Alzheimer’s Disease Assessment Scale: an instrument for assessing treatment efficacy". Psychopharmacol Bull 19: 448e50.6 (1983)
[7] W. Rosen, R. Mohs, K. Davis. "A new rating scale for Alzheimer’sdisease". Am J Psychiatry 141: 1356e64 (1984)
[8] L.R. Pendrill. “Assuring measurement quality in person-centered healthcare”. MST 29:034003 (2018)
[9] J. Hobart, S. Cano, H. Posner, O. Selnes, Y. Stern, R. Thomas, J. Zajicek, Alzheimer’s Disease Neuroimaging Initiative. "Putting the Alzheimer’s Cognitive test to the test I: Traditional psychometric methods". Alzheimer’s and Dementia 9: 4-9 (2013)
[10] J. Hobart, S. Cano, H. Posner, O. Selnes, Y. Stern, R. Thomas, J. Zajicek, Alzheimer’s Disease Neuroimaging Initiative. "Putting the Alzheimer’s cognitive test to the test II: Rasch Measurement Theory". Alzheimer’s and Dementia 9: 10-20 (2013)
[11] G. Rasch. "Probabilistic models for some intelligence and attainment tests". Chicago: University of Chicago (1960)
[12] D. Wechsler. "WAIS-IV administration and scoring manual". San Antonio, TX: Psychological Corporation. (2008)
[13] J.M. Linacre. "A User’s Guide to Winsteps: Rasch-Model Computer Programs". Chicago: Winsteps.com (2018) http://winsteps.com/
[14] J. P. Marques, T. Kober, G. Krueger, W. van der Zwaag, P.-F. Van de Mortele, R. Gruetter. „MP2RAGE, a self bias-field corrected sequence for improved segmentation and T1-mapping at high field“. NeuroImage 49:1271-1281 (2010)
[15] K. R. O’Brien, T. Kober, P. Hagmann, P. Maeder, J. Marques, F. Lazeyras, G. Krueger, A. Roche. „Robust T1-Weighted Structural Brain Imaging and Morphometry at 7T Using MP2RAGE“. PLOS One 9:e99676 (2014)
[16] S. Nassirpour, P. Chang, A. Fillmer, A. Henning. “A Comparison of Optimization Algorithms for Localized in Vivo B0 Shimming”. Magn Reson Med DOI 10.1002/mrm.26758 e-pub ahead of print (2017)
[17] V. Mlynarik, G. Gambarota, H. Frenkel, R. Gruetter. “Localized Short-Echo-Time Proton MR Spectroscopy With Full Signal-Intensity Acquisition”. Magn Reson Med 56:956-970 (2006)
[18] R. Mekle, V. Mlynarik, G. Gambarota, M. Hergt, G. Krueger, R. Gruetter. “MR Spectroscopy of the Human Brain With Enhanced Signal Intensity at Ultrashort Echo Times on a Clinical Platform at 3T and 7T”. Magn Reson Med 61:1279-1285 (2009)
[19] S. W. Provencher. “Estimation of metabolite concentrations from localized in vivo proton NMR spectra”. Magn Reson Med 30:672-679 (2993)
Figures