3057
Association between T1rho relaxation time and iron deposition among AD patients and normal controls1Department of Imaging and Interventional Radiology, The Chinese University of Hong Kong, Hong Kong, Hong Kong, 2Department of Medicine & Therapeutics, Chinese University of Hong Kong, Hong Kong, Hong Kong
Synopsis
In this study, we investigated the relationship of iron deposition and T1rho measurement in thalamus among AD patients and healthy controls. Despite the theory indicates elevated iron concentration can decrease
Introduction
Alzheimer’s Disease (AD) is the most common form of neurodegenerative disorder that causes dementia in elderly1. Abnormal iron deposition of AD and normal aging have been investigated recently2. T1rho characterizes the spin relaxation constant along the effective spin-lock field at the presence of spin-lock radiofrequency (RF) pulse. Quantitative T1rho imaging has been investigated as a biomarker for AD diagnosis1,3. In the biological aspect, depending on tissue types, there are more than one interaction mechanisms which may contribute to the T1rho value level simultaneously. Iron deposition could potentially contribute to changes of T1rho relaxation time. This study aims to observe the association between T1rho relaxation time and iron deposition among AD patients and normal controls.Method
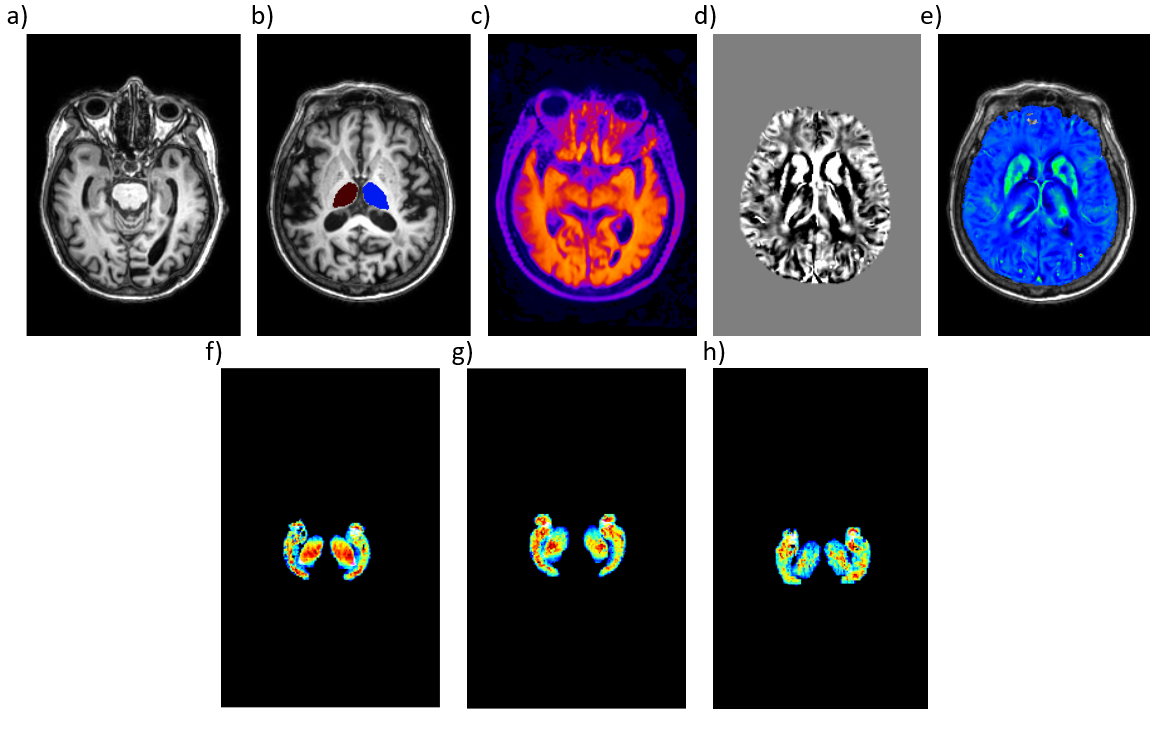
In the current study, we included 18 subjects (age: 55 – 80 years): 5 subjects have late-stage AD patients, 4 subjects have early-stage AD and 9 are normal controls. The diagnosis was confirmed by PET scan. The T1-weighted 3D images of each subject were prepared for subsequent processing, image registration, segmentation and anatomical labelling(Figure.1). Subjects scan was conducted under the approval of the Institutional Review. Quantitative susceptibility mapping (QSM) was used to measure iron level in the brain. T1rho was measured using T1rho-prepared 3D Fast Spin Echo acquisition. The fluid was suppressed during T1rho acquisition.
All datasets were acquired from a Philips Achieva TX 3.0T scanner (Philips Healthcare, the Netherlands). The imaging for QSM includes: resolution 0.6x0.6x0.8mm. 8 echoes with TE1 4.0ms and delta 5.2ms, TR 45ms, total 60 slices with scan time 5:19min. For 3D T1rho, resolution 1.8x1.8x1.8mm, 5 time-of-spinlock (TSL) 0, 10, 25, 45, 85ms, the frequency of spinlock (FSL) 400Hz, TR/TE 5000/25ms, total 60 slices with scan time 5min. A 3-D voxel base averaging analysis method is applied for T1rho quantification to avoid potential errors due to noise. The T1rho-weighted images and QSM images were co-registered with the T1-weighted image that can provide anatomical structure and edges for locating the position and slice by slice matching. The Volbrain (José V. Manjón (IBIME, UPV, Spain) and Pierrick Coupé (LaBRI UMR 5800, Université de Bordeaux, CNRS, France)) was used for segmentation of brain tissues.
Result
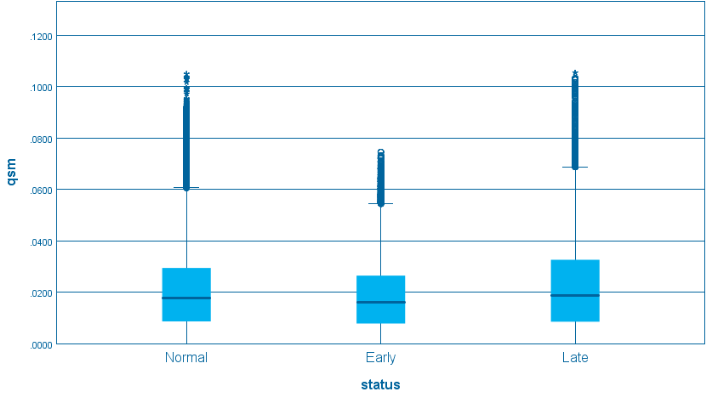
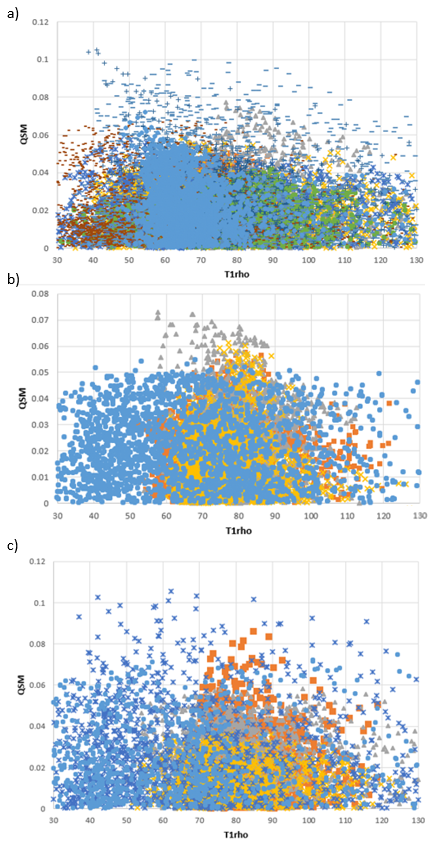
Figure.2 shows the results of QSM in the thalamus. No significant difference in susceptibility measurement was observed in these groups of subjects. Figures 3 show scatter plots of T1rho and QSM measurement in normal, early-stage AD, and late-stage AD, respectively. Note there is no significant correlation between QSM measurement and T1rho for three groups of subjects.Discussion
We choose thalamus in our study because it is more likely to have iron deposition. In theory, we expect iron deposition can lead to change of T1rho value. Consequently, there should be a correlation with iron content and T1rho value. However, we did not observe a strong correlation between iron measurement and T1rho quantification in the thalamus. One possible reason is that the iron level change in the thalamus of these subjects is not significant enough to alter the T1rho value we measured. It is also possible there are other confounding factors which can obscure the underneath correlation between iron content and T1rho. We did not observe obvious artefacts and errors in our process. However, further study is needed to understand the correlation of iron deposition and T1rho.Conclusion
Our study shows there is no obvious association between T1rho and iron deposition in the thalamus of control and AD subjects.Acknowledgements
This study is supported by a grant from the Innovation and Technology Commission of the government of Hong Kong SAR (Project ITS/469/16) and a grant from the Research Grants Council of the Hong Kong SAR (Project SEG CUHK02).References
1. Haris M, McArdle E, Fenty M, Singh A, Davatzikos C, Trojanowski JQ, Melhem ER, Clark CM, Borthakur A. Early marker for Alzheimer's disease: Hippocampus T1rho (T1ρ) estimation. Journal of Magnetic Resonance Imaging: An Official Journal of the International Society for Magnetic Resonance in Medicine. 2009 May;29(5):1008-12.
2. Acosta-Cabronero, J., Betts, M. J., Cardenas-Blanco, A., Yang, S., & Nestor, P. J. (2016). In Vivo MRI Mapping of Brain Iron Deposition across the Adult Lifespan. Journal of Neuroscience,36(2), 364-374. doi:10.1523/jneurosci.1907-15.2016
3. Borthakur A, Sochor M, Davatzikos C, Trojanowski JQ, Clark CM. T1ρ MRI of Alzheimer's disease. Neuroimage. 2008 Jul 15;41(4):1199-205.
Figures