3056
Quantitative Susceptibility Mapping in Alzheimer's Disease1Department of Neurology, Medical University of Graz, Graz, Austria
Synopsis
Using QSM and R2* mapping we found higher iron levels in specific basal ganglia structures in a cohort of 100 patients with AD when compared to 100 age-matched controls. Iron load in the basal ganglia was negatively correlated with brain volume measures.
Introduction
Based on histological findings showing iron-induced free radical damage and oxidative stress1,2 recent in vivo studies have demonstrated that higher iron concentrations in Alzheimer's Disease (AD) are linked to memory and cognitive decline3–5. While tau promotes the export of iron by facilitating the movement of APP to the surface6, senile plaques are agglomerations of amyloid-beta proteins which have been found highly affine to paramagnetic iron AD brains7.
In this work we utilize quantitative susceptibility mapping (QSM), a novel MRI technique as well as R2* relaxation rate mapping to assess iron deposition in the basal ganglia (BG) in patients with AD8,9.
Methods
We included 100 patients with probable and possible AD according to the NINCDS-ADRDA criteria (mean age=71.24±8.06 years; male/female=43/57). For comparison we selected 100 healthy controls matched for age (±1 year; male/female=37/63) (HC) from an ongoing study in community dwelling subjects10.
Patients and controls underwent extensive clinical testing as well as a consistent quantitative MRI protocol at 3 Tesla (Siemens TimTrio). MRI included a structural T1-weighted MPRAGE sequence with 1mm isotropic resolution, FLAIR imaging for lesion detection and a 3D multi-echo gradient echo sequence (TR/TE1/FA=35ms/4.92ms/20° with 6 equally spaced echoes, 0.9x0.9x2mm³ resolution, 64 slices). R2* relaxation data was obtained by Sinc-corrected modeling of the magnitude decay11 and QSM images calculated by using a TGV-based dipole inversion algorithm and normalized to CSF12.
Anatomical structures were automatically segmented using FSL FIRST13 to obtain regional median R2* and QSM values for the Caudate, Putamen, Pallidum, Hippocampus, and Thalamus. Normalized brain volume metrics were analyzed by using SIENAX from FSL13. For correlation analyses and statistical tests with clinical and volumetric variables we utilized the global basal ganglia value BG = mean (Caudate, Putamen, Pallidum).
Results
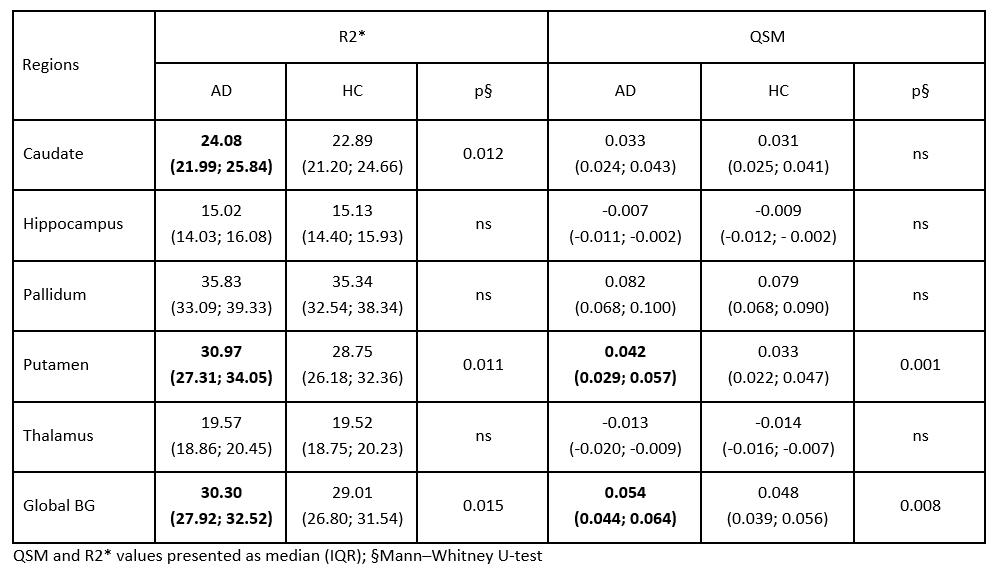
R2* and QSM were increased in the putamen of patients with AD, and R2* was also higher in the caudate nucleus of AD patients. Global BG values for QSM and R2* where higher in AD compared to controls (Table 1).
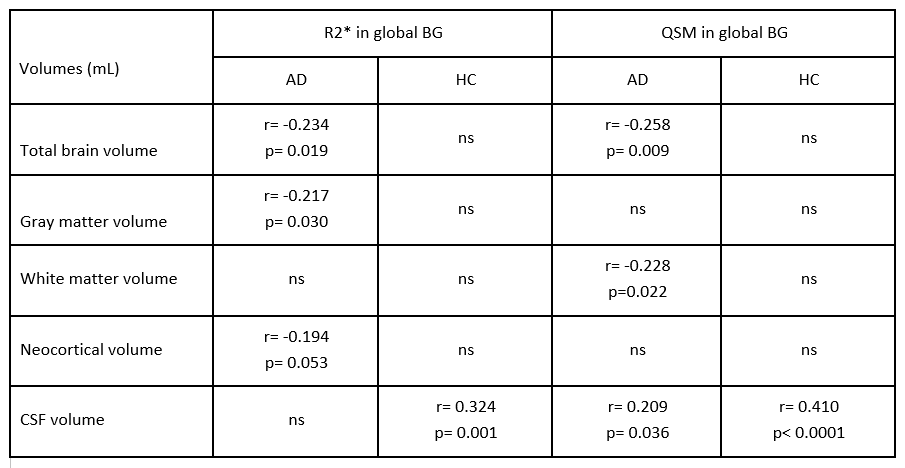
We found positive correlation of BG R2* and BG QSM with ventricular cerebrospinal fluid volume in both AD and controls. Only in AD patients, QSM and R2* were inversely related to total brain volume and volume of gray matter, white matter, and neocortex (Table 2).
Discussion and Conclusion
We found higher iron levels in structures of the basal ganglia in a cohort of 100 patients with AD when compared to 100 age-matched controls. Although QSM and R2* are both highly sensitive to brain iron they exhibit a counteracting behavior regarding myelin and axonal damage and may thus provide complementary information about underlying pathological tissue changes.
Increased iron deposition was linked to bigger ventricular volume in both groups. Nonetheless, only AD patients but not controls showed additionally negative correlations between BG iron load and brain volume metrics, indicating a more widespread pattern of disease compared to healthy aging, at least to a certain extent.
These findings support the view that iron deposition in the basal ganglia is at least partly involved in neurodegenerative processes. Future studies in this cohort will determine the clinical significance and combined QSM and R2* assessment will test which of the two measures, if any, relates more closely to the clinical status of patients.
Acknowledgements
No acknowledgement found.References
1. Connor JR, Menzies SL, St. Martin SM, Mufson EJ. A histochemical study of iron, transferrin, and ferritin in Alzheimer’s diseased brains. J Neurosci Res. 1992;31: 75–83.
2. Smith MA, Harris PLR, Sayre LM, Perry G. Iron accumulation in Alzheimer disease is a source of redox-generated free radicals. Proceedings of the National Academy of Sciences. 1997;94: 9866–9868.
3. Ayton S, Fazlollahi A, Bourgeat P, Raniga P, Ng A, Lim YY, et al. Cerebral quantitative susceptibility mapping predicts amyloid-β-related cognitive decline. Brain. 2017;140: 2112–2119.
4. Qin Y, Zhu W, Zhan C, Zhao L, Wang J, Tian Q, et al. Investigation on positive correlation of increased brain iron deposition with cognitive impairment in Alzheimer disease by using quantitative MR R2′ mapping. J Huazhong Univ Sci Technolog Med Sci. 2011;31: 578–585.
5. Zhu W-Z, Zhong W, Wang W, Zhan C-J, Wang C-Y, Qi J-P, et al. Quantitative MR Phase-corrected Imaging to Investigate Increased Brain Iron Deposition of Patients with Alzheimer Disease. Radiology. 2009;253: 497–504.
6. Bush AI. The Metal Theory of Alzheimer’s Disease. Perry G, Zhu X, Smith MA, Sorensen A, Avila J, editors. J Alzheimers Dis. 2012;33: S277–S281.
7. Meadowcroft MD, Peters DG, Dewal RP, Connor JR, Yang QX. The effect of iron in MRI and transverse relaxation of amyloid-beta plaques in Alzheimer’s disease. NMR Biomed. 2015;28: 297–305.
8. Langkammer C, Ropele S, Pirpamer L, Fazekas F, Schmidt R. MRI for Iron Mapping in Alzheimer’s Disease. Neurodegenerative Diseases. 2013;13: 189–191.
9. Acosta-Cabronero J, Williams GB, Cardenas-Blanco A, Arnold RJ, Lupson V, Nestor PJ. In Vivo Quantitative Susceptibility Mapping (QSM) in Alzheimer’s Disease. PLoS One. 2013;8: e81093.
10. Schmidt R, Enzinger C, Ropele S, Schmidt H, Fazekas F. Progression of cerebral white matter lesions: 6-year results of the Austrian Stroke Prevention Study. Lancet. 2003;361: 2046–2048.
11. Fernández‐Seara MA, Wehrli FW. Postprocessing technique to correct for background gradients in image‐based R2* measurements. Magn Reson Med. 2000;44: 358–366.
12. Langkammer C, Bredies K, Poser BA, Barth M, Reishofer G, Fan AP, et al. Fast quantitative susceptibility mapping using 3D EPI and total generalized variation. Neuroimage. 2015;111: 622–630.
13. Smith SM, Jenkinson M, Woolrich MW, Beckmann CF, Behrens TEJ, Johansen-Berg H, et al. Advances in functional and structural MR image analysis and implementation as FSL. Neuroimage. 2004;23: S208–S219.
Figures