3052
Diagnosis of Alzheimer’s diseases using hippocampal metabolite ratios at the subfield level1Institute of Cancer and Genomics, University of Birmingham, Birmingham, United Kingdom, 2Department of Radiology, The Affiliated Nanjing Drum Tower Hospital of Nanjing University Medical School, Nanjing, China
Synopsis
Hippocampal metabolite ratios can be used as clinical biomarkers to diagnose Alzheimer’s disease (AD), yet the metabolite ratios at a subfield level have been rarely reported, neither for its clinical diagnostic power. We aim to investigate the diagnostic power of metabolite ratios at a subfield level in AD with comparison to the whole level. A quantitative method of metabolite ratios was used, where 2D 1H-MRSI and 3D T1W volumetric MRI were co-registered. Statistical results show subfields have better diagnostic power than the whole hippocampus through metabolite ratios, and also prove the accuracy of the method for AD diagnosis.
Introduction
Hippocampal metabolite concentrations are known as sensitive biomarkers for Alzheimer’s disease (AD) pathology, however their alterations of a subfields level are still unclear1-4. Previously, we proposed a novel automatic quantitative method of metabolite ratios for hippocampal subfields, via registration between the two-dimensional proton magnetic resonance spectroscopy imaging (1H-MRSI) and the three-dimensional T1W volumetric magnetic resonance imaging (MRI)5. The method estimated the accumulative hippocampal metabolite ratios in the subfield level, and used analysis of co-variance to show a significant alteration from normal controls to mild cognitive impairment and then AD patients6. As the next stage, we assessed the diagnostic power of single or multiple hippocampal subfields and tried to find a better combination of metabolite ration estimating for AD diagnosis.Materials and methods
We used the same materials and methods proposed previously, but enhanced the data quality by manually checking the volume of interest (VOI) localisation and co-registration performance. In detail, the volumetric MRI of the whole hippocampus was initially segmented into 11 subfields using FreeSurfer 6.0, and the 1H-MRSI voxels were automatically selected and the corresponding volumetric proportion was measured for each hippocampal subfield by co-registration. The number of voxels occupied by the corresponding hippocampal subfields were calculated, which was used for estimating accumulated metabolite concentrations. Seventeen patients of AD, twenty-four patients with mild cognitive impairment (MCI), and twenty-one normal matched controls (NC) were involved for group comparison. Different from the analysis of variance used previously, we employed analysis of co-variance (ANCOVA) and receiver operating characteristics (ROC) to measure to diagnostic powers, and the former method had considered the co-variables including age, gender and years of education7. Initially, single subfields were assessed for the diagnostic power given by the significance from ANCOVA and ROC, and the combination of significant subfields were then assessed and compared back to the single subfields and whole hippocampus.Results
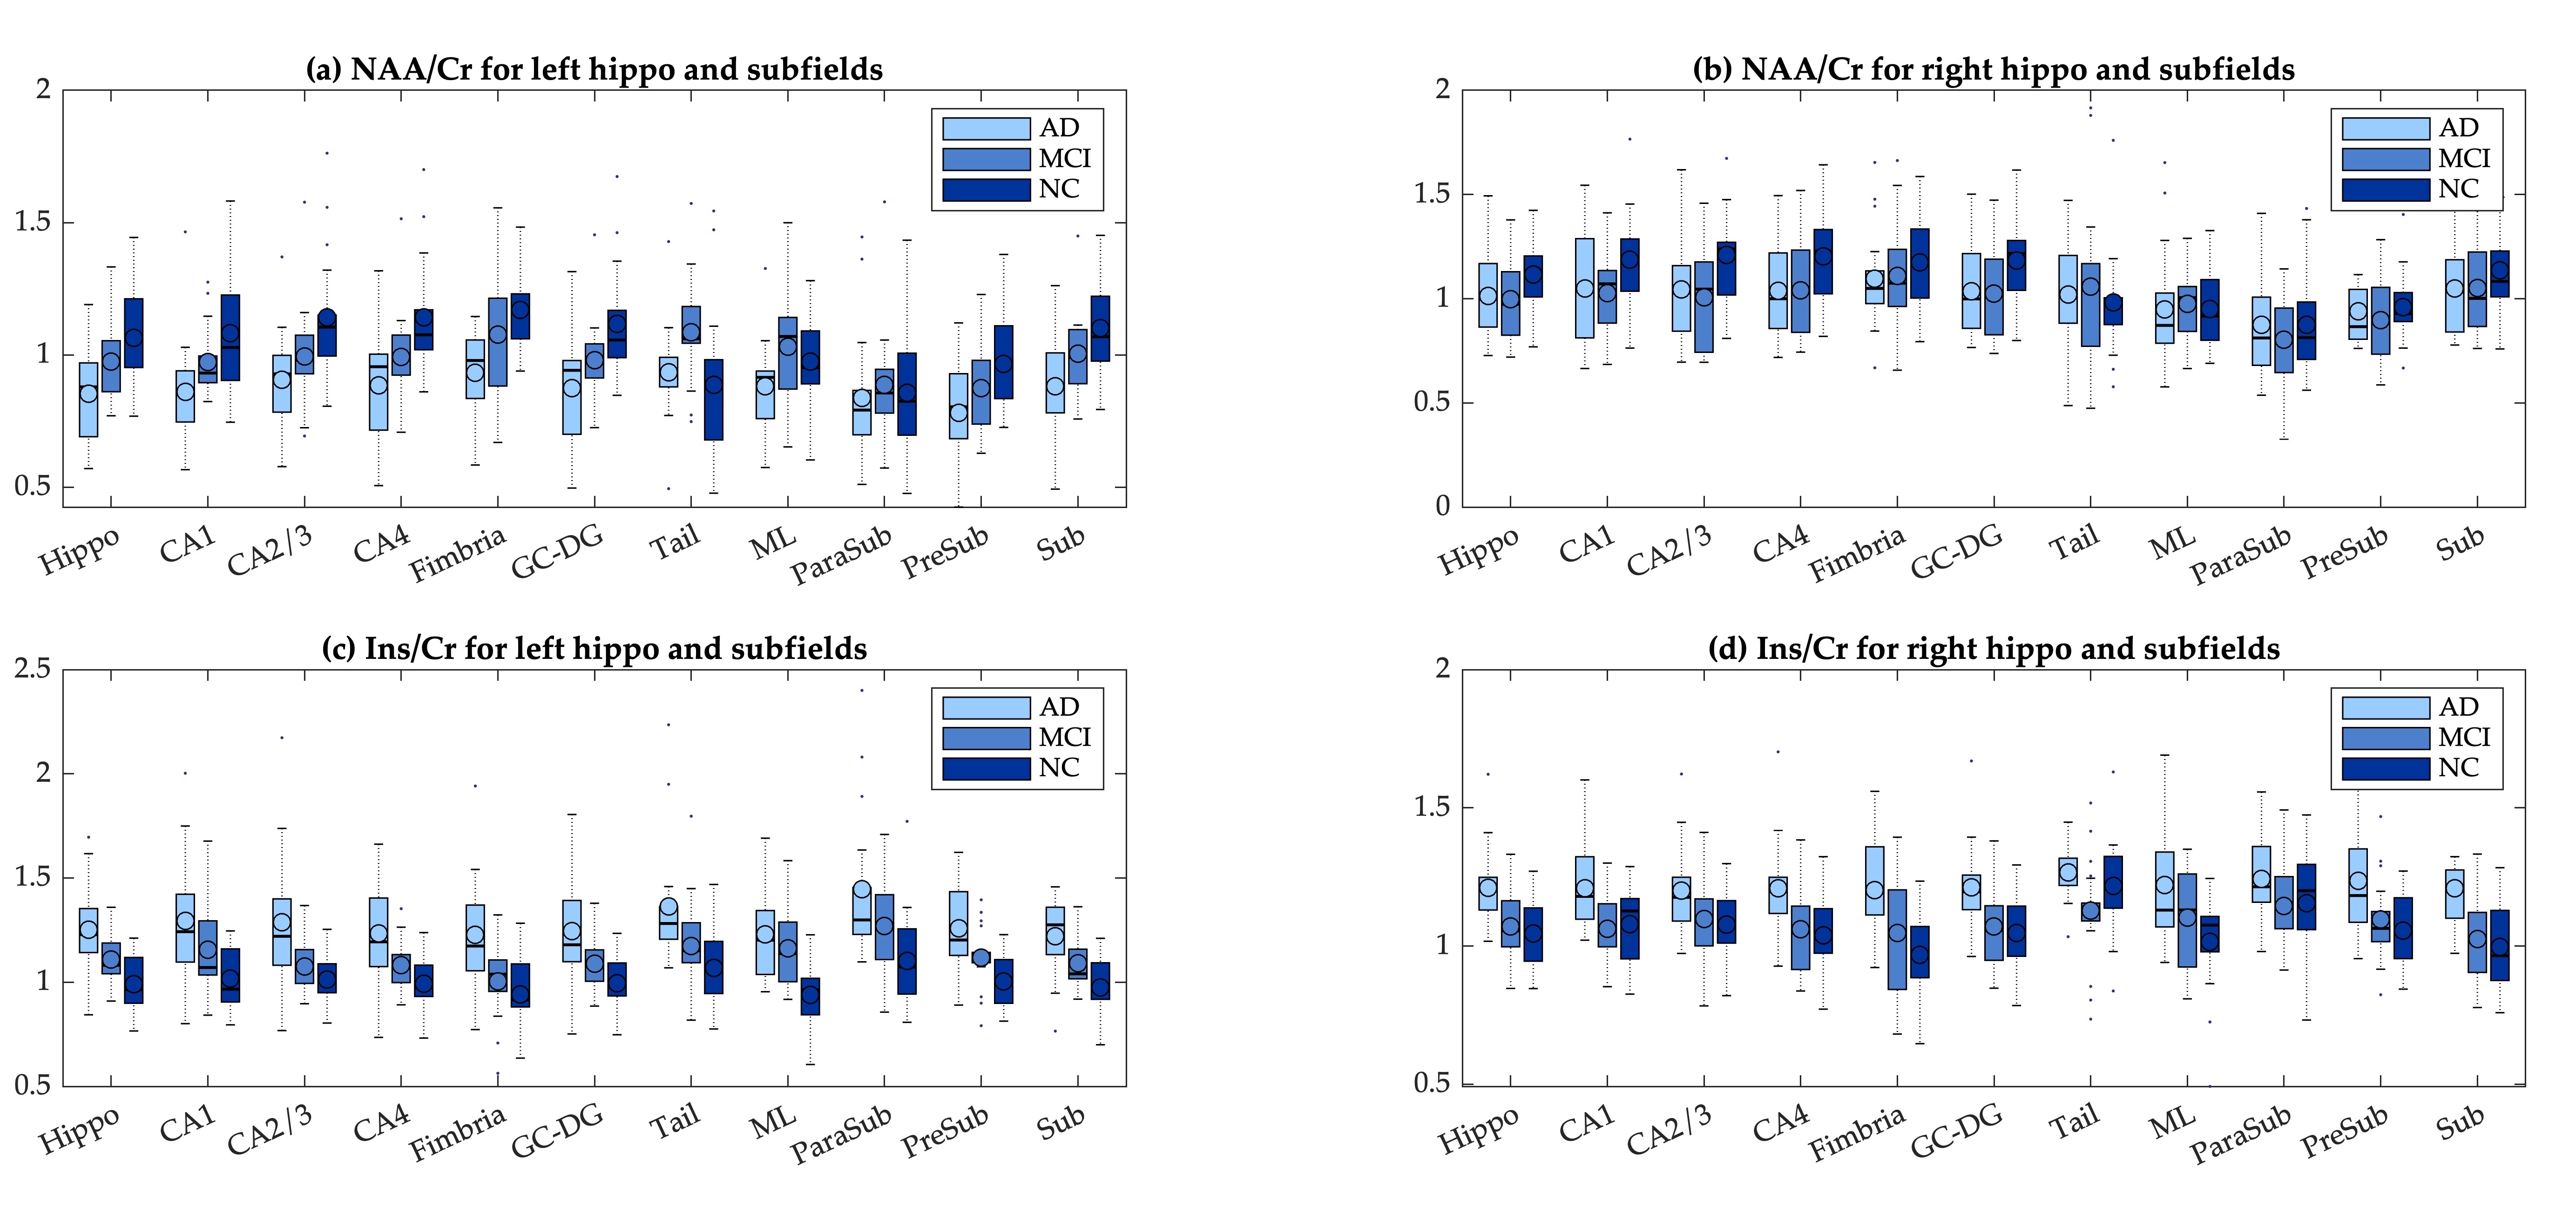
Eleven subfields through FreeSurfer were segmented from the hippocampus, where ten subfields were used to estimate metabolite ratios except for HATA dominated by water signals. ANCOVA shows the decreased NAA/Cr, an index of neuronal integrity, appeared in the left hippocampus from NC to AD via MCI in hippocampal subfields, with 3 exceptions including the tail, molecular layers and parasubiculum. The right hippocampus generally followed the same trend, with 4 exceptions including the tail, molecular layer, presubiculum and subiculum. ANCOVA also shows NAA/Cr performs well in distinguishing MCI and NC, where 3 left and 2 right subfields perform more significant than the whole hippocampus (L and R p=0.01), including left CA2/3 (p=0.007), CA4 (p=0.004), GC-DG (p=0.005) and right CA2/3 (p=0.006), GC-DG (p=0.009). Ins/Cr performs well in distinguishing AD and MCI, where 2 left and 2 right subfields perform more significant than the whole hippocampus (L p=0.003, R p=0.004), including left CA2/3 (p=0.002), fimbria (p=0.002) and right presubiculum (p=0.003), subiculum (p=0.002).
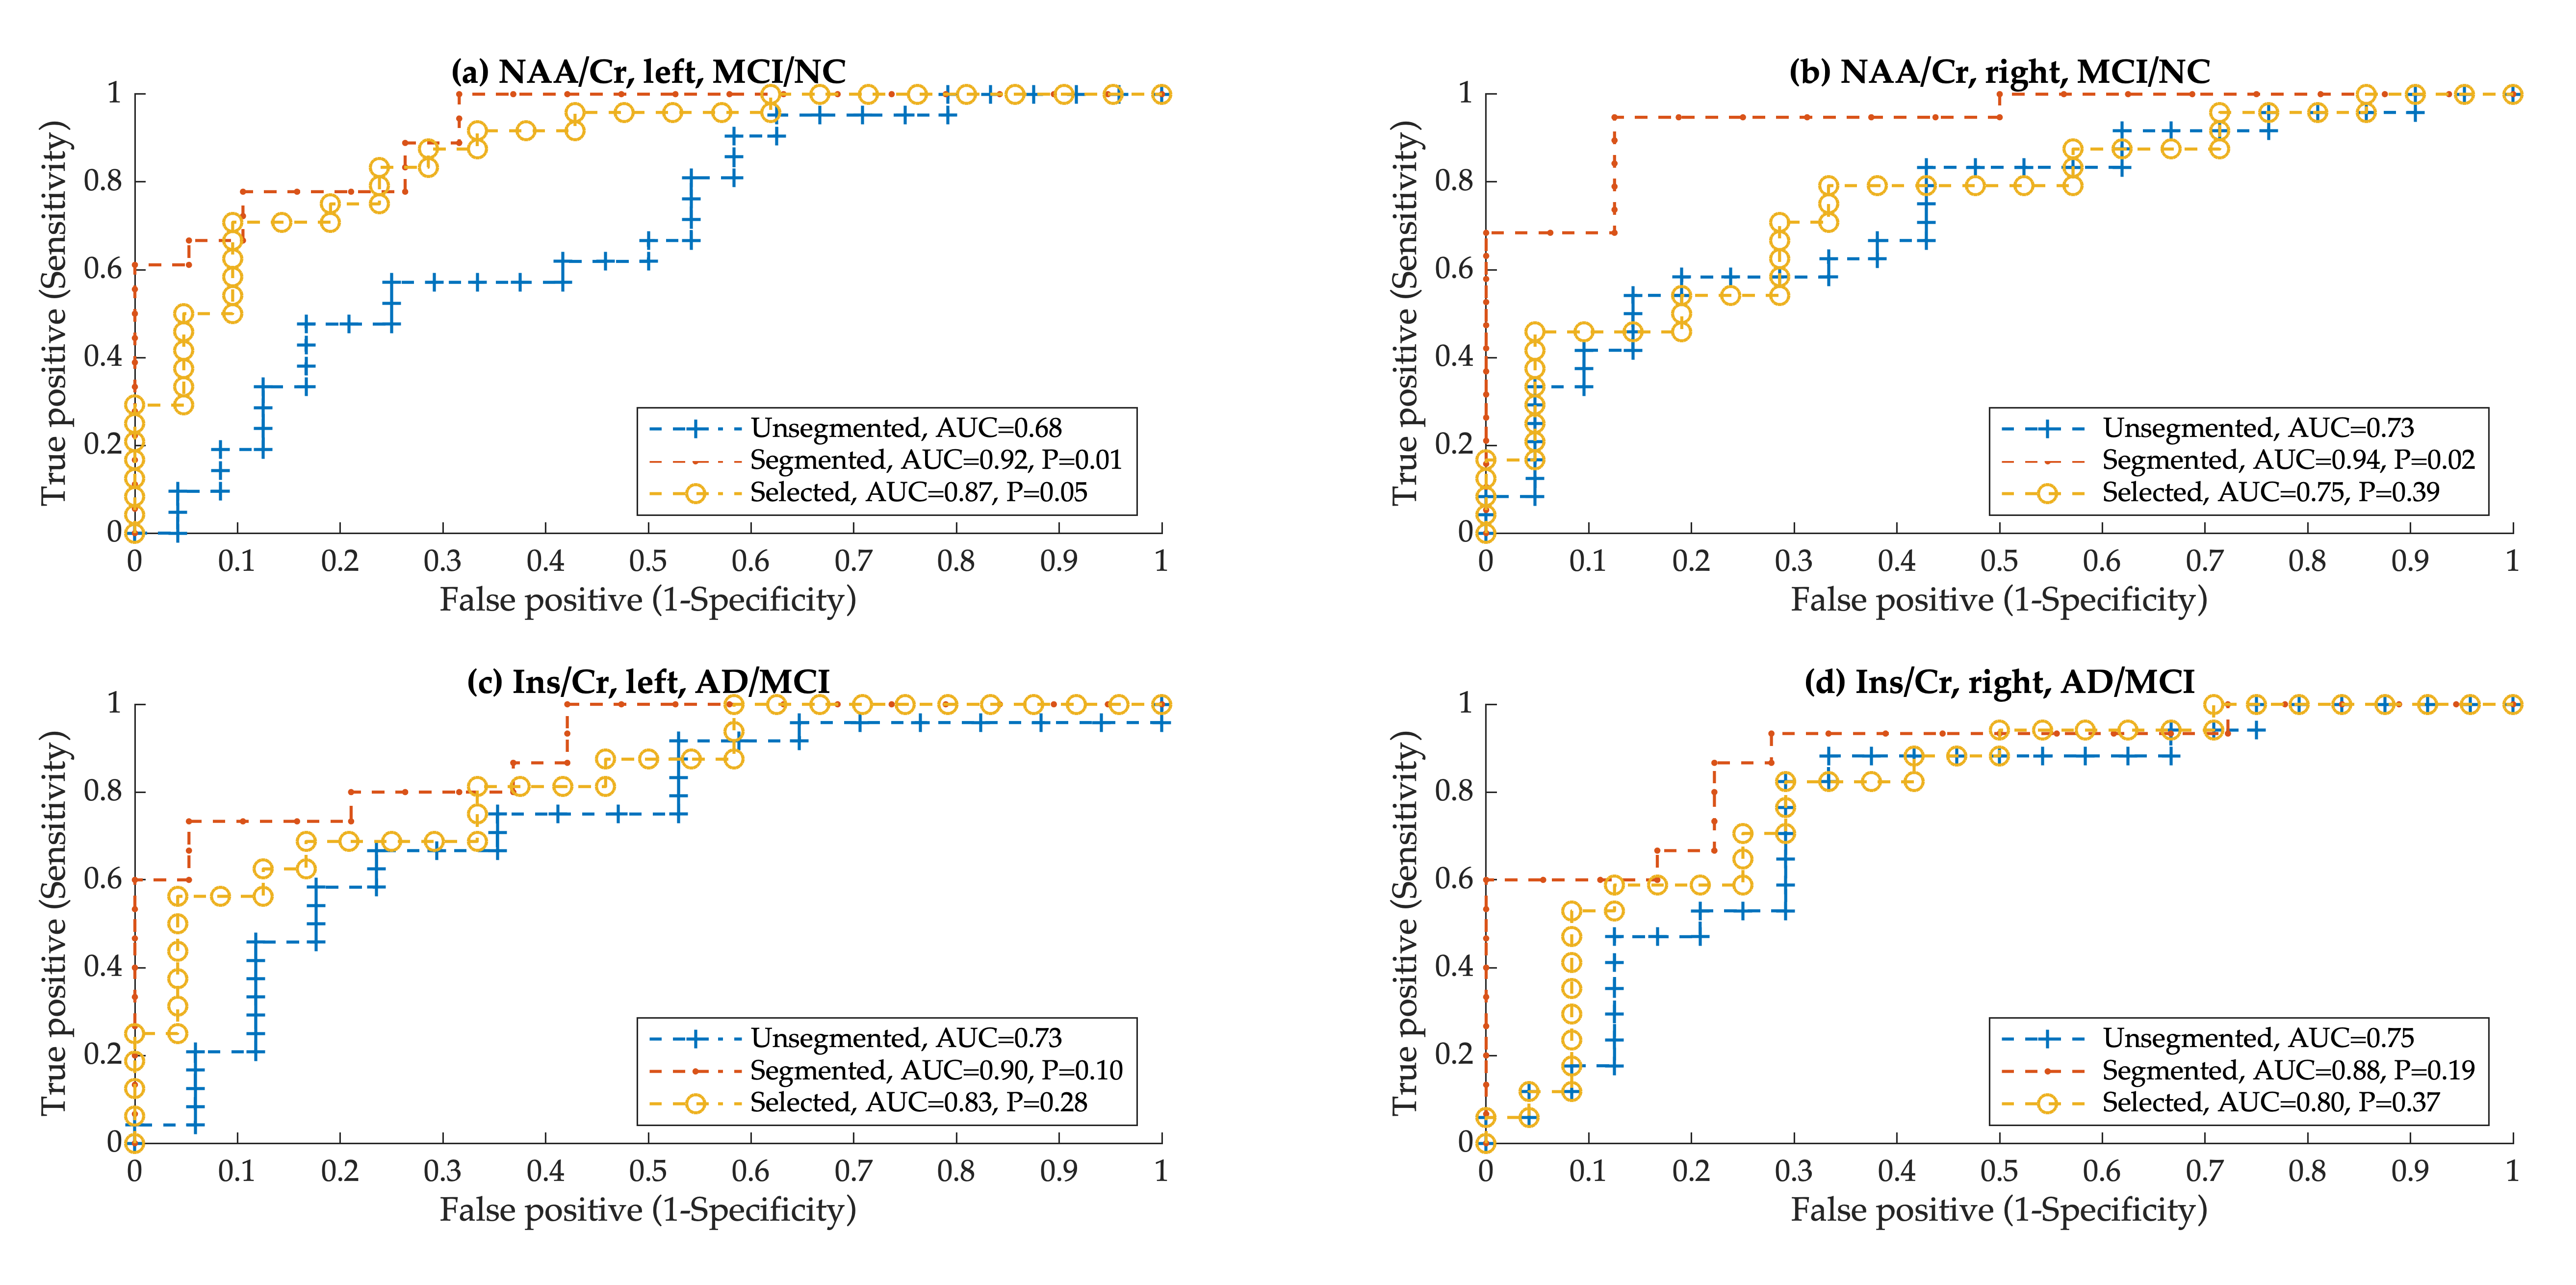
Metabolite ratios of the subfield level also achieved a better diagnostic power compared to that of the whole level. Compared to the whole level (L AUC=0.68, R AUC=0.73), the combination of all segmented (L AUC=0.92, P=0.01, R AUC=0.94, P=0.02) and selected (L AUC=0.87, P=0.05) subfields both got significant better diagnostic power through NAA/Cr in distinguishing MCI and NC groups. At the same time, the diagnostic power of Ins/Cr of the subfield level shows better diagnostic power than of the whole level, for both all (L AUC=0.90, P=0.10, R AUC=0.88, P=0.19) and selected (L AUC=0.83, P=0.28, R AUC=0.80, P=0.37) subfields. The advantages are also reflected by the ROC curve shown in Figure 2.
Discussion
The study employed the measurement we proposed before and estimated the significance of hippocampal metabolite ratios in the subfield level. The result indicated that NAA/Cr and Ins/Cr in the subfield level may be sensitive predictors of AD progress in different stages than that in the whole level, respectively, which were rarely reported in previous researches. There are still some limitations in our study. The presence of so-called voxel bleed in the multi-voxel MRSI may affect the accuracy of metabolite concentration estimating. The alteration of metabolite ratios was estimated from different participants, because the follow-up that we have done does not meet the sample size required in the study.Acknowledgements
No acknowledgement found.References
- West MJ, Kawas CH, Stewart WF, Rudow GL, Troncoso JC. Hippocampal neurons in pre-clinical Alzheimer's disease. Neurobiol Aging. 2004;25(9):1205-12.
- Oz G, Alger JR, Barker PB, et al. Clinical proton MR spectroscopy in central nervous system disorders. Radiology. 2014;270(3):658-79.
- Graff-Radford J, Kantarci K. Magnetic resonance spectroscopy in Alzheimer's disease. Neuropsychiatr Dis Treat. 2013;9:687-96.
- Loos C, Achten E, Santens P. Proton magnetic resonance spectroscopy in Alzheimer's disease, a review. Acta Neurol Belg. 2010;110(4):291-8.
- Liao W, Wu W, Sun Y, Wan S, Xu Y, Zhang B. A pilot study on measurement of metabolites in the hippocampal subfields: based on multi-voxel 1H-MRS and segmentation from high resolution volumetric MRI. Proceedings of the 23th Scientific Meeting, International Society for Magnetic Resonance in Medicine. Toronto, Canada, 30 May - 05 June, 2015.
- Sun Y, Zhao D, …, & Zhang B. A novel automatic quantitative measurement of the metabolites in hippocampal subfields by combining 2D 1H-MRSI and 3D volumetric MRI in patients with AD. Proceedings of the 24th British Chapter of ISMRM Annual Meeting. Oxford, England, 24-26 Sep, 2018.
- Obuchowski NA. Receiver operating characteristic curves and their use in radiology. Radiology. 2003;229:3-8.
Figures