3051
Gaussian Map Descriptors for Alzheimer Detection Using T1-weighted Magnetic Resonance Imaging1Biomedical Engineering and Systems, Cairo University, Cairo, Egypt, 2Computer and Systems, Electronics Research Institute, Cairo, Egypt
Synopsis
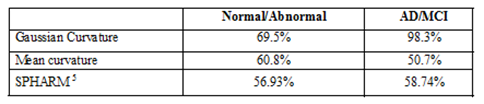
Recently, Alzheimer’s Disease (AD) is one of the most emerging elderly diseases. In this study, we propose employing Gaussian map descriptors to discriminate between AD, Mild Cognitive Impairment (MCI) and Normal subjects using T1-weighted Magnetic resonance images (MRI) downloaded from Alzheimer's disease Neuroimaging Initiative (ADNI) website. Extracted Gaussian map descriptors, calculated for the hippocampus, such as Gaussian curvature and mean curvature, were then fed to the support vector machine (SVM) for classification purposes. The Gaussian curvature outperformed mean curvature in case of normal to abnormal, and AD to MCI discrimination with accuracies of 69.5%, and 98.3% respectively.
Introduction
AD is a chronic neurogenerative, progressive disease. Due to the death of brain cells, it is associated with some behavioral changes and memory loss. There are different stages for the disease named: MCI, in which people perform their usual activities but with less efficiency, and AD, which is late progression severe stage. The Diagnosis of Ad and MCI is currently one of the most challenging tasks. The current research, that discriminate patients with AD and MCI, can be grouped into three different categories, based the image analysis perspective; named voxel-based, 1 vertex-based 2 and region of interest ROI-based. ROI approaches are based on the analysis of the volume 3 and/or shape 4,5 of the selected region. Hippocampus was used, in this study, since it plays an important roles related to long-term memory, all past knowledge and experiences, and spatial navigation. Though, It considered as the most affected part in terms of shape by the Alzheimer deterioration.6 This paper proposes employing the Gaussian map based features to discriminate between normal, MCI and AD cases through a hierarchical process where the normal to abnormal subjects discrimination was held first followed by the discrimination between AD and MCI then results will be compared to results from SPHARM technique.5 The Gaussian extracted shape features are named Gaussian curvature and mean curvature.Material and Methods
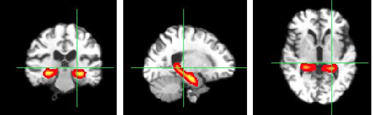
The dataset was obtained from ADNI database, formed of 165 subjects (MCI=55, AD=45, and normal=65) age ranged 55-80 years old. The dataset was acquired using 3-Tesla MRI scanner, and 3D MPRAGE T1-weighted sequence. FMRIB Software Library (FSL) was employed to extract the Hippocampus through the following steps: Brain tissue extraction, registration and segmentation of the hippocampus, as shown in Figure (1).
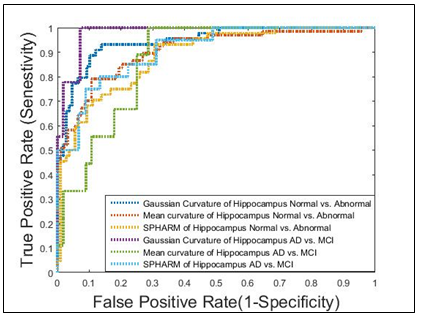
The Gauss map maps a surface in Euclidean space R3 to the unit sphere S2 while preserving its shape. Due to the uniformly sampling of points or vertices on the surface, the normal vector orientation of points is changed after rotation. Gaussian shape operator describes the shape as a matrix constructed from the normal and tangent vectors at each point on the surface of the curve to measure how the surface bends. The eigenvalues of shape operator are called the principal curvatures κ1 and κ2 which measure the maximum and minimum bending of the surface at the point p. The dot product of these principle curvature is defined as the Gaussian curvature $ K=κ1 * κ2$ . The sign of the Gaussian curvature can be used to characterize the surface depending on principal curvatures sign.7 The mean curvature is calculated as the average of the signed curvature $ H= (κ1+κ2)/2$ . Dimensionality reduction was then employed based on Fisher Score as feature selection approach. Whereas, Support Vector machine (SVM) was employed for classification purposes. Finally, Receiver Operating Characteristic (ROC) curve was anticipated to study the performance of the proposed system.
Results and Discussion
At the late stages of AD, a major erosion in the shape of the Hippocampus as well as its curvature which can be used to describe the progression of the disease.8 Though, extracting features that can characterize this change can be considered as the key solution. The Gaussian Curvature was able to outperform the features in comparison since it represents the change in the shape curvature of the region of interest, as shown in Figure (2). Olivier Colliot et al. 5 perform SPHARM technique with 75 volume, when we apply it to 165 subject the result became worse. This study accuracy reaches 98.3% with p-value significance of 0.12 which makes our system has more stability and robustness. The ROC curve for normal/abnormal classification and AD/MCI is shown in Figure (3).Conclusion
In this study, Gaussian based features were employed to discriminate the normal subjects from AD and MCI subjects based on analyzing the shape of the hippocampus. Two different features sets were extracted, named Gaussian curvature and mean curvature. The results are considered very promising when classifying the AD from MCI to reach 98.3% accuracy using the Gaussian curvature, while the performance is still challenging in case of normal to abnormal classification to reach 69.5% using the Gaussian curvature based system. Nevertheless, the combination of the proposed features need to be further investigated to boost the overall system performance.Acknowledgements
No acknowledgement found.References
1. Vemuri, P. et al. Alzheimer’ s disease diagnosis in individual subjects using structural MR images : Validation studies. 39, 1186–1197 (2008).
2. Desikan, R. S. et al. An automated labeling system for subdividing the human cerebral cortex on MRI scans into gyral based regions of interest. Neuroimage 31, 968–980 (2006).
3. Amoroso, N. et al. Alzheimer’s disease diagnosis based on the Hippocampal Unified Multi-Atlas Network (HUMAN) algorithm. Biomed. Eng. Online 17, 1–16 (2018).
4. Ben Ahmed, O. et al. Alzheimer’s disease diagnosis on structural MR images using circular harmonic functions descriptors on hippocampus and posterior cingulate cortex. Comput. Med. Imaging Graph. 44, 13–25 (2015).
5. Gerardin, E. et al. Multidimensional classification of hippocampal shape features discriminates Alzheimer’s disease and mild cognitive impairment from normal aging. Neuroimage 47, 1476–1486 (2009).
6. Wible, C. Hippocampal Physiology, Structure and Function and the Neuroscience of Schizophrenia: A Unified Account of Declarative Memory Deficits, Working Memory Deficits and Schizophrenic Symptoms. Behav. Sci. (Basel). 3, 298–315 (2013).
7. O’Neill, B. Chapter 9 Calculus on Euclidean Space. Elem. Differ. Geom. 3–42 (2006). doi:10.1016/B978-0-12-088735-4.50005-5
8. Boutet, C. et al. Detection of volume loss in hippocampal layers in Alzheimer’s disease using 7 T MRI: A feasibility study. NeuroImage Clin. 5, 341–348 (2014).
Figures