3049
Novel diagnosis index for Alzheimer's disease based on a hybrid sequence of QSM and VBM1Research and Development Group, Hitachi, Ltd., Tokyo, Japan, 2Department of Diagnostic and Interventional Radiology, Hokkaido University Hospital, Hokkaido, Japan, 3Healthcare Business Unit, Hitachi, Ltd., Tokyo, Japan, 4Department of Psychiatry, Hokkaido University Graduate School of Medicine, Hokkaido, Japan, 5Department of Neurology, Faculty of Medicine and Graduate School of Medicine, Hokkaido University, Hokkaido, Japan, 6Department of Radiology, Hokkaido University Graduate School of Medicine, Hokkaido, Japan
Synopsis
Voxel-based morphometry (VBM) is widely used to diagnose Alzheimer’s disease (AD). Recently, several studies have showed that quantitative susceptibility mapping (QSM) is also useful for detecting iron deposition in the early stages of AD. In this study, we propose a novel diagnosis index for AD based on both QSM and VBM, which are simultaneously executed by a single scan. The diagnostic performance of the proposed index in regard to AD and MCI patients is compared with that of the conventional VBM-based index. The comparison results show that the proposed index improved diagnostic performance for discriminating MCI patients and control groups.
Introduction
Voxel based morphometry (VBM) is widely used to study and diagnose Alzheimer’s disease (AD). However, improvement is needed for accurate diagnosis in the early stages of AD, such as mild-cognitive-impairment (MCI) or preclinical stages. Recently, several studies have shown that quantitative susceptibility mapping (QSM) is useful for detecting iron deposition in these early stages.1 In a previous study, targeting early diagnosis of AD, we proposed a hybrid sequence and analysis method of QSM and VBM.2 In this study, we propose a diagnosis index for AD based on both QSM and VBM, and we compare the diagnostic performance of the proposed index in regard to AD and MCI patients with that of conventional VBM-based index.Methods
Acquisition (hybrid sequence) and pre-processing
Fifteen patients with AD, 20 patients with MCI, and 47 volunteers with cognitively normal (NC) status were recruited. AD and MCI were diagnosed by using DSM-5. MRI images were acquired with a hybrid sequence for obtaining both structural T1-weigted and susceptibility images for the proposed index and with an IR-based 3D T1-weighted sequence for the conventional index. The hybrid sequence was implemented by a 3D gradient-echo sequence with multiple echoes to simultaneously obtain T1-weighted (TE: 4.3ms) and T2*-weighted (TE: 30.8ms) images (Table 1).2 Intermediate flip angle (45 deg.) was used for T1 contrasts (instead of Ernst angle). The magnitude image of the first echo was segmented to obtain a grey-matter (GM) image, and phase images of all echoes were reconstructed to generate a QSM image.3 The GM and QSM images were spatially normalized into Montreal Neurological Institute (MNI) space by using the DARTEL algorithm.4 This research was approved by the ethics committee of Hitachi group headquarters.
Proposed algorithm
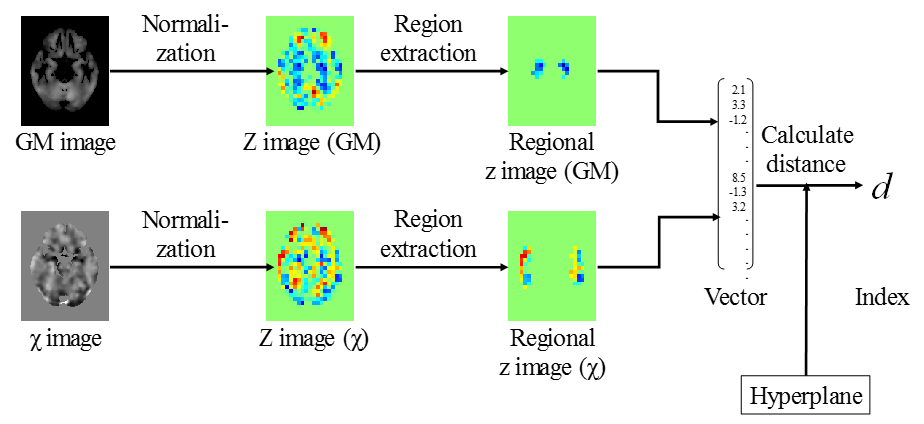
The proposed algorithm, shown in Fig. 1, calculates the diagnosis index (a scalar value) from GM and QSM images in MNI space. It consists of the following three steps. First, each pixel value in the GM and QSM images is normalized to a z-value with corrected age dependency.5 By normalizing to z-score, the volume and susceptibility values are translated to dimensionless quantities. Second, regions of interest in the GM and QSM images are extracted respectively by using an anatomical atlas. By extracting the regions pathologically relevant to AD, diagnostic accuracy is improved. Lastly, all voxel values in the extracted regions of the GM and QSM images are combined into a feature vector, and diagnostic value d is then calculated as the distance between the feature vector and a discriminative hyperplane of the AD and NC groups. The hyperplane is pre-calculated from training data by using a linear support vector machine. Each index d is calculated in a leave-one-out manner.
Evaluation
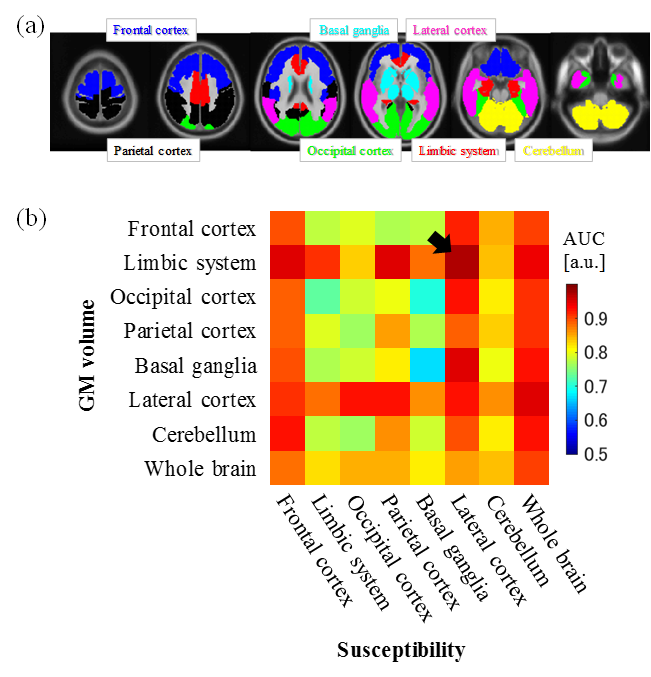
The regions of interest were optimized so that suitable regions in each image could be extracted, and diagnostic performances of the optimized proposed and the conventional methods were then compared. The regions of interest were selected from eight regions defined by an automated anatomical atlas (AAL),6 namely, frontal cortex, limbic system, occipital cortex, parietal cortex, basal ganglia, lateral cortex, cerebellum (Fig. 2a), and whole brain (sum of all regions). The conventional method was implemented by utilizing the “voxel-based specific regional analysis system for Alzheimer's diseases (VSRAD) advance 2” (Eisai Co, Ltd., Tokyo, Japan), which is MRI software for calculating z-scores of grey-matter volumes in a medial temporal lobe7 obtained by the IR-based sequence. The diagnostic performances were evaluated on the basis of the area under the ROC curve (AUC) for discriminating AD, MCI and NC groups.
Results and discussion
AUC values for discriminating AD and NC groups obtained by combined usage of GM volume and susceptibility in each ROI are shown in Fig. 2. As shown in Fig. 2b, the limbic system and lateral cortex are suitable regions for the GM image, and that result is consistent with the previous study.7 On the other hand, frontal and lateral cortices are suitable for the QSM image. As shown in arrow in Fig. 2b, AUC is the highest (0.97) when the limbic system and lateral cortex are selected as ROIs for GM and QSM images, respectively.
Box plots, ROC curves, and AUC values obtained with the conventional and proposed methods are compared in Fig. 3. Using the optimized proposed method improved diagnostic accuracy in all comparisons (AD-NC, MCI-NC, and AD-MCI). Especially, AUC for the proposed method is substantially improved in the case of comparison of MCI vs NC (Fig. 3c). These results suggest that the proposed method based on the hybrid sequence of VBM and QSM improved diagnostic performance in the early stages of Alzheimer's disease.
Acknowledgements
This research was supported by AMED under Grant Number JP18he1402002.References
1. Kim HG, et al. Quantitative susceptibility mapping to evaluate the early stage of Alzheimer's disease. NeuroImage Clinical 2017;16:429.
2. Sato R, et al. Hybrid sequence and analysis of T1-weigthed imaging and quantitative susceptibility mapping for early diagnosis of Alzheimer's diseases. Proc of AAIC 2018; Chicago, Illinois, United States.
3. Shirai T, et al. Whole Brain Background Field Removal using Spherical Mean Value Filtering and Local Polynomial Approximation for Quantitative Susceptibility Mapping. Proc of ISMRM 2018; Paris, France.
4. Ashburner J. A fast diffeomorphic image registration algorithm. NeuroImage 2007;38(1):95.
5. Collij LE, et al. Application of Machine Learning to Arterial Spin Labeling in Mild Cognitive Impairment and Alzheimer Disease. Radiology 2016;281(3):865.
6. Tzourio-Mazoyer N, et al. Automated anatomical labeling of activations in SPM using a macroscopic anatomical parcellation of the MNI MRI single-subject brain. NeuroImage 2002;15(1):273.
7. Matsuda H, et al. Automatic voxel-based morphometry of structural MRI by SPM8 plus diffeomorphic anatomic registration through exponentiated lie algebra improves the diagnosis of probable Alzheimer Disease. American Journal of Neuroradiology 2012;33(6):1109.
Figures