3047
In vivo manganese-enhanced MRI of amyloid pathology in the 5xFAD mouse model of Alzheimer’s disease1Department of Neuroimaging, King's College London, London, United Kingdom, 2The University of Exeter Medical School, Exeter, United Kingdom, 3Department of Old Age Psychiatry, King's College London, London, United Kingdom
Synopsis
Amyloid plaques are a hallmark of Alzheimer’s disease (AD) but are difficult to detect in vivo due to their small size. We investigated the utility of manganese-enhanced MRI (MEMRI) for visualizing plaques in the 5xFAD mouse model of AD. Plaque-like hypointensities were present in 3D gradient-echo images in all transgenic mice (n=4) but not wild type littermates (n=4). MP2RAGE T1-mapping (n=2/2) revealed reduced manganese uptake in 5xFAD brains, suggesting neurodegeneration. These results demonstrate the potential for MEMRI to provide biomarkers of AD-related neuropathologies that can be useful for monitoring disease progression and therapeutic response in animal models of AD.
Introduction
Senile plaques – extracellular deposits of beta-amyloid (Aβ) – are one of the main neuropathological hallmarks of Alzheimer’s disease (AD). Non-invasive methods of detecting plaques are needed to provide biomarkers of AD and therapeutic efficacy, but this is challenging due to their small size.
Previous preclinical studies on in vivo imaging of AD plaques involved long scan times1 or administration of gadolinium-based contrast agents, which requires stereotactic surgery for intra-cerebro-ventricular injection2 or the use of ultrasound and microbubbles to transiently open the blood-brain barrier3. Gadolinium enables high-resolution imaging at reduced scan times, but complex procedures are required to deliver it to the brain parenchyma.
In this study, we investigated the feasibility of using manganese as an alternative contrast agent to aid the visualization of plaques in the well-characterized 5xFAD transgenic mouse model of AD, which develops Aβ deposits and other AD-related pathologies from as early as two months of age4. While manganese has a lower relaxivity than gadolinium, it readily crosses the blood-brain barrier and, as a calcium analog, is taken up by neurons. Thus, manganese-enhanced MRI (MEMRI) also allowed us to probe AD-related disruption of neuronal activity.
Methods
5xFAD mice (6-7 months old, n=4) and age-matched wild types (WT, n=4) were given four daily subcutaneous injections of MnCl2 (cumulative dose 0.6 mmol/kg). One day after the final injection, the mice were scanned in vivo on a Bruker BioSpec 94/20.
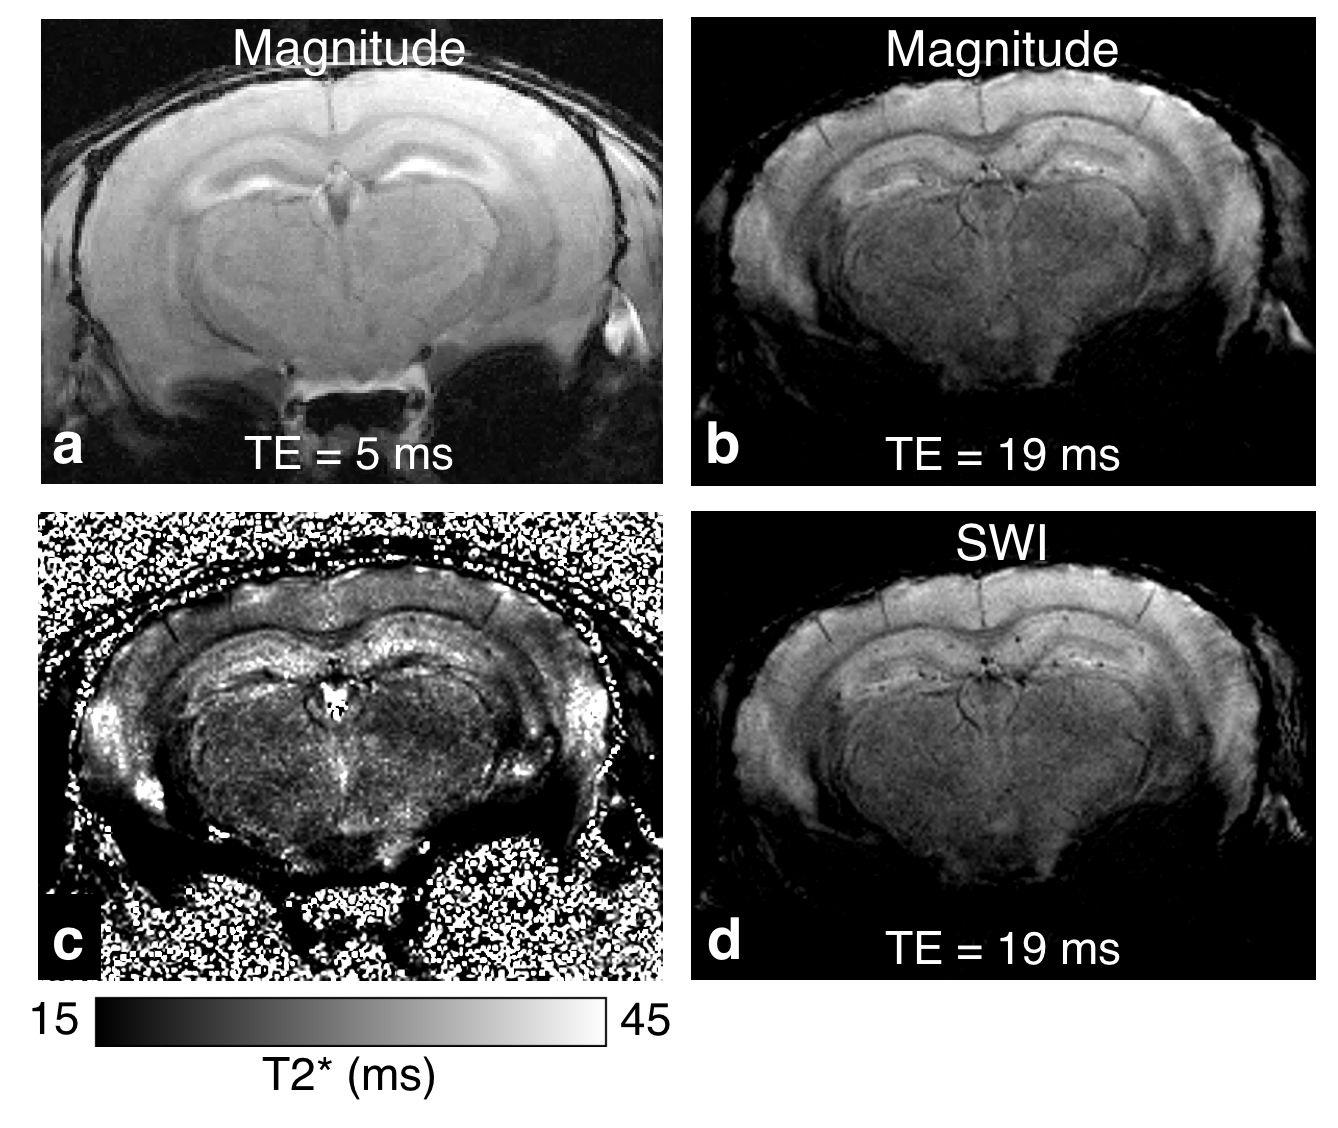
For all mice, 3D multi-gradient echo (MGE) images were acquired for plaque visualization (TE = 5, 12, 19, 26 ms; TR = 250 ms; FA = 50°; BW = 40 kHz; matrix = 200×150×20; FOV = 12×9×4.8 mm; 4 averages; scan time = 60 min). For a subset of mice (n=2 per group), MP2RAGE images were also acquired for T1 mapping (TI = 700, 3500 ms; segment TR = 7000 ms; TE/TR = 2.5/7 ms; FA = 7°/7°; BW = 40 kHz; matrix = 108×108×64; FOV = 16.2×16.2×9.6 mm; 4 averages; scan time = 33 min).
Magnitude and susceptibility weighted images (SWI) were reconstructed and T2* maps computed from the MGE images. T1 maps were computed from the MP2RAGE images, co-registered, and normalized to the mean T1 in a manually defined ROI in the temporalis muscle.
Following MRI, the mice were transcardially perfused with 4% paraformaldehyde, and their brains processed with Congo red histological staining, which labels amyloid in plaques.
Results
At longer echo times, hypointense spots were visible in the brains of the 5xFAD mice (Figure 1). Qualitatively, these hypointensities were less apparent in the T2* maps (Figure 1c) and more apparent in the SWI (Figure 1d).
Figure 2 shows the SWI at TE = 19 ms of every mouse. Hypointense spots were present in all 5xFAD mice (bottom row), predominantly in the hippocampus (arrows), with a few visible in the cortex (arrow heads). The spots in the MRI coincided with Congo red-positive structures in the histological sections (Figure 3). Similar spots were not visible in the WT mice (Figure 2, top row).
Figure 4a and b show the T1 maps of one WT and one 5xFAD mouse. The mean normalized T1 (T1norm) in the hippocampus was greater in the 5xFAD mice compared to WT (Figure 4c). The manually drawn hippocampus and temporalis ROIs are shown in Figure 4d. On a voxel-wise level, T1norm was greater in the 5xFAD mice in most areas of the brain (Figure 4e).
Discussion
MEMRI with a 3D MGE acquisition is a relatively simple and time-efficient method for in vivo detection of AD plaques. Plaques are only visible at later echo times, indicating a difference in susceptibility and T2* compared to the surrounding tissue. Variations in iron load of plaques in different parts of the brain may explain why the majority of MR-visible plaques were found in the hippocampus despite the presence of cortical and thalamic plaques. However, other factors such as size and compactness can influence MR visibility of plaques independent of iron load2,5. Further histological investigation is ongoing to elucidate this matter.
While the group sizes are too small for statistical inference, the greater T1norm in the 5xFAD mice suggests reduced manganese uptake in the brains of these transgenic mice. This could point to impaired neuronal activity and/or neuron loss associated with Aβ aggregation4.
Conclusion
We successfully used MEMRI to detect plaques and AD-related changes in neuronal activity. This confirms that MEMRI can provide potential biomarkers for longitudinal monitoring of disease progression and therapeutic response in animal models of AD.Acknowledgements
No acknowledgement found.References
- Jack CR Jr, Garwood M, Wengenack TM, et al. In vivo visualization of Alzheimer's amyloid plaques by magnetic resonance imaging in transgenic mice without a contrast agent. Magn Reson Med. 2004;52(6):1263-71.
- Petiet A, Santin M, Bertrand A, et al. Gadolinium-staining reveals amyloid plaques in the brain of Alzheimer’s transgenic mice. Neurobiol Aging. 2012;33(8):1533-44.
- Santin MD, Debeir T, Bridal SL, et al. Fast in vivo imaging of amyloid plaques using μ-MRI Gd-staining combined with ultrasound-induced blood-brain barrier opening. Neuroimage. 2013;79:288-94.
- Oakley H, Cole SL, Logan S, et al. Intraneuronal beta-amyloid aggregates, neurodegeneration, and neuron loss in transgenic mice with five familial Alzheimer’s disease mutations: potential factors in amyloid plaque formation. J Neurosci. 2006;26(40):10129-40.
- Dudeffant C, Vandesquille M, Herbert K, et al. Contrast-enhanced MR microscopy of amyloid plaques in five mouse models of amyloidosis and in human Alzheimer’s disease brains. Sci Rep. 2017;7(1):4955.
Figures