3042
Spatio-temporal alterations in functional connectivity in a rat model of brain glucose metabolism disruption and sporadic Alzheimer’s disease1CIBM, Ecole Polytechnique Fédérale de Lausanne, Lausanne, Switzerland, 2Faculdade de Ciências da Universidade de Lisboa, Lisbon, Portugal
Synopsis
Impaired brain glucose consumption is a possible trigger of Alzheimer’s disease (AD). Animal models can help characterize each contributor to the cascade independently. Here we perform a first-time longitudinal study of brain connectivity in the intracerebroventricular-streptozotocin rat model of AD. We report altered brain circuitry as early as two weeks in regions notoriously affected by AD (cingulate cortices, posterior parietal cortex and hippocampus), and widespread gradual breakdown of connectivity with time. The changes in brain connectivity induced by glucose metabolism disruption can bring further insight into the role of this mechanism in AD.
Introduction
Functional MRI (fMRI) studies of amnestic mild cognitive impairment and Alzheimer’s disease (AD) have revealed decreased resting-state activity of the default mode network which correlates strongly with clinical disease severity and progression1,2.
However, the mechanism that triggers AD is not well-established, with amyloid plaques, neurofibrillary tangles of tau, microgliosis and glucose hypometabolism all likely involved in the cascade. One main advantage of animal models is the possibility to tease out the impact of each of these insults on brain connectivity.
Following an intracerebroventricular (icv) injection of streptozotocin (STZ), rats and monkeys develop impaired brain glucose metabolism (i.e. “diabetes of the brain”). Numerous studies have reported AD-like features in icv-STZ animals3-5, but this model has never been characterized in terms of MRI-derived biomarkers beyond structural brain atrophy4.
Here, we report the longitudinal evolution of functional connectivity in icv-STZ rats compared to controls using resting-state fMRI.
Methods
All experiments were approved by the local Service for Veterinary Affairs. Male Wistar rats (N=9) (236±11 g) underwent a bilateral icv-injection of either streptozotocin (3 mg/kg, STZ group, N=5) or buffer (control group, N=4). Rats were scanned at four timepoints following surgery (Fig. 1), on a 14T Varian system. Briefly, rats were anesthetized using isoflurane for initial setup and promptly switched to medetomidine sedation (bolus: 0.1mg/kg, perfusion: 0.1mg/kg/h), which preserves neural activity and vascular response better than isoflurane. Resting-state fMRI data were acquired using a two-shot gradient-echo EPI sequence as follows: TE/TR=10/800ms; Matrix: 64x64; FOV: 23x23mm2; 8 1.12-mm slices; 370 repetitions (TA=10’). Two or three runs were acquired on each rat.
Data pre-processing included denoising6, distortion correction7, slice-timing correction and spatial smoothing8 (Gaussian kernel: 0.36x0.36x1 mm3). Independent component analysis (ICA) was performed on each individual fMRI run9 with high-pass temporal filtering (f > 0.01Hz) and 40 independent components (IC’s). Artefactual IC’s were manually identified and cleaned from the data10.
In parallel, fMRI images were registered to a rat brain atlas7 and 28 atlas-defined ROIs were automatically segmented. “Cleaned” fMRI data were used to compute individual functional connectivity (fc) matrices between these 28 ROIs, using global signal regression, which were further Fisher z-transformed (Fig. 2).
Mean fc matrices for each group and timepoint were calculated. Two-tailed t-test was used to assess between-group fc differences at each timepoint, while longitudinal changes were assessed separately for each group using one-way ANOVA.
Results
Figure 3 shows an example of anatomical images, matching fMRI images, and atlas-based anatomical labels registered into fMRI space.
Mean fc matrices at each timepoint revealed slightly reduced fc connectivity in the STZ group at 2 weeks (weaker positive and negative correlations), and partial recovery at 6 weeks prior to more significant and widespread changes from 13 weeks on (Fig. 3). ANOVA confirmed stable fc in the control group over the 2 – 27 week time range, contrasting with widespread and significant temporal changes in the STZ group (Fig. 4).
Discussion and Conclusions
This is the first study to characterize longitudinal fc changes caused by brain glucose metabolism disruption in the icv-STZ model. Group comparisons revealed most prominent differences in the posterior parietal cortex (PPC) and anterior cingulate at 2 weeks, retrosplenial cortex at 6 weeks, and PPC, hippocampus and subiculum at 13 weeks, which are all regions typically involved in AD. The reproducibility of fc matrices in the CTL group over time gives increased confidence in the detection of dramatic fc changes in the STZ group.
Our results are consistent with previous studies of the icv-STZ rat model using histopathology, namely with structural thinning of the PPC after one month, atrophy of the hippocampus at 6 weeks5 and intra-cellular accumulation of amyloid in the PPC and hippocampus after 3 months3. Finally, we report non-monotonic changes in fc, with partial recovery around 6 weeks, consistent with previously-established trends for structural thickness and memory performance3.
Future work will focus on acquiring a larger dataset, especially at the later timepoints. We will also characterize gray and white matter structural degeneration using diffusion MRI and correlate it to changes in fc.
Finally, the icv-STZ model displays functional changes reminiscent of AD, while the degeneration is induced primarily by impaired brain glucose metabolism. It therefore constitutes an excellent model of sporadic AD and should allow to further explore the hypothesis of AD being “type-3 diabetes”.
Acknowledgements
The authors thank Mario Lepore and Stefan Mitrea for assistance with animal setup and monitoring. This work was supported by the Centre d'Imagerie Bio-Médicale (CIBM) of the University of Lausanne (UNIL), the Swiss Federal Institute of Technology Lausanne (EPFL), the University of Geneva (UniGe), the Centre Hospitalier Universitaire Vaudois (CHUV) and the Hôpitaux Universitaires de Genève (HUG), the Swiss-European Mobility Plan (Movetia) and the Leenaards and the Jeantet FoundationsReferences
1. Binnewijzend, M.A., Schoonheim, M.M., Sanz-Arigita, E., Wink, A.M., van der Flier, W.M., Tolboom, N., Adriaanse, S.M., Damoiseaux, J.S., Scheltens, P., van Berckel, B.N., Barkhof, F., 2012. Resting-state fMRI changes in Alzheimer's disease and mild cognitive impairment. Neurobiol Aging 33, 2018-2028.
2. Greicius, M.D., Srivastava, G., Reiss, A.L., Menon, V., 2004. Default-mode network activity distinguishes Alzheimer's disease from healthy aging: evidence from functional MRI. Proc Natl Acad Sci U S A 101, 4637-4642.
3. Knezovic, A., Osmanovic-Barilar, J., Curlin, M., Hof, P.R., Simic, G., Riederer, P., Salkovic-Petrisic, M., 2015. Staging of cognitive deficits and neuropathological and ultrastructural changes in streptozotocin-induced rat model of Alzheimer's disease. J Neural Transm (Vienna) 122, 577-592.
4. Kraska, A., Santin, M.D., Dorieux, O., Joseph-Mathurin, N., Bourrin, E., Petit, F., Jan, C., Chaigneau, M., Hantraye, P., Lestage, P., Dhenain, M., 2012. In vivo cross-sectional characterization of cerebral alterations induced by intracerebroventricular administration of streptozotocin. PLoS One 7, e46196.
5. Shoham, S., Bejar, C., Kovalev, E., Weinstock, M., 2003. Intracerebroventricular injection of streptozotocin causes neurotoxicity to myelin that contributes to spatial memory deficits in rats. Exp Neurol 184, 1043-1052.
6. Veraart, J., Novikov, D.S., Christiaens, D., Ades-Aron, B., Sijbers, J., Fieremans, E., 2016. Denoising of diffusion MRI using random matrix theory. Neuroimage 142, 394-406.
7. Smith, S.M., Jenkinson, M., Woolrich, M.W., Beckmann, C.F., Behrens, T.E., Johansen-Berg, H., Bannister, P.R., De Luca, M., Drobnjak, I., Flitney, D.E., Niazy, R.K., Saunders, J., Vickers, J., Zhang, Y., De Stefano, N., Brady, J.M., Matthews, P.M., 2004. Advances in functional and structural MR image analysis and implementation as FSL. Neuroimage 23 Suppl 1, S208-219.
8. Friston, K.J., Penny, W., Ashburner, J., Kiebel, S., Nichols, T.E., 2007. Statistical Parametric Mapping. Elsevier.
9. Beckmann, C.F., Smith, S.M., 2004. Probabilistic independent component analysis for functional magnetic resonance imaging. IEEE Trans Med Imaging 23, 137-152.
10. Griffanti, L., Douaud, G., Bijsterbosch, J., Evangelisti, S., Alfaro-Almagro, F., Glasser, M.F., Duff, E.P., Fitzgibbon, S., Westphal, R., Carone, D., Beckmann, C.F., Smith, S.M., 2017. Hand classification of fMRI ICA noise components. Neuroimage 154, 188-205.
Figures
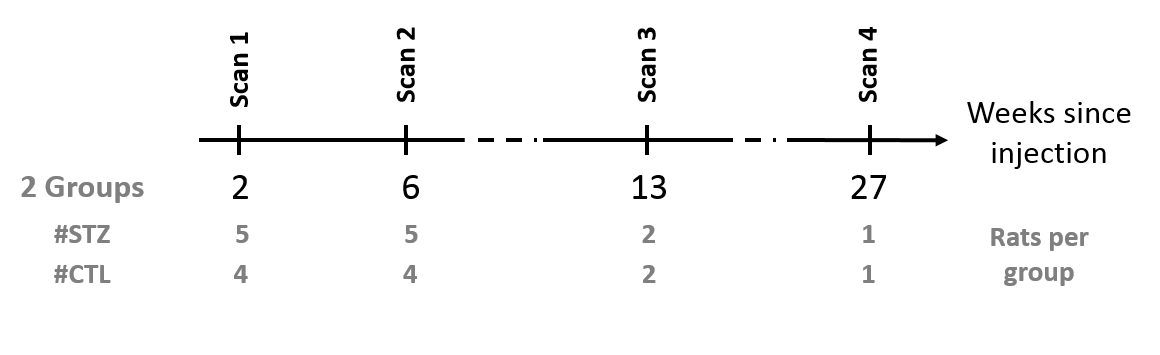
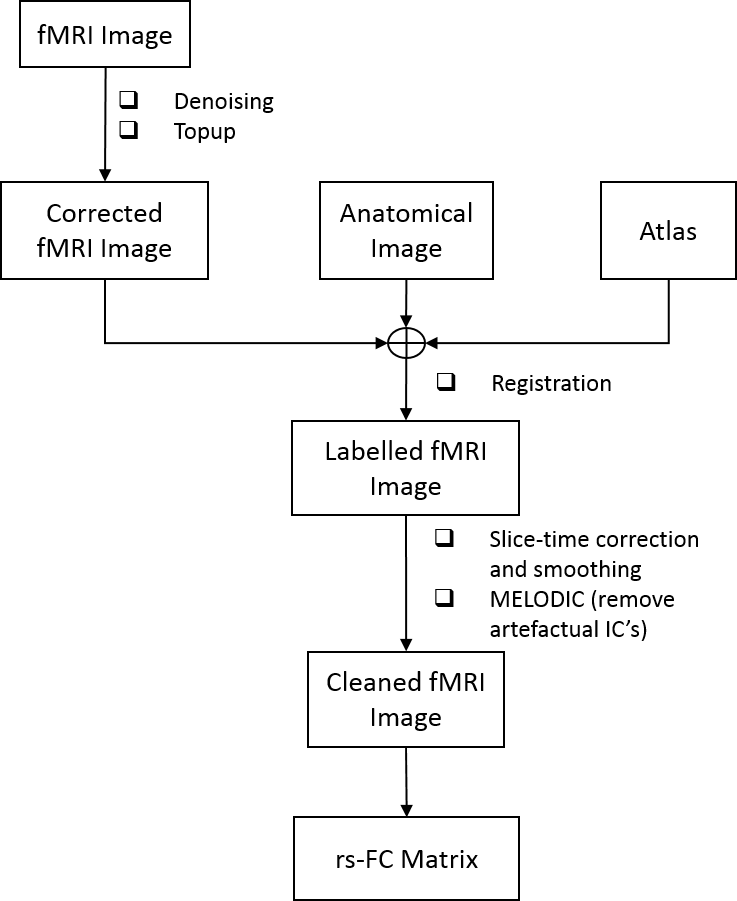
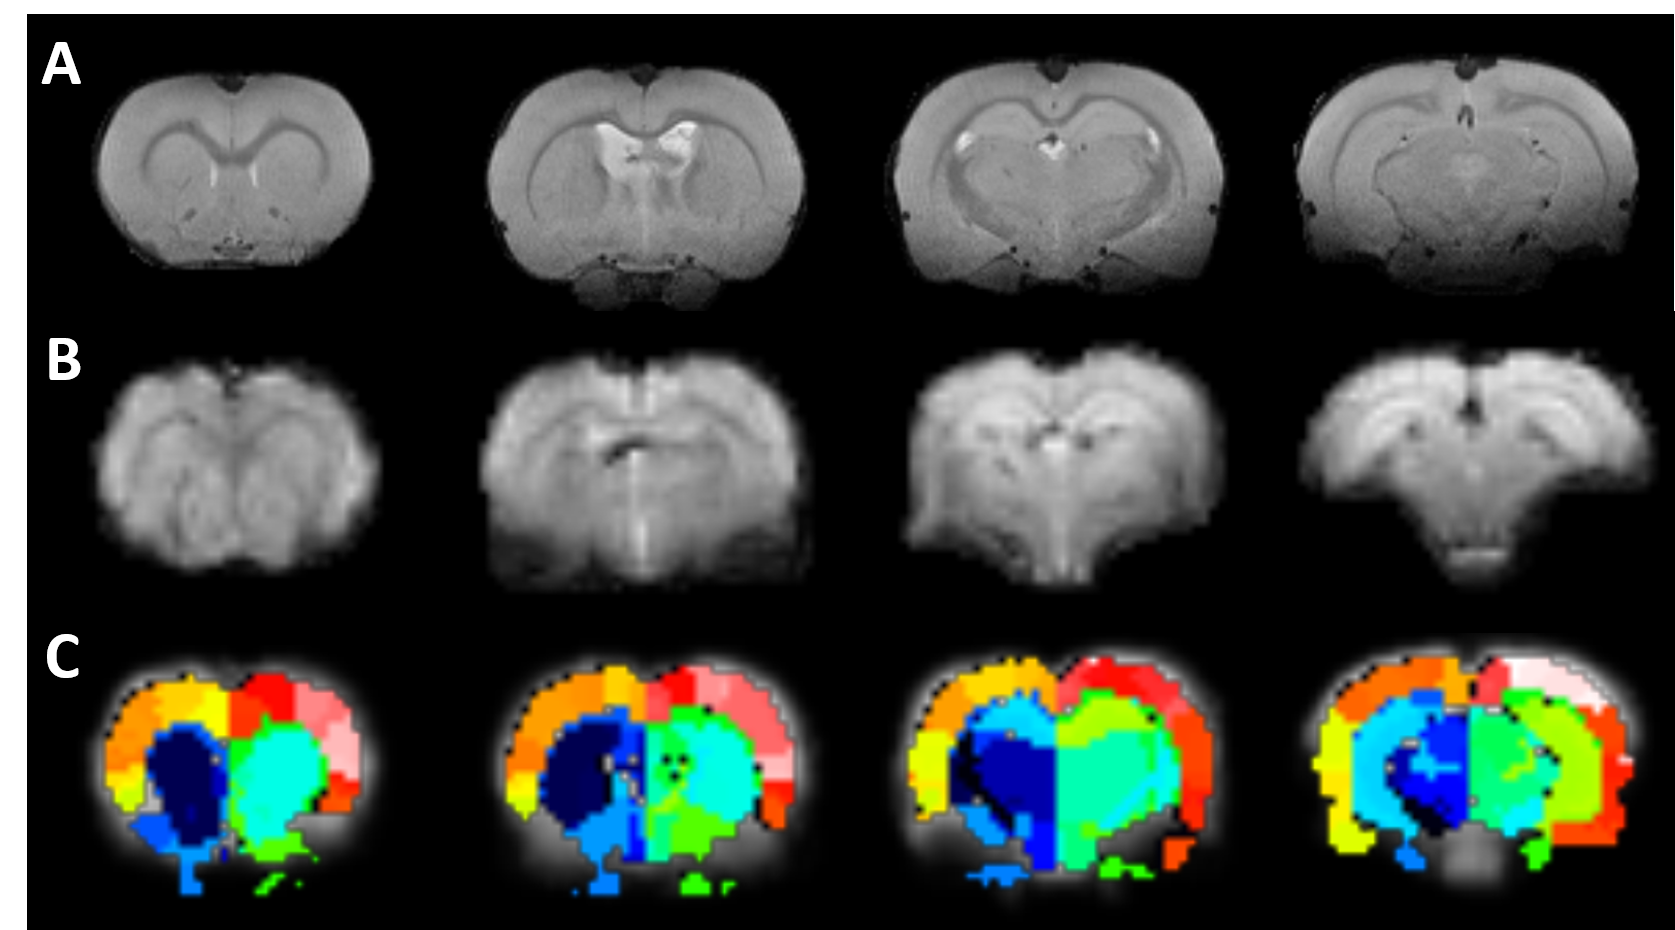
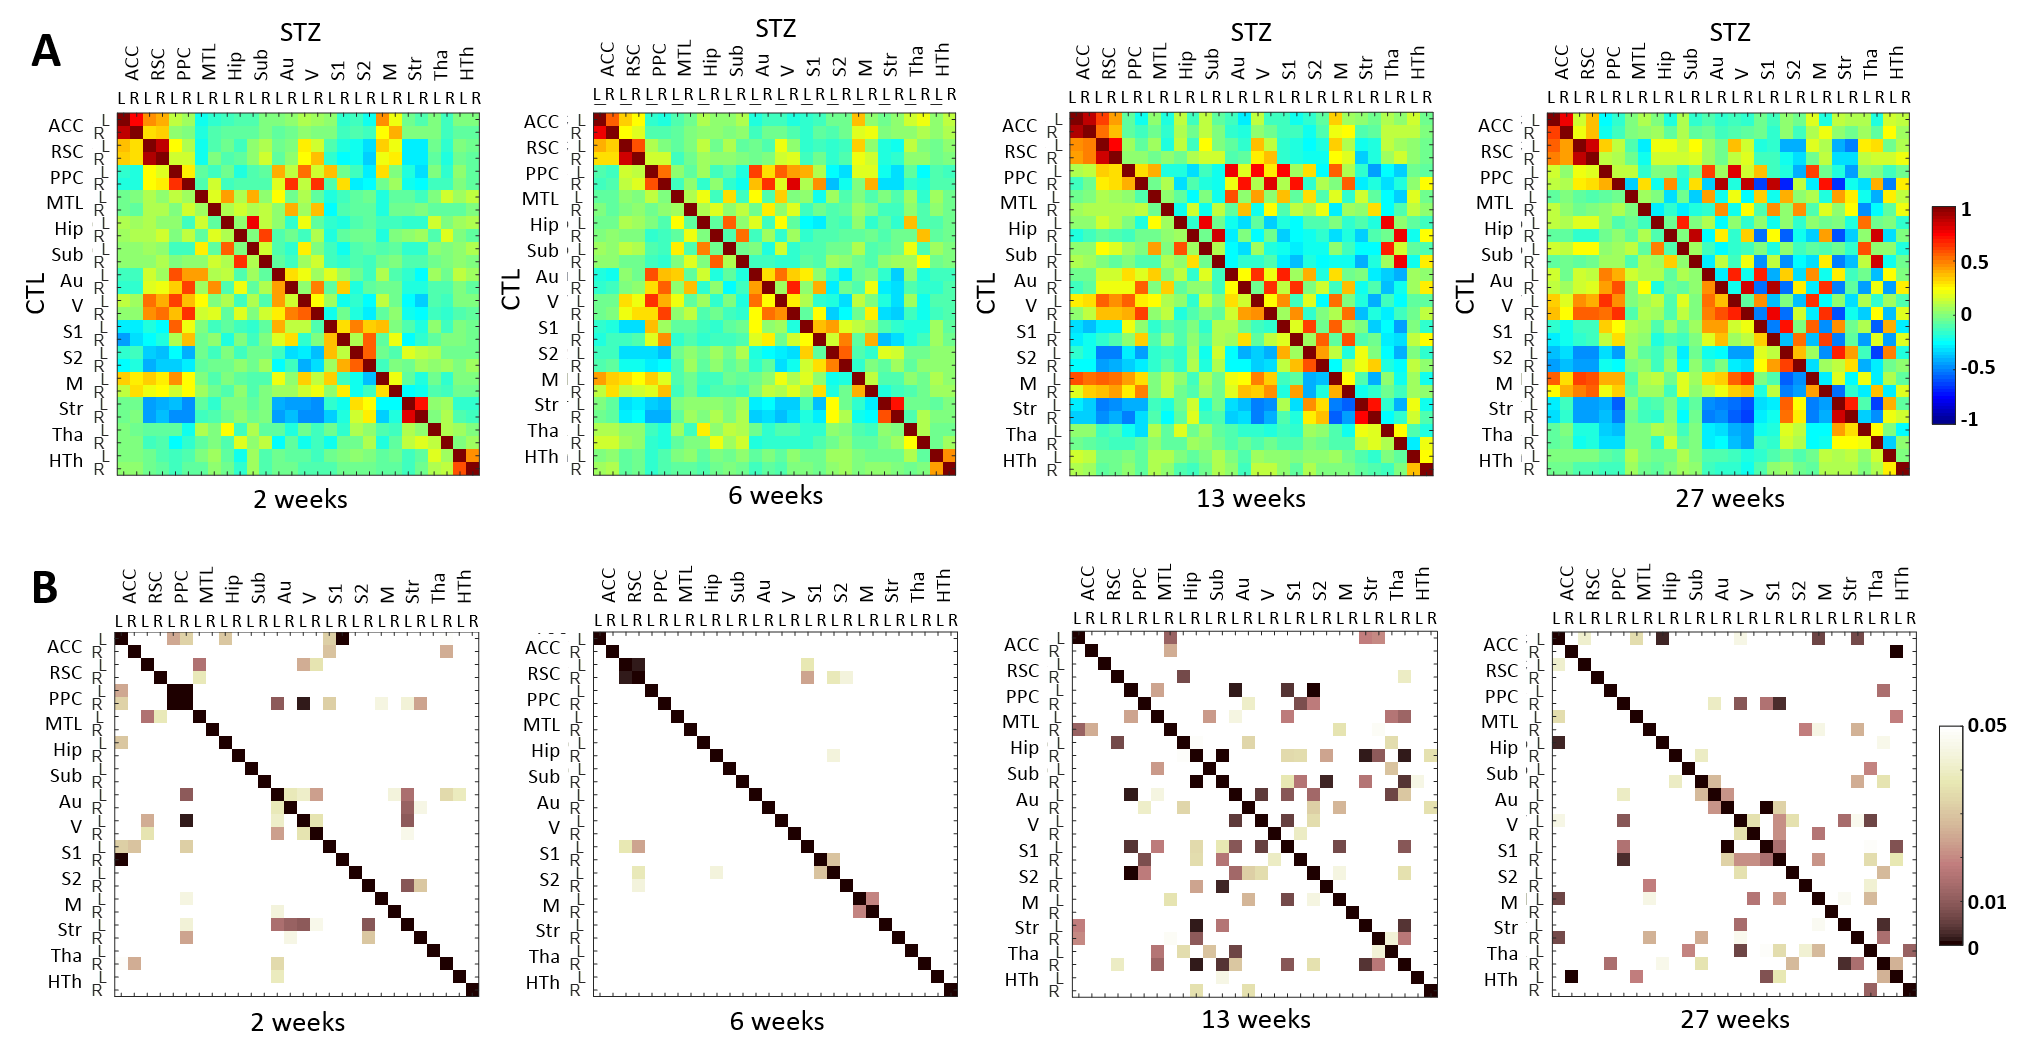
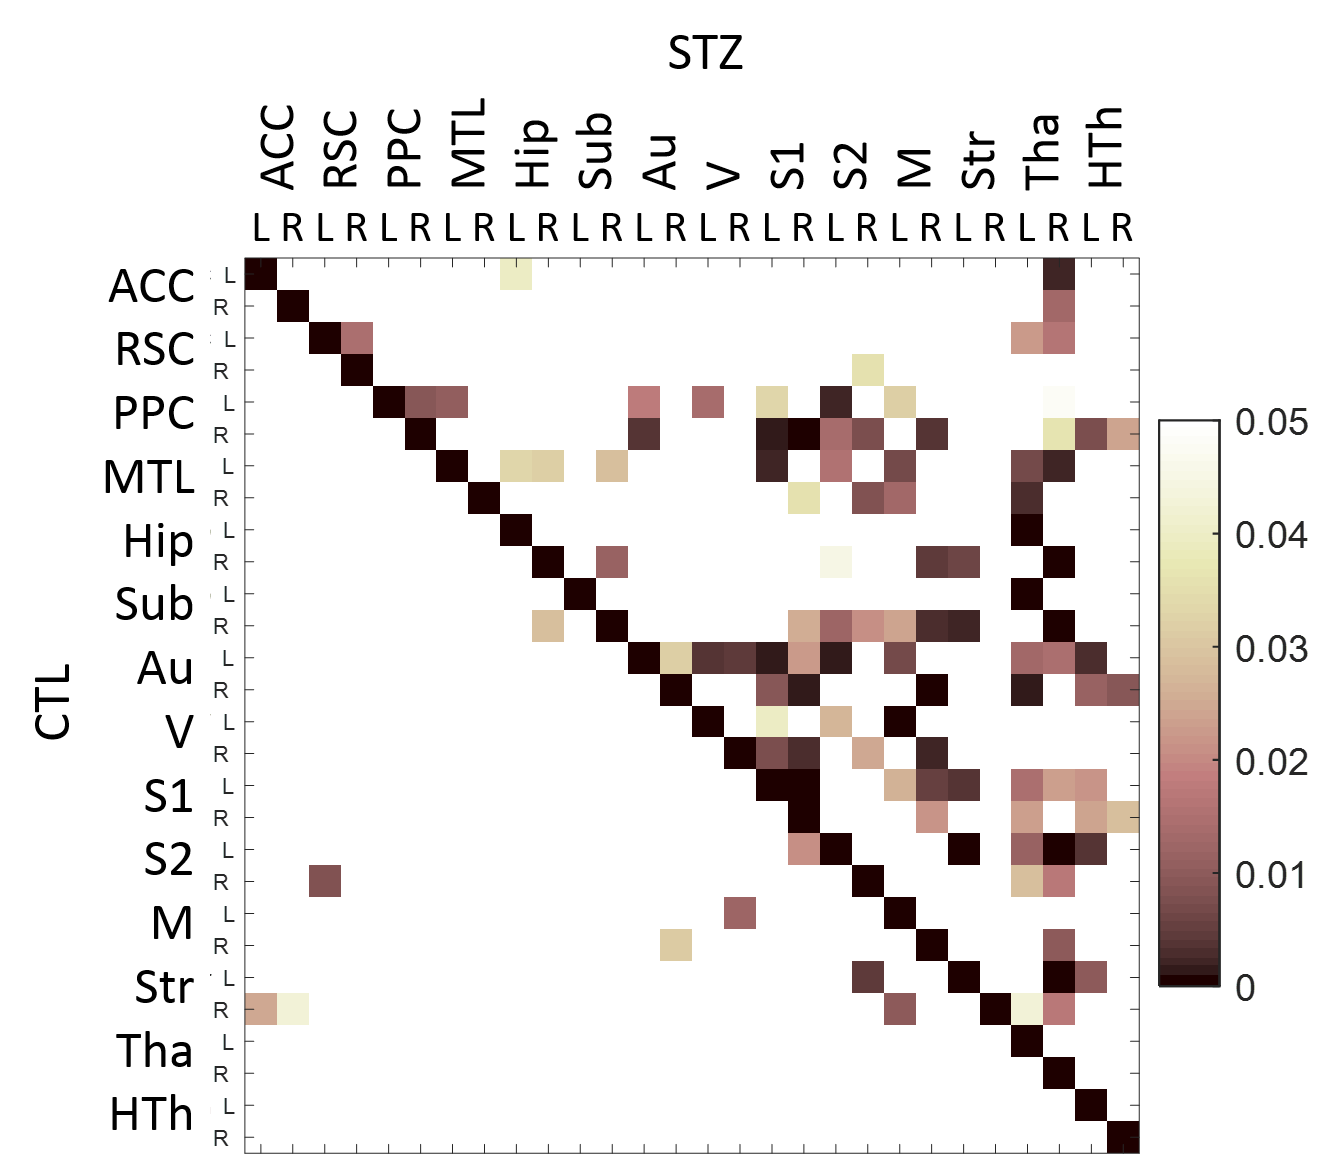
Figure 4. A: Hybrid average fc matrices at each timepoint (top-right half: STZ fc, bottom-left half: CTL fc). B: Significant differences (p<0.05) in fc between groups, at each timepoint. P-values have not been corrected for multiple comparisons. Abbreviations: ACC: anterior cingulate cortex; RSC: retrosplenial cortex; PPC: posterior parietal cortex; MTL: medial temporal lobe; Hip: hippocampus; Sub: subiculum; Au: auditory; V: visual; S1: primary somatosensory; S2: secondary somatosensory; M: motor; Str: striatum; Tha: thalamus; HTh: hypothalamus. L/R: left/right.