3040
Multimodal brain MRI at birth predicts neurodevelopmental outcome at 2 years of ageMinhui Ouyang1, Qinmu Peng1, Lina Chalak2, Nancy Rollins3, and Hao Huang1,4
1Department of Radiology, The Children's Hospital of Philadelphia, Philadelphia, PA, United States, 2Department of Pediatrics, University of Texas Southwestern Medical Center, Dallas, TX, United States, 3Department of Radiology, University of Texas Southwestern Medical Center, Dallas, TX, United States, 4Department of Radiology, Perelman School of Medicine, University of Pennsylvania, Philadelphia, PA, United States
Synopsis
Structural and functional maturation level of
Purpose
Perinatal brain development is characterized by differential white matter (WM) myelination, axonal packing and neural circuit formation [1-4]. Neonate brain structure and function can be quantitatively delineated with DTI fractional anisotropy (FA) and resting-state fMRI (rs-fMRI) functional connectivity strength (FCS), respectively. We hypothesized that features extracted from multimodal brain MRI at birth could better predict the neurodevelopmental outcomes at 2 years of age compared to features extracted from only DTI or rs-fMRI. In this study, high-resolution diffusion MRI (dMRI) and rs-fMRI were acquired from 26 normal neonates. Bayley-III evaluation was conducted in a follow-up study when participants are at 2 years of age. Using machine learning algorithms, we aimed to establish the best predictive models by leveraging functional and structural measurements from multimodal brain MRI to predict neurodevelopmental outcome at 2 years of age. The established model can identify biomarkers for early intervention of infants with atypical brain development.Methods
Participants, multimodal neonatal MRI and Bayley tests: 26 normal preterm and term neonates (Male/Female: 19/7) were recruited and scanned around birth (ages of 36.2±2.7 postmenstrual weeks). All MR scans were performed on a 3T Philips Achieva MR system. High resolution dMRI data were acquired with following parameters: single shot EPI, TR/TE=6850/78ms, FOV=168x168mm2, voxel size =1.5x1.5x1.6mm3, 60 slices, 30 independent diffusion-weighted directions, b-value=1000sec/mm2. For rs-fMRI, 210 whole brain EPI volumes were acquired using the following parameters: TR/TE=1500/27ms, FOV=168×168 mm2, voxel size=2.4×2.4×3mm3, 30 slices. In a follow-up study, all infants at their 2 years of age (corrected for prematurity) underwent a Bayley test (Bayley-III) [5] to assess their cognitive, language and motor development. Bayley test was conducted by a board-certified developmental psychologist. Microstructural and functional measures: The details of measuring FA at the skeleton and rs-fMRI preprocessing by using a custom-made protocol can be found in the literature [3, 6]. Briefly, FA maps were calculated for all subjects using DTIStudio (mristudio.org). White matter “skeleton” was generated to measure the FA at the core of WM regions (Fig 1) and alleviate partial volume effects. FCS was calculated as the average of the correlations between one voxel and all other voxels in the gray matter mask in the template space (Fig 1). Feature extraction: A Penn-CHOP neonate brain atlas was used to identify the WM tracts and cortical gyri [7], after nonlinearly registering all neonate images to the 36PMW neonate template. WM FA and cortical FCS were calculated for all subjects by averaging the FA in each skeletonized WM tract and FCS in each cortical gyrus, respectively. Bayley scores prediction: Pattern analysis was performed using the support vector regression (SVR) algorithm implemented in LIBSVM (http://www.csie.ntu.edu.tw/~cjlin/libsvm) [8]. Cognitive/language/motor scores from Bayley-III were used as the training measures. After age effect adjusted, regional WM FA and cortical FCS values formed the feature vector and were used as the SVR predictor. 10-fold cross-validation with 1000 permutations was adopted to evaluate the performance of the SVR model of each score. Pearson correlation coefficient and mean absolute errors (MAEs) between the actual and predicted scores were computed to evaluate the prediction models.Results
With combined WM FA and cortical FCS as features, predicted cognitive scores (r=0.646, p <0.001 in Fig. 2) obtained from SVR models are significantly correlated with the actual scores from Bayley-III. A higher correlation coefficient (r=0.64±0.05) and lower MAEs (4.98±0.34) of the cognitive prediction model were achieved with combined features from multimodal MRI than the ones from only DTI or rs-fMRI (Fig. 3), while the performance of language and motor prediction models were not improved with multimodal information. In the SVR model, the training data is defined as a weighted combination of all features, where this weight vector indicates the relative contribution of each feature. Fig. 4 shows heterogeneous feature-contribution patterns across brain cortical and WM regions with larger bar values indicating more importance in the prediction model. Interestingly, in WM FA measures, the limbic WM tract group contributed prominently in cognitive prediction, and in the FCS measures the frontal and occipital lobes were more important predictors.Discussion and conclusion
Features extracted from multimodal brain MRI improved prediction of the cognitive score, although no significant improvement was found in predictions of language and motor scores. Structural and functional features from WM FA and cortical FCS at birth may be combined for better prediction of the 2-year neurodevelopmental outcome. Heterogeneous feature-contribution patterns were observed across cortical and white matter regions. By weighting contribution from different cortical gyri and white matter tracts, sensitive biomarker could be identified for early intervention of infants with atypical brain development.Acknowledgements
This study is funded by NIH MH092535, MH092535-S1 and HD086984.References
[1] Ouyang et al (2018) NeuroImage (in press) doi: 10.1016/j.neuroimage.2018.04.017. [2] Dubois et al (2008) Hum. Brain Mapp. 29:14-27. [3] Cao et al (2017) Cereb Cortex 27: 1949-1963. [4] Fair et al (2009) PLoS Comput Biol. 5:e1000381. [5] Beyley (2006) San Antonio TX: Harcourt Assessment. [6] Yu et al (2016) Cereb Cortex 26:4381-4391. [7] Feng et al (2018) NeuroImage (in press) doi: 10.1016/j.neuroimage.2018.06.069. [8] Chang and Lin (2011) ACM TIST 2:27Figures

Fig. 1: Overview of feature extraction and predictive analysis. White matter (WM) skeleton (green) overlaid on fractional anisotropy (FA) map obtained from diffusion MRI and cortical functional connectivity strength (FCS) from resting-state fMRI from a representative subject are shown. For each subject, regional skeletonized WM FA and cortical FCS measurements mapped from Penn-CHOP neonate brain atlas (Feng et al., 2018) formed the feature vectors. Bayley scores prediction was performed using the support vector regression (SVR) models and estimated by 10-fold cross-validation.
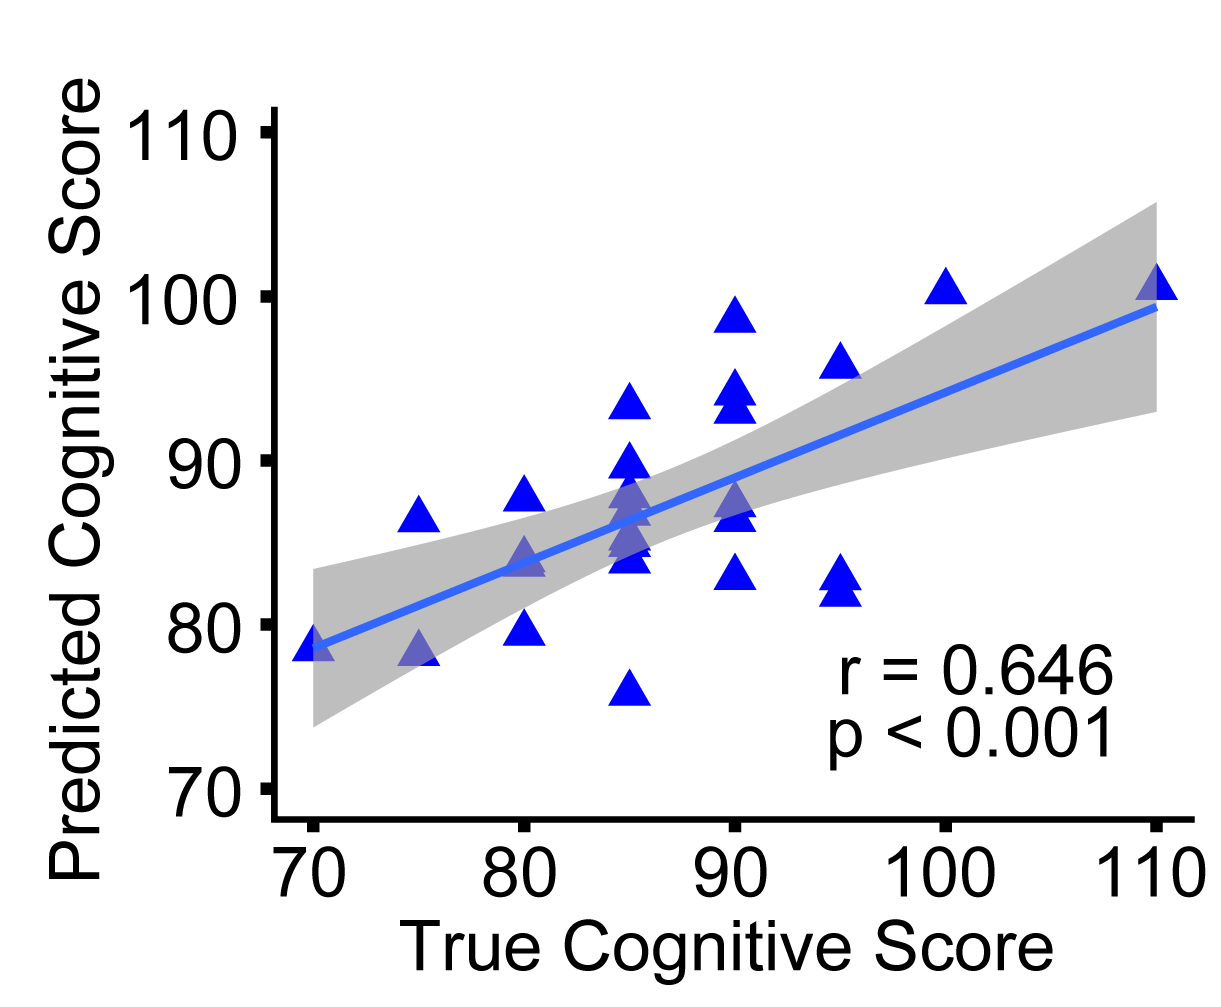
Fig. 2: Prediction of Bayley cognitive scores with WM FA and cortical FCS as
features. A significant correlation between predicted and true cognitive scores
(p<0.001) was observed with combined WM FA and cortical FCS as features. Each
triangle in the scatter plot indicates one subject, and shaded areas are 95%
of the confident interval of linear regressions.

Fig. 3: Comparison of performances of prediction models for continuous Bayley cognitive scores. Correlation coefficient and Mean Absolute Errors (MAEs) between actual and predicted scores based on 10-fold cross-validation were used to evaluate the model performance. The dashed line indicates the significant correlation level (p < 0.05) based on the current sample size. WM FA (shown in blue) and cortical FCS (shown in orange) were used as features separately or combined (shown in gray) in machine learning algorithms.

Fig. 4: Feature-contribution patterns across different cortical gyri (left panel) and WM tracts (right panel). Cortical gyri are grouped into six lobes and WM tracts are categorized into four WM tract groups. The circular bar-plots show the normalized feature weights from the SVR models in predicting cognitive.