3037
Global and regional white matter development in early childhood1Department of Radiology, University of Calgary, Calgary, AB, Canada, 2Owerko Centre, Alberta Children Hospital Research Institute, University of Calgary, Calgary, AB, Canada, 3Hotchkiss Brain Institute, University of Calgary, Calgary, AB, Canada, 4Department of Neuroscience, University of Calgary, Calgary, AB, Canada, 5Cumming School of Medicine, University of Calgary, Calgary, AB, Canada, 6Department of Pediatrics, University of Calgary, Calgary, AB, Canada, 7Department of Community Health Sciences, University of Calgary, Calgary, AB, Canada
Synopsis
White matter development continues into early adulthood, but specific regional trajectories in early childhood remain unclear. We aimed to characterize developmental trajectories and sex differences of white matter in healthy young children. 391 diffusion tensor imaging datasets from 118 children (59 male; 2-7.5 years) were analyzed using tractography. Fractional anisotropy increased and mean diffusivity decreased by 5-15% over the 5.5-year period, likely reflecting increases in myelination and axonal packing. Faster and greater development was observed in males during this period. The preschool period appears to be a critical period for the occipital and limbic connections, which underwent the largest changes.
Introduction
Diffusion MRI enables in vivo exploration of white matter microstructural development, and has shown rapid brain microstructural development during the first years of life, with remodelling processes continuing at a slower pace into adulthood.1-4 Limited research, however, has detailed brain white matter development over the preschool period,5 in part due to the difficulties associated with MRI scanning of young children (e.g. motion). The dynamic changes in behavior, cognitive abilities, and emotional regulation that are characteristic of early childhood (2-6 years) make this an age range of particular interest.
Methods
This study included 391 datasets on 118 healthy children (59 male), aged 1.97-6.97 years at intake (mean = 3.97 ± 1.02 years). Imaging was conducted using a GE 3T MR750w scanner and 32-channel head coil. Whole-brain diffusion weighted images were acquired using a single shot spin echo echo-planar imaging sequence, with TE=79ms, TR=6750ms; 30 gradient directions at b=750 s/mm2, and 5 volumes at b=0 s/mm2. DTI data were visually checked, and motion-corrupted volumes were removed; remaining data was preprocessed in ExploreDTI (V4.8.6).6 Semi-automated deterministic streamline tractography was used to delineate ten white matter tracts, with small manual edits to remove spurious fibres. Average fractional anisotropy (FA), mean- (MD), axial- (AD) and radial diffusivity (RD) were extracted for each tract for each child.
Statistics were performed using RStudio version 1.1.453,7 and the ‘lme4’,8 and ‘lmerTest’9 packages. Linear mixed models were run to determine the developmental trajectories (rates of change) of FA and MD for each tract, and global white matter metrics. Linear mixed models with both linear (y = age + age*sex + (1|subject)) and quadratic (y = age + age2+ age*sex + (1|Subject)) terms were modelled, with age, sex, and age*sex interactions modelled as fixed predictors and subject modelled as a random factor.
Results
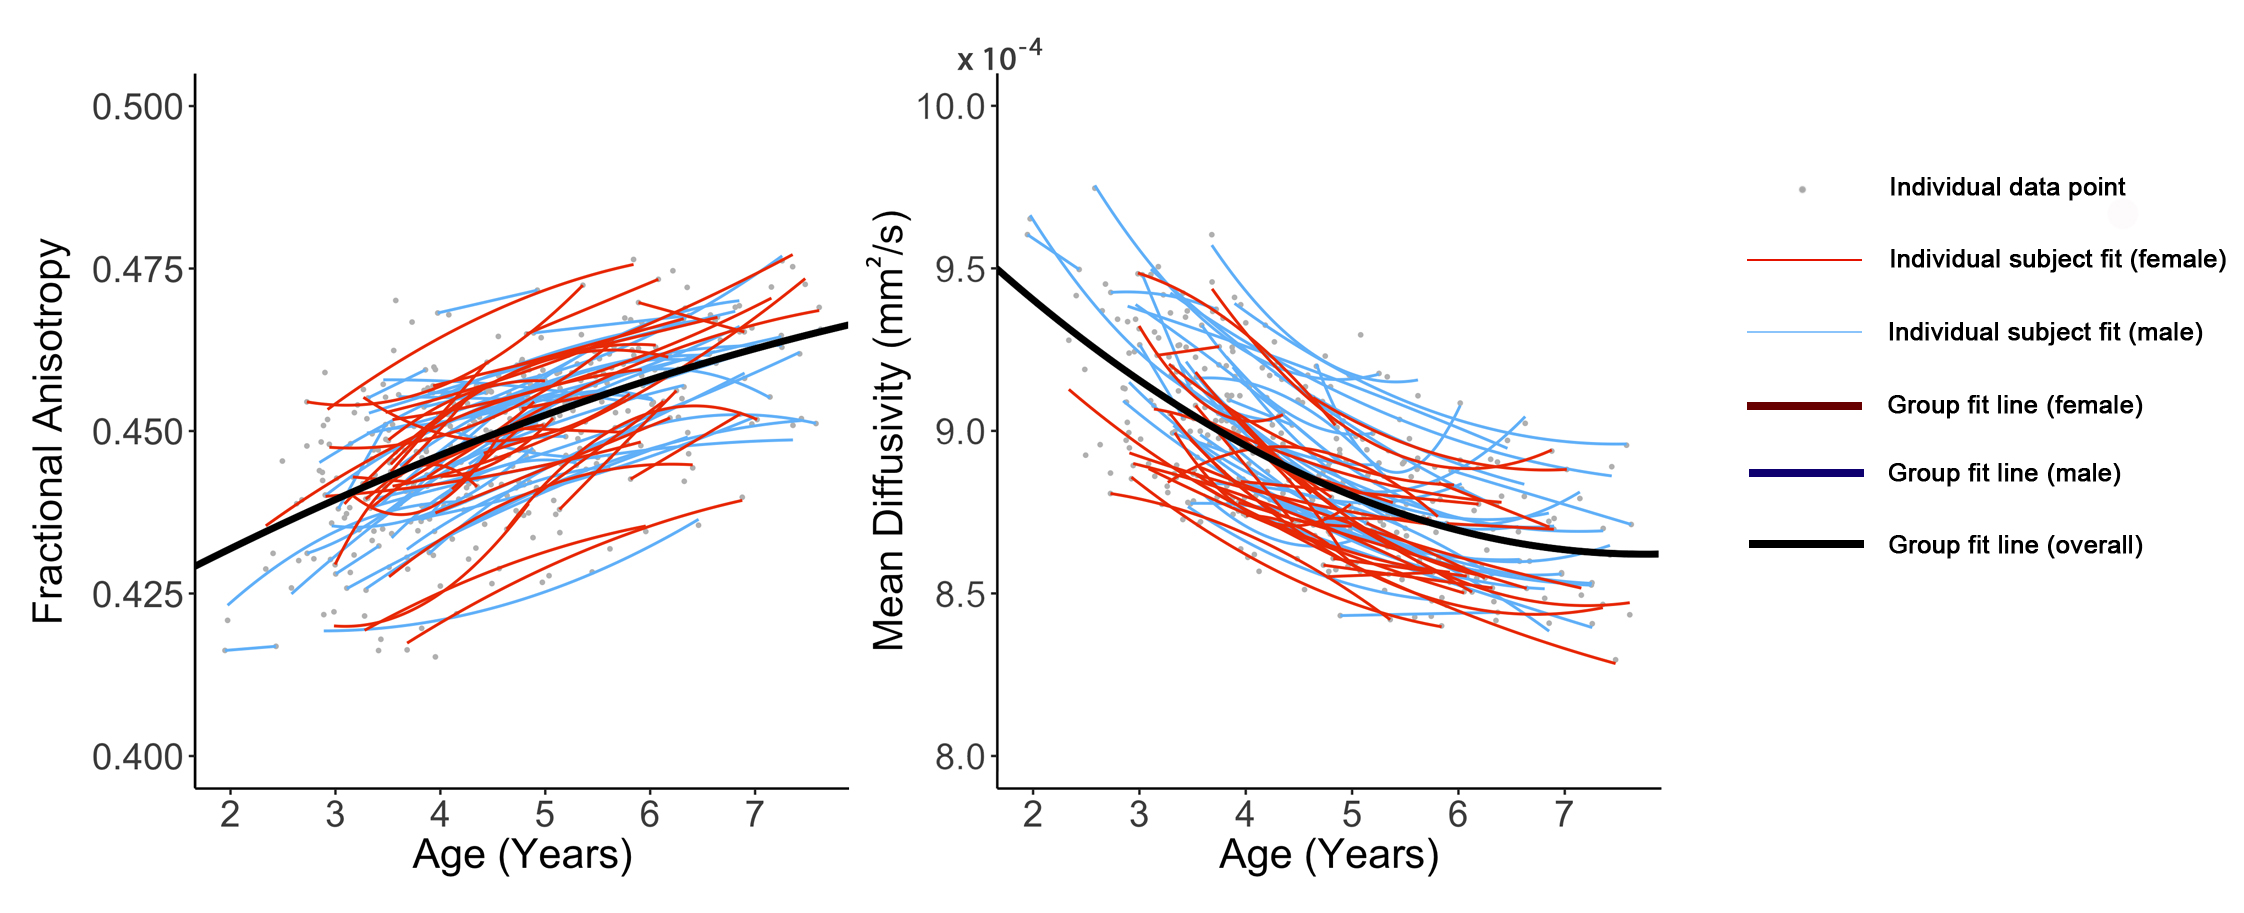
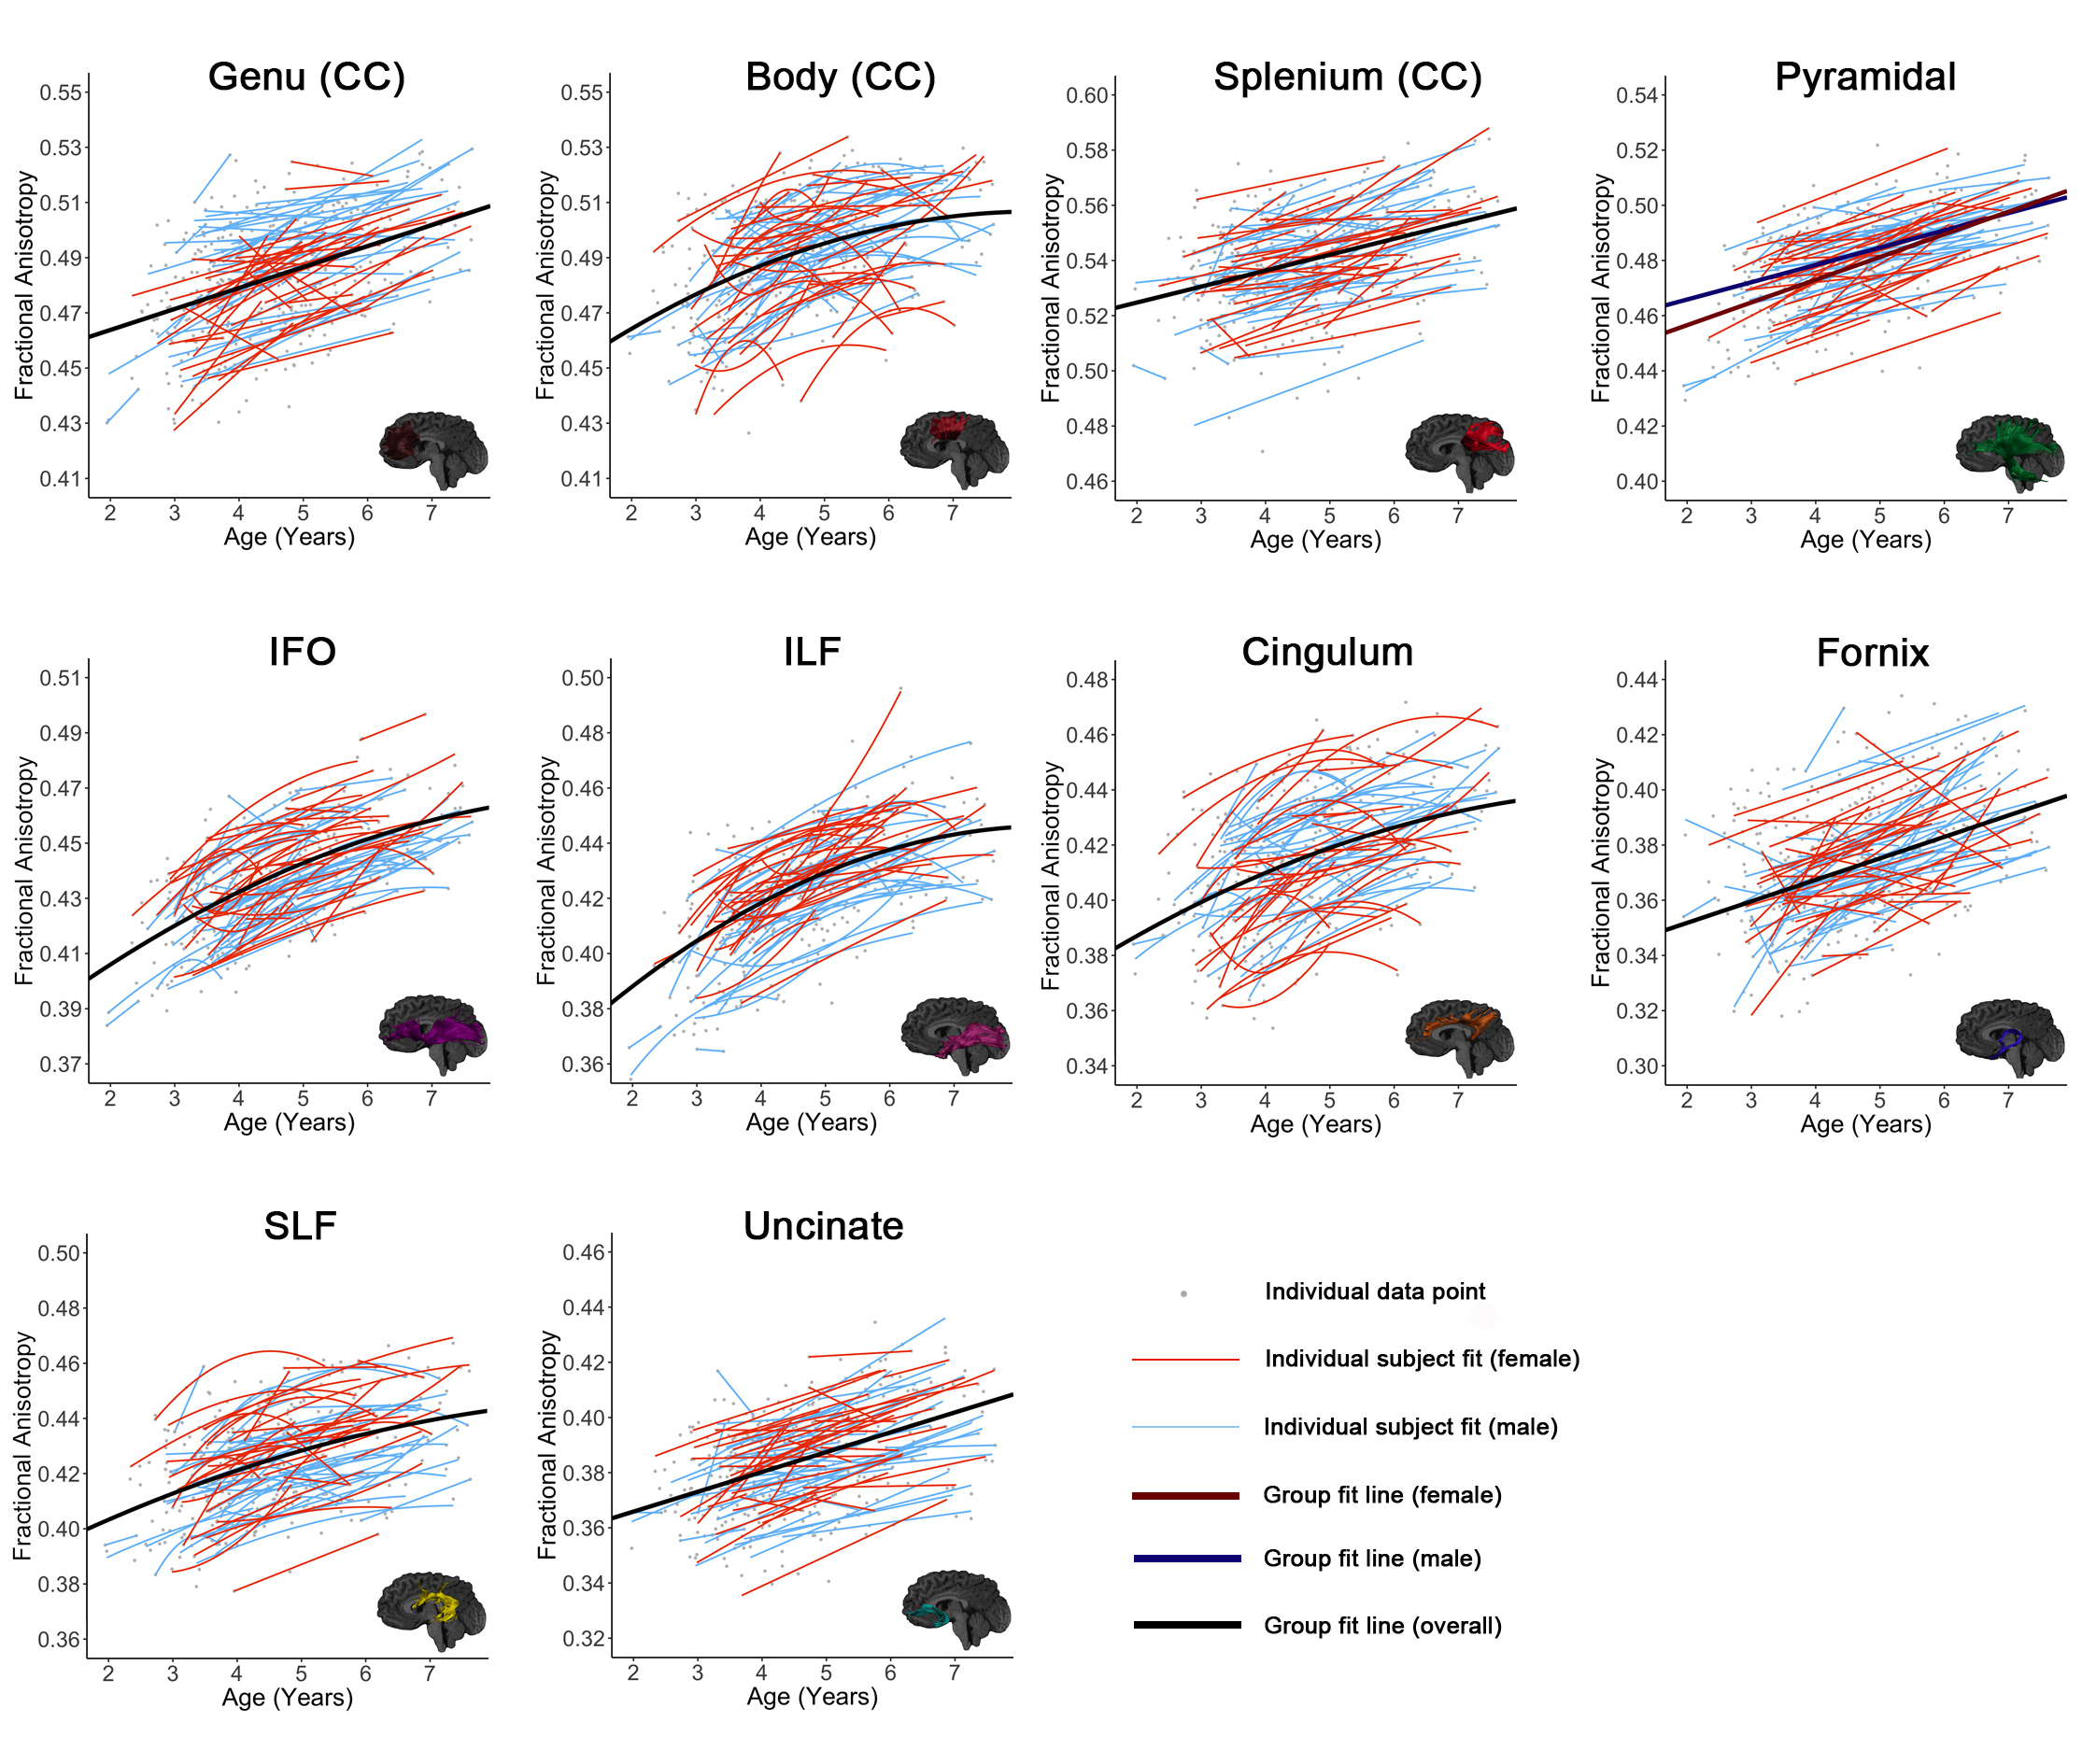
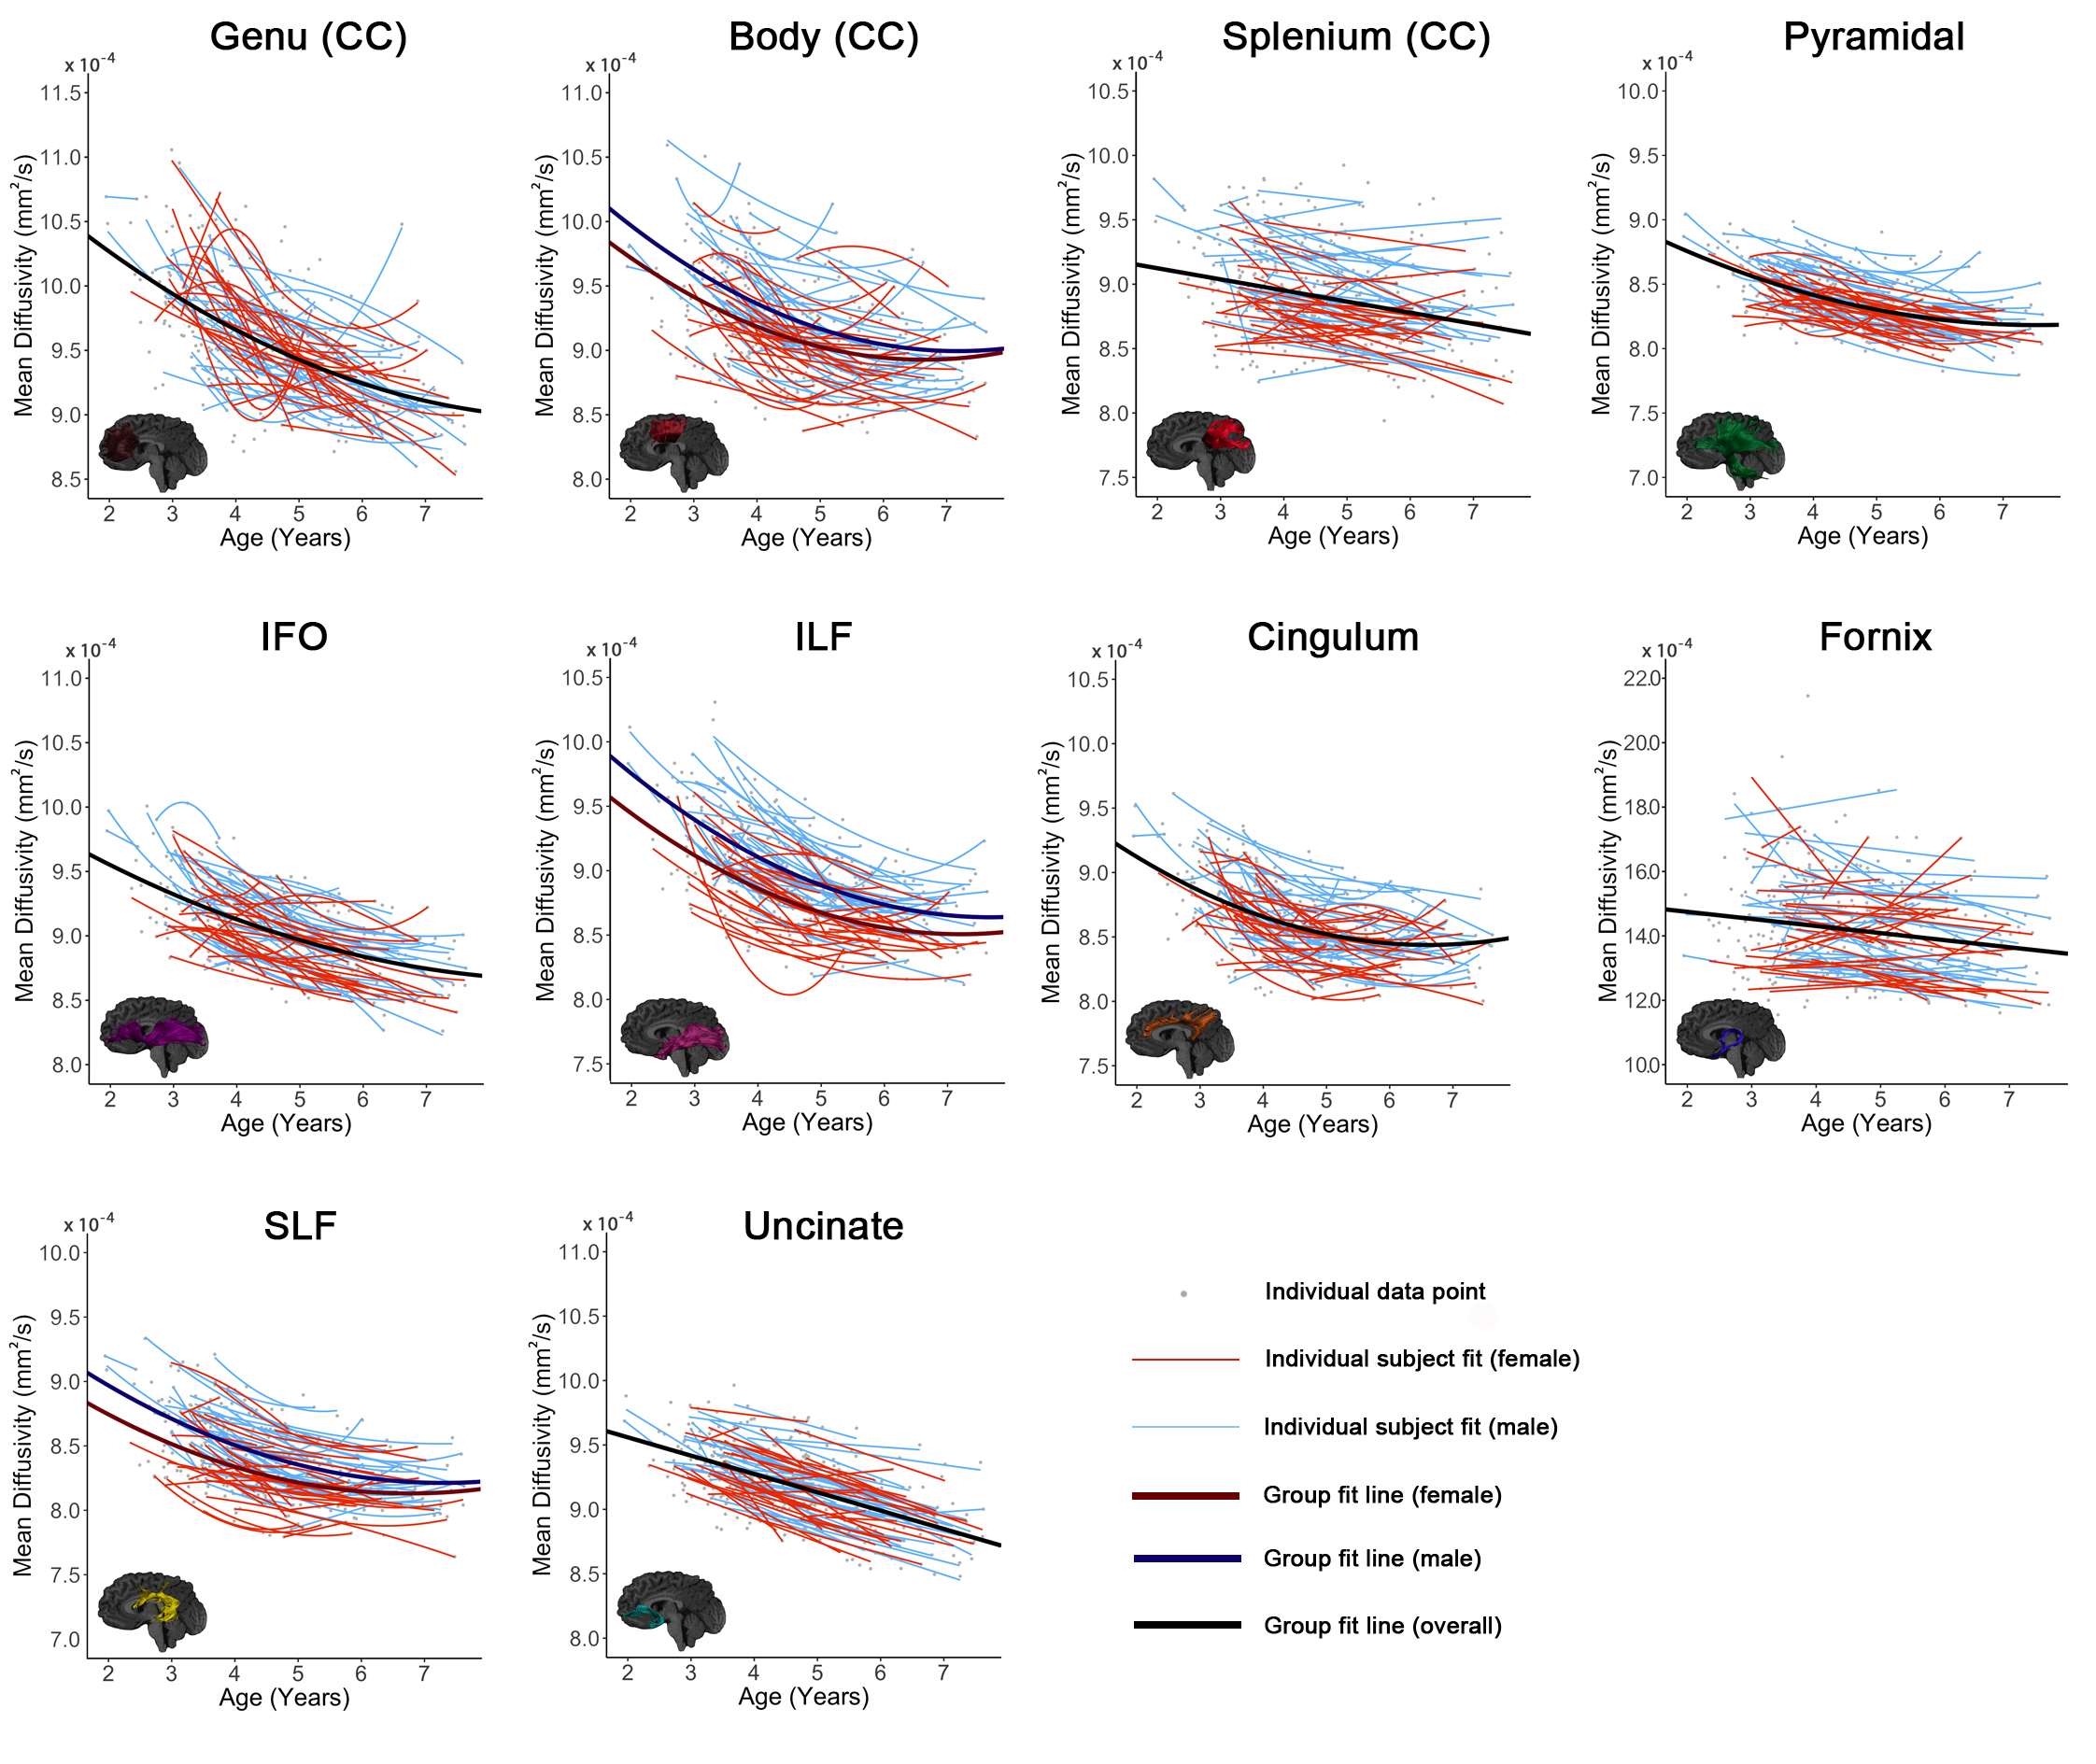
All tracts, as well as global means, showed significant age-related increases of FA and decreases of MD (Figures 1-3). The genu, splenium, fornix, pyramidal, and uncinate demonstrated linear FA increases; the body of the corpus callosum, cingulum, IFO, ILF, SLF, and global FA demonstrated quadratic development. The splenium, fornix, and uncinate showed linear MD decreases, while the body, genu, cingulum, IFO, ILF, pyramidal, SLF, and global MD demonstrated quadratic declines.
A main effect of sex on FA was significant in the genu (p = 0.021) and pyramidal (p = 0.001), where males had higher FA than females. Females had lower global MD than males (p < 0.001), and lower MD in the fornix (p = 0.018), cingulum (p = 0.041), SLF (p < 0.001), body (p = 0.001), and ILF (p < 0.001). An interaction effect of age*sex was observed in the pyramidal (p = 0.008), with females having a faster FA increases than males. A significant interaction for MD was identified in the body of the corpus callosum (p = 0.037), ILF (p = 0.030), and SLF (p = 0.008) where males had faster and greater MD declines than females.
Discussion and Conclusions
Our large, longitudinal study characterized regional and temporal variation in the development of white matter connections in young children, and demonstrated changes of 5-15% across the preschool period. The regional patterns suggest ongoing development of all white matter tracts, but relatively faster development within occipital and limbic tracts, which suggests that this is a critical development period for these structures. Callosal tracts and frontal-temporal association fibers had relatively slower development rates, but callosal tracts had higher starting FA values. Combined with previous literature showing in infants,1,10 this suggests callosal tracts may be slowing down and nearing the end of their maturation, which is consistent with them reaching plateaus around 10-12 years.2,11 On the other hand, the frontal-temporal association fibers had low starting FA values and slow development, which suggests that these are still in the early stages of development, consistent with protracted development into young adulthood.2,11 Considerable variation was observed in individual intercepts, perhaps suggesting that intrinsic factors (e.g., genetics, prenatal environment) influence brain structure. Much more subtle variation was observed in development slopes, which may be critical for understanding relationships between the environment (e.g., learning) and brain development.
Faster and greater development was observed in males during the preschool period, which may suggest that development in females occurs earlier; this is consistent with prior research in older children.3,12-15
In conclusion, our results comprehensively map white matter development during early childhood, providing data that could be used to examine deviations from normal development in children with various diseases, disorders, or brain injuries.
Acknowledgements
This work was supported by the Canadian Institutes of Health Research (CIHR) (funding reference numbers IHD-134090, MOP-136797, New Investigator Award to C.L). J.E.R was supported by an Eyes High University of Calgary Postdoctoral Scholarship and the T. Chen Fong Postdoctoral Fellowship in Medical Imaging Science. M.N.G was supported by a University of Calgary Queen Elizabeth II Graduate Studentship award. The authors thank members of the APrON study for assistance with recruitment.References
1. Dubois J, Dehaene-Lambertz G, Kulikova S, Poupon C, Hüppi PS, Hertz-Pannier L. The early development of brain white matter: a review of imaging studies in fetuses, newborns and infants. Neuroscience 2014;276:48-71.
2. Lebel C, Walker L, Leemans A, Phillips L, Beaulieu C. Microstructural maturation of the human brain from childhood to adulthood. Neuroimage 2008;40(3):1044-1055.
3. Simmonds DJ, Hallquist MN, Asato M, Luna B. Developmental stages and sex differences of white matter and behavioral development through adolescence: a longitudinal diffusion tensor imaging (DTI) study. Neuroimage 2014;92:356-368.
4. Taki Y, Thyreau B, Hashizume H, Sassa Y, Takeuchi H, Wu K, Kotozaki Y, Nouchi R, Asano M, Asano K. Linear and curvilinear correlations of brain white matter volume, fractional anisotropy, and mean diffusivity with age using voxel‐based and region‐of‐interest analyses in 246 healthy children. Hum Brain Mapp 2013;34(8):1842-1856.
5. Brown TT, Jernigan TL. Brain development during the preschool years. Neuropsychol Rev 2012;22(4):313-333.
6. Leemans A, Jeurissen B, Sijbers J, Jones D. ExploreDTI: a graphical toolbox for processing, analyzing, and visualizing diffusion MR data. Soc Mag Reson Med 2009; 17:3537.
7. RStudio Team. RStudio: integrated development for R. RStudio, Inc, Boston, MA. URL: http://www.rstudio.com 2016.
8. Bates D, Mächler M, Bolker B, Walker S. Fitting Linear Mixed-Effects Models Using lme4. J Stat. Softw 2015;67:48.
9. Kuznetsova A, Brockhoff PB, Christensen RHB. lmerTest Package: Tests in Linear Mixed Effects Models. J Stat. Softw 2017. 82(13): 26.
10. Paydar A, Fieremans E, Nwankwo J, Lazar M, Sheth H, Adisetiyo V, Helpern J, Jensen J, Milla S. Diffusional kurtosis imaging of the developing brain. AJNR Am J Neuroradiol 2014;35(4):808-814.
11. Tamnes CK, Østby Y, Fjell AM, Westlye LT, Due-Tønnessen P, Walhovd KB. Brain maturation in adolescence and young adulthood: regional age-related changes in cortical thickness and white matter volume and microstructure. Cereb Cortex 2009;20(3):534-548.
12. Asato M, Terwilliger R, Woo J, Luna B. White matter development in adolescence: a DTI study. Cereb Cortex 2010;20(9):2122-2131.
13. Clayden JD, Jentschke S, Muñoz M, Cooper JM, Chadwick MJ, Banks T, Clark CA, Vargha-Khadem F. Normative development of white matter tracts: similarities and differences in relation to age, gender, and intelligence. Cereb Cortex 2011;22(8):1738-1747.
14. Seunarine KK, Clayden JD, Jentschke S, Munoz M, Cooper JM, Chadwick MJ, Banks T, Vargha-Khadem F, Clark CA. Sexual dimorphism in white matter developmental trajectories using tract-based spatial statistics. Brain Connect 2016;6(1):37-47.
15. Wang Y, Adamson C, Yuan W, Altaye M, Rajagopal A, Byars AW, Holland SK. Sex differences in white matter development during adolescence: a DTI study. Brain Res 2012;1478:1-15.
Figures