3036
Validation of Synthetic MRI Brain Volume Segmentation Results in Very Preterm Infants1Department of Radiology, Vrije Universiteit Brussel (VUB), Universitair Ziekenhuis Brussel (UZ Brussel), Brussels, Belgium, 2SyntheticMR AB, Linköping, Sweden
Synopsis
A novel brain segmentation method, based on quantitative R1, R2 and PD maps measured using a multi-delay multi-echo sequence, was tested on very preterm neonates. The intracranial, brain and CSF volumes and fractions were determined using both the quantitative method and MANTiS, an established atlas-based segmentation method. The results of both methods were compared by using Bland-Altman plots and by quantifying the overlap by co-registering the different segment maps and calculating the Dice score. Despite some systematic differences in the volumetric results, both methods agree well. This study shows that segmentation using quantitative data functions well even for neonates.
Introduction
Fast, automatic segmentation of the brain can be achieved with synthetic MRI by using quantitative R1, R2, and proton-density (PD) data and a lookup table to determine the mixture of tissue types in a given voxel1. However, because the neonatal brain shows less distinction between grey and white matter and contains more water in its parenchyma, the segmentation algorithm must be adapted. This study compares a segmentation method using quantitative data extended to also include the neonatal brain with a state-of-the-art segmentation method, to verify the reliability and to investigate potential systematic differences.Methods
Preterm neonates (n=43, 25 males, 28.7±2.5 weeks gestational age,) were scanned at near-term equivalent age. Scans were performed on a 3T Ingenia scanner (Philips, Best, the Netherlands), using a multi-delay multi-echo (MDME) sequence with four saturation delays, two echo times and TR=5000ms, FOV=180x130x100mm³, acquisition resolution=0.7x0.9x3.0mm³, gap=0.3mm and scan time 6m10s. 3D T2 weighted (T2w) turbo spin-echo images were acquired using TE=331ms, TR=2500ms, FoV=160x160x180 mm³, resolution=0.5x0.5x0.45mm and scan time 2min. MDME data were analyzed and segmented using an adapted version of SyMRI 8 (SyntheticMR, Linköping, Sweden) in which detected CSF partial volume in neonatal brain parenchyma was suppressed. R1 and R2 relaxation rates and PD parameter maps were estimated, and the brain was segmented into different tissue types based on a look-up table specific for neonates. Processing time was ~10s. 3D T2w data were segmented using MANTiS2, a segmentation method designed specifically for neonates, based on the SPM pipeline3 and using a neonate atlas. Processing time using MANTiS was ~20min. Intracranial volume (ICV), brain parenchymal volume (BPV) and fraction (BPF), and cerebrospinal fluid volume (CSF) and fraction (CSFf) were calculated for both methods. To compare the volumetric results of the two methods, Bland-Altman plots with the relative difference on the y-axis were constructed for each measure, and the absolute and relative mean differences ± SD between both methods were calculated. The overlap between the brain-segment images made using both methods was estimated by first using SPM to co-register the synthetic T2w and 3D T2w images and then applying the co-registration parameters to the ICV and CSF maps. After applying a threshold to construct a binary image of the maps, the Dice score $$$D_x$$$ was calculated using:
$$D_x=2\frac{|Synt_x \cap 3D_x|}{|Synt_x|+|3D_x|} $$
where $$$x$$$ indicates the segment under consideration, and $$$Synt_x$$$ and $$$3D_x$$$ indicate the thresholded synthetic and 3D T2w segment images. The threshold was set at 50% except for the synthetic CSF segment, where a threshold of 20% was used because many CSF voxels contained a low fraction due to the thicker slices of the MDME sequence.
Results
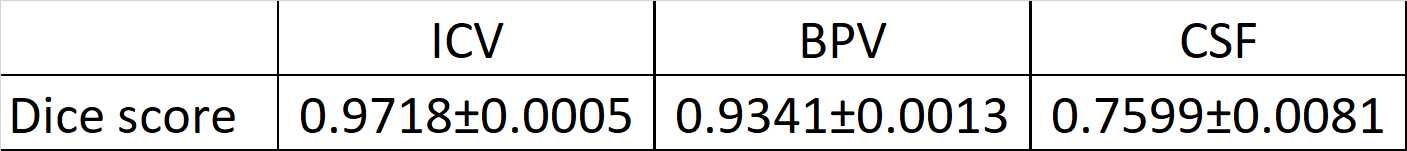
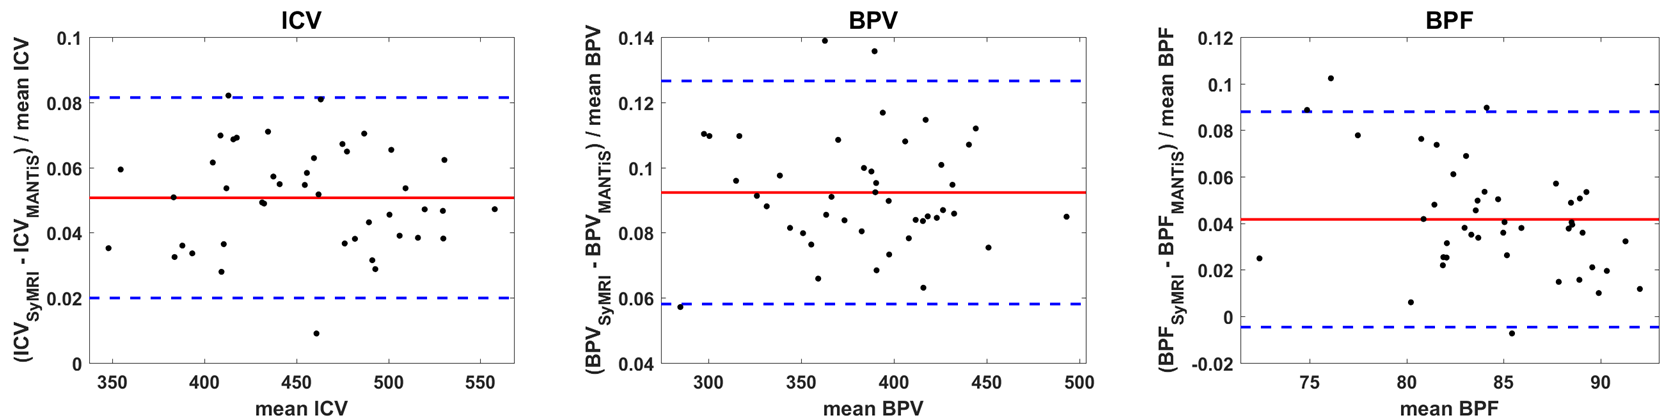
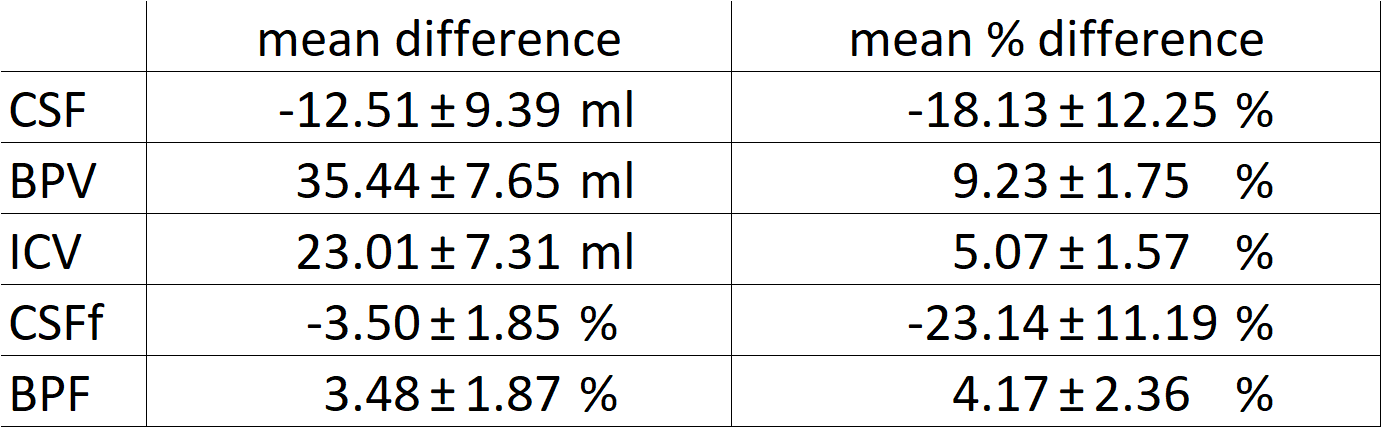
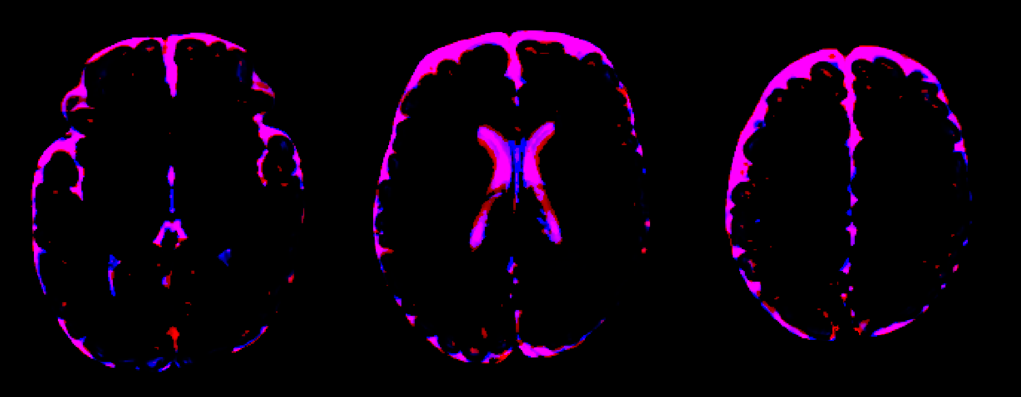
The mean Dice scores for ICV, BPV and CSF are listed in table 1. The relative differences between the methods are illustrated by Bland–Altman plots in Figure 1, the mean differences in table 2. Figure 2 shows the difference in CSF component between the methods.Discussion
Estimations of BPV, ICV and BPF are in general higher when measured with SyMRI than with MANTiS, while CSF and CSFf are lower. The larger relative differences for CSF and CSFf are caused by their low fraction and absolute volume. The systematic difference can be explained by the round-off errors in the SyMRI ICV mask due to low slice resolution and the methods’ definitions of where the skull begins, their calculation of partial volume, and their definitions of the bottom of the brain – SyMRI defines the bottom of the brain at the base of the cerebellum, while MANTiS includes part of the brainstem/spine below this level. Using a 3D MDME sequence could reduce the round-off error. These effects will have a relatively heavier effect on the CSF measures, as compared to the ICV and BPV measures. The standard deviation of the mean difference was <2.5% for BPV, BPF and ICV, indicating that the methods show good agreement despite the clear systematic difference. This can also be seen in the high Dice scores for the ICV and BPV masks. The CSF Dice score is somewhat lower, but still indicates good agreement.
Conclusion
Although the two methods show clear systematic differences this is not an issue since neither method is considered the gold standard. More importantly, the Bland-Altman plots and standard deviations of the mean percent difference indicate a low spread between the methods. The fast, automatic segmentation using MDME acquisitions and synthetic MRI techniques can be considered as reliable as MANTiS. It is advisable to use BPV, BPF and ICV because CSF measures are more volatile and affected most by method-specific parameters due to their lower relative volume.Acknowledgements
NoneReferences
1. West J, Warntjes JBM, Lundberg P. Novel whole brain segmentation and volume estimation using quantitative MRI. Eur Radiol. 2012;22(5):998-1007. doi:10.1007/s00330-011-2336-7.
2. Beare RJ, Chen J, Kelly CE, et al. Neonatal Brain Tissue Classification with Morphological Adaptation and Unified Segmentation. Front Neuroinform. 2016;10(March):1-17. doi:10.3389/fninf.2016.00012.
3. Friston KJ, Ashburner J, Kiebel SJ, Nichols TE, Penny WD, eds. Statistical Parametric Mapping: The Analysis of Functional Brain Images. 1st Editio. Academic Press; 2006.
Figures