3035
Longitudinal Multi-contrast Atlas of the Paediatric Brain Acquired with 3 Tesla scanners1Neuroradiology, IRCCS San Raffaele Scientific Institute, Milan, Italy, 2Neuroradiology, CERMAC, Milan, Italy, 3Neuroradiology, Vita-Salute San Raffaele University, Milan, Italy, 4Nuclear Medicine, IRCCS San Raffaele Scientific Institute, Milan, Italy
Synopsis
This work aims to set up a methodology for the creation of paediatric brain longitudinal atlases by using multimodal 3Tesla MR images. These atlases can be used as a reference of normality and enable to show the developmental trajectories of the brain and its tissues, enhancing the modifications that occur from birth to adulthood.
INTRODUCTION
Brain development is a long and continuous process which introduces changes in the structures and tissues. The availability of a normative description of the brain in the paediatric lifespan is very important for the study of the anatomical, structural and functional modifications occurring during the development. Unfortunately, their availability in paediatric population is still limited, in particular at high magnetic field. In this work we have collected MR images of normal paediatric brain and we have created multicontrast longitudinal templates of healthy paediatric patients acquired on 3 Tesla scanner.METHODS:
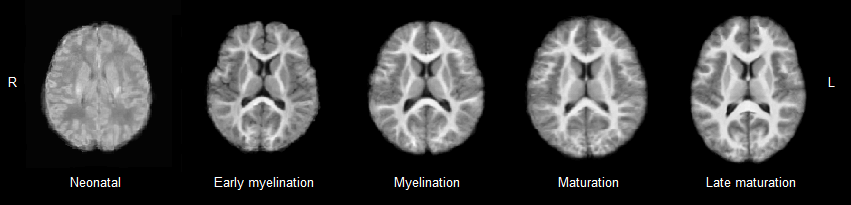
46 normal paediatric subjects were recruited to create longitudinal multimodal brain atlases. The subjects were distributed into five groups depending on their age and corresponding to different phases of brain development: neonatal period (0-3 months), early myelination (3-12 months), myelination (1-3 years), maturation (3-6 years), late maturation (6-17 years). The images were acquired in 10 different centres using 3T MR scanners of two different vendors. A common acquisition protocol was defined and applied for all the acquisition in order to obtain comparable high quality images. Sequence parameters were defined to achieve the best compromise between an optimal image contrast for all developmental stage and image weights (T1, T2, DTI) and the reproducibility of results. The normative atlases were created in five steps 1. Pre-processing: T1 and T2 weighted images were re-oriented to AC-PC line, underwent a N4 bias correction [1], intensity correction (IRTK, https://www.doc.ic.ac.uk/~dr/software/) and brain tissue extraction using BET (FSL http://fsl.fmrib.ox.ac.uk/fsl/fslwiki/FSL). DTI images were preprocessed using FDT toolbox in FSL, undergoing Eddy current correction, tensor reconstruction and Fractional Anisotropy parametric maps calculation. 2. Rigid registration: we used IRTK to coregister the images belonging to the subjects at the same developmental stage to a final reference space. For each subject, all the transformations to the other subjects were estimated with Normalised Mutual Information [2]. The rigid transformation applied to each subjects has been calculated as the mean rigid transformation obtained averaging the transformation applied to each subject to be transformed to the space of all the others. The application of this transformation to the starting image, let the images to be registered to a space not related to a single reference image but to the whole group, obtaining a group of images all registered to a common coordinate space. 3. Affine registration: a 12 parameters transformation was applied for the younger subjects (neonates, myelination) to correct for the higher variability, while in the older subjects (maturation phases) a 9 parameters transformation was performed. Even in this step a mean transformation was calculated and applied. [3,4]. 4. The non linear registration, implemented by Free Form Deformations (FFD) method [5,6,7], that through its adaptive characteristics enabled to assess the deformations in every voxel of the image. Once the deformations were calculated for every possible transformation, a weighted average was applied. 5. The final atlases were calculated, for every developmental step, as a weighted average, in order to be independent from a single reference but centered in the mean age of the developmental stage. The atlas is then calculated as the weighted average, where a higher weight is given to the subjects whose age is closer to the mean age of the range and whose better represent the age, while a lower weight is given to the subjects more distant from the center of the Gaussian curve.RESULTS:
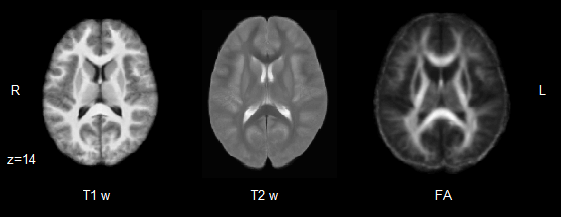
The atlases obtained in this preliminary phase and with a relative low number of subjects, are optimized and consistent both within the paediatric ranges and among modalities. The normalization to an independent common reference space was defined by using parameters and weights depending from the sample and enabled, at the same time, to describe the variability of the sample and to limit the deformations applied to the images. The result we achieved is the maximization of the accuracy in the anatomical representation of the paediatric brain (Figures 1 and 2).DISCUSSION AND CONCLUSIONS:
The templates calculated are characterized by a high resolution image quality, optimal contrast and a good definition of structures and features, that makes them an optimal references for image registration in group studies. The method have been choosen to be efficient regardless the contrast of the images or the age (i.e the size and the contrasts of the tissues of the brain) of the children. In fact the same procedure has been applied for T1, T2 and FA images of all the ranges of age of the children.Acknowledgements
This work was supported by the project “COLlection of pedIatric BRain Images” (Colibrì) funded by Italian Ministry of HealthReferences
[1] Tustison, N. J., et al., IEEE Trans Med Imaging 2010, vol 29(6): 1310-1320.
[2] Maes, F., et al.. IEEE Trans Med Imaging 1997, 16(2): 187-198.
[3] M. Kuklisova-Murgasova, et al. Neuroimage 2011, vol. 54(4), pp. 2750-2763.
[4] A. Serag, et al.,Neuroimage 2012, vol 59(3), pp. 2255-2265.
[5] D. Rueckert et al., IEEE Trans Med Imaging 1999, vol18(8), pp. 712-721.
[6] J.A.R.D. Schnabel et al.,MICCAI 2001.
[7] D. D. A. E. Seghers, et al. MICCAI 2004
Figures