3034
Heterogeneous increase of regional cerebral blood flow and its correlation to functional connectivity during infant brain development1Department of Radiology, Children's Hospital of Philadelphia, Philadelphia, PA, United States, 2Department of Radiology, University of Pennsylvania, Philadelphia, PA, United States, 3Department of Radiology, Beijing Children’s Hospital, Beijing, China, 4Department of Neurology, University of Pennsylvania, Philadelphia, PA, United States, 5School of Psychological and Cognitive Sciences, Peking University, Beijing, China
Synopsis
The dynamic brain processes during infancy are supported by rapid maturational changes of regional cerebral blood flow (rCBF) to meet the metabolic demands of brain growth. However, the 4D spatiotemporal distribution of regional cerebral blood flow (rCBF) and its relationship to
Target audience
Neuroradiologists, neurologists and MR physicistsPurpose
The dynamic brain processes during infancy are supported by rapid maturational changes of regional cerebral blood flow (rCBF) to meet the metabolic demands of brain growth. However, the 4D spatiotemporal distribution of regional cerebral blood flow (rCBF) and its relationship to emergence of functional networks are not known. We acquired pseudo-continuous arterial-spin-labeling (pCASL) perfusion MRI and resting-state fMRI (rs-fMRI) from 48 infants aged 1 to 24 months to quantify rCBF and functional connectivity (FC), respectively. The ROIs of default-mode network (DMN), visual and sensorimotor networks were identified with independent component analysis (ICA) of rs-fMRI datasets. The goal is to delineate the heterogeneous rCBF increases across the functional brain regions of interests (ROIs) and delineate the correlation between rCBF increase and FC increase at corresponding functional ROIs.Methods
Infant subjects and data acquisition: 48 infants (18 females, age range from 1 to 24 months) were recruited. Both pCASL perfusion MRI and rs-fMRI imaging were acquired using a 3T Philips Achieva system with multi-slice single-shot EPI readout. The pCASL perfusion MRI parameters were: field of view (FOV) = 230×230 mm2, in-plane resolution = 2.74×2.74 mm2, 20 slices, slice thickness = 5 mm, no gap between slices, post-labeling delay (PLD) = 1600 ms, labeling duration (LabelDur) = 1650 ms, center of labeling slab located at the junction of spinal cord and medulla (65mm below central slab of imaging volume), TR = 4100 ms, TE = 15 ms, number of controls/levels = 30 pairs, α = 0.86. The rs-fMRI parameters were: FOV = 220 x 220 mm2, in-plane imaging resolution = 3.4 x 3.4 mm2, 37 slices, slice thickness = 3 mm, 1 mm gap between slices, TE = 24 ms, TR = 2000 ms, dynamics = 200. Phase contrast MRI was acquired to quantify the CBF of whole brain. RCBF measurements: Briefly, rCBF can be estimated from pCASL data using equation from [1] , $$$f_{pCASL}(x,y,z)=(6000\cdot \lambda \cdot\Delta M(x,y,z)\cdot exp(\frac{PLD(z)}{T_{1a}}))/(2\alpha \cdot M_{b}^{0}\cdot T_{1a}\cdot (1-exp(\frac{-LabelDur}{T_{1a}})))$$$ where fpCASL(x,y,z) is the blood flow at voxel (x,y,z) obtained from pCASL in milliliters of blood per minute per 100g brain tissue (ml/100g/min); ΔM(x,y,z) is the difference between dynamic-averaged signal intensity in control image and that in the label image at voxel (x, y, z); λ, the blood-brain partition coefficient, is 0.9 mL/g [2]; T1a, T1 of arterial blood, is 1800ms [3]. Identification of functional regions of interest: After preprocessing, independent component analysis (ICA) in FSL software was applied to processed rs-fMRI data to generate regions of interest (ROIs) of visual network (Vis), sensorimotor network (SM) and DMN, including posterior cingulate cortex (PCC), medial prefrontal cortex (MPFC), inferior parietal lobule (IPL) and lateral temporal cortex (LTC) in a template space [4]. Analysis of the age effect and coupling between rCBF and FC: Averaged values of rCBF for each region was correlated with subject age using linear regression. The FC within DMN was correlated with rCBF in each voxel to find out the coupling between rCBF and DMN FC. A nonparametric permutation test was used to evaluate the null hypothesis that the voxels with significant correlation between FC and rCBF distributed evenly in brain. The null hypothesis corresponds to a mean population percentage of significant voxels at the level of chance.Results
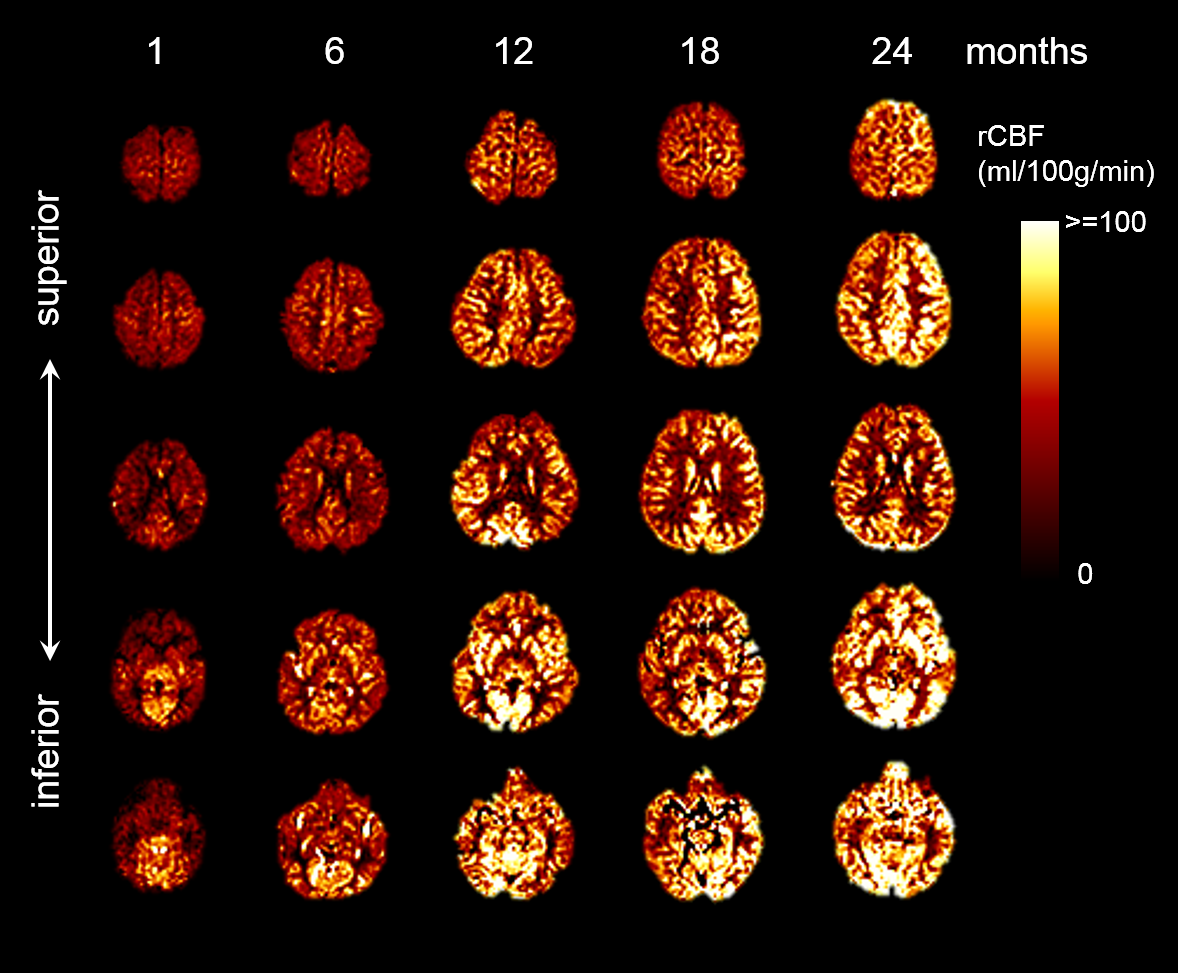
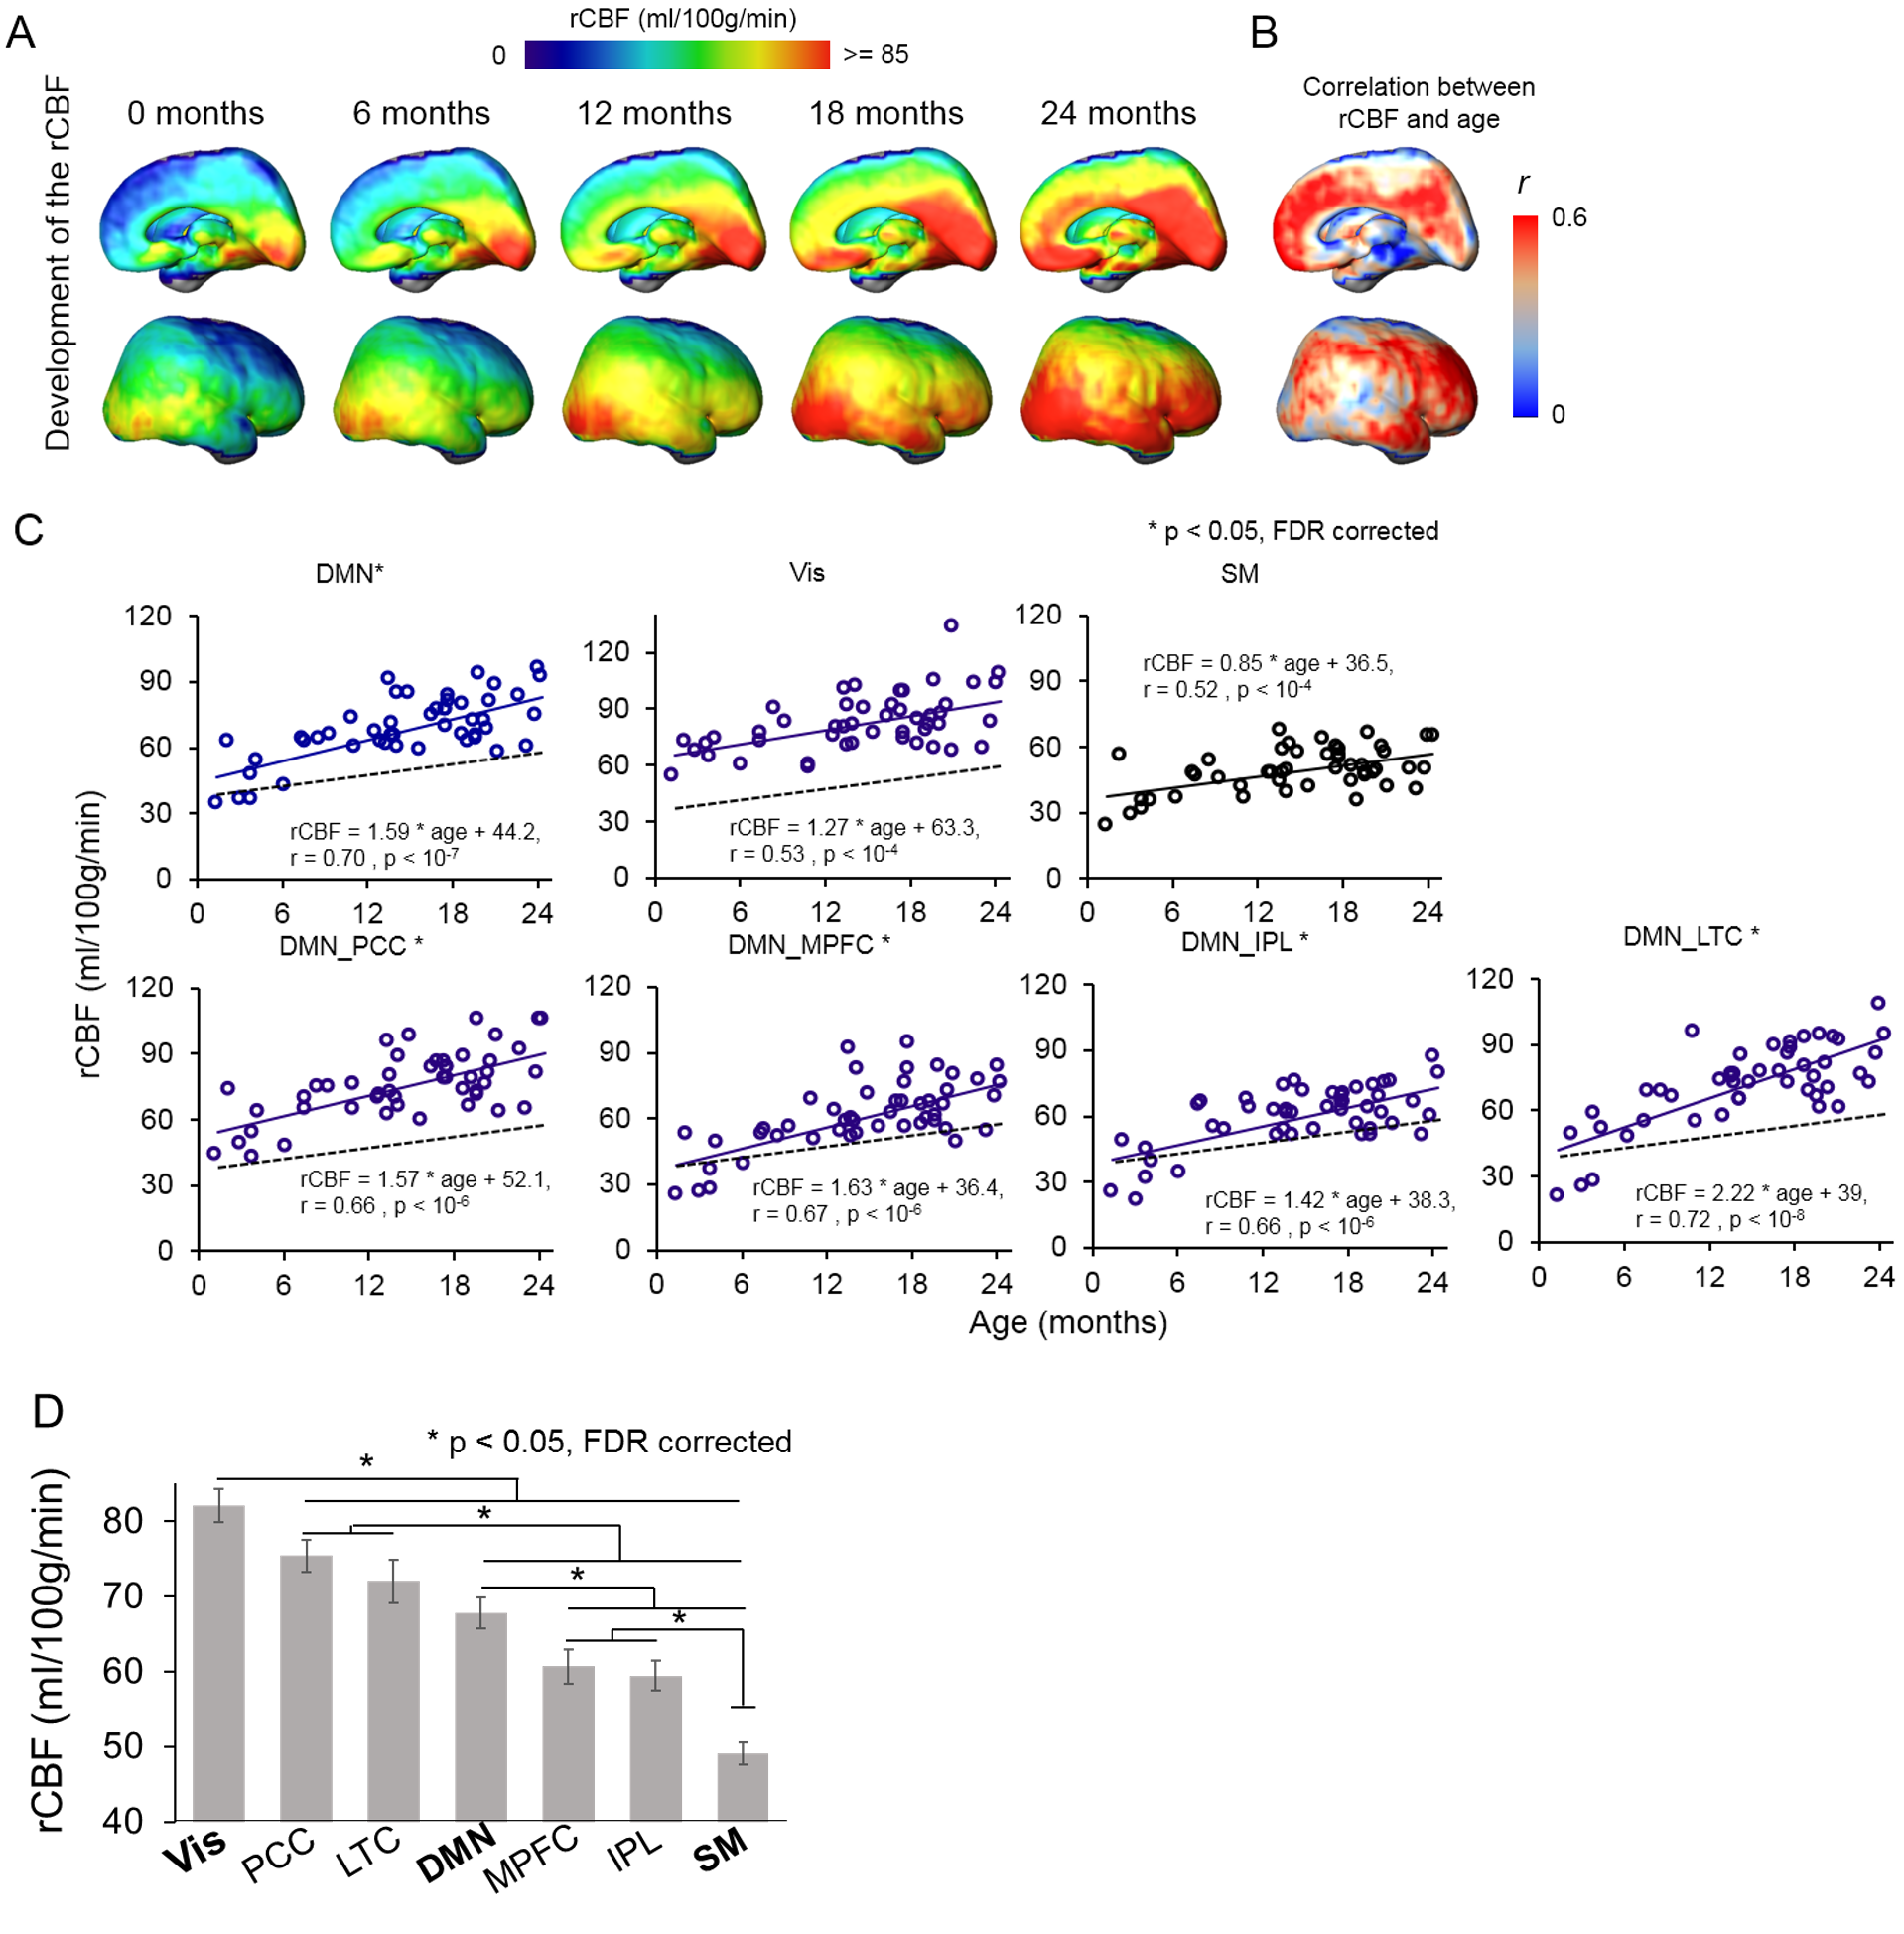
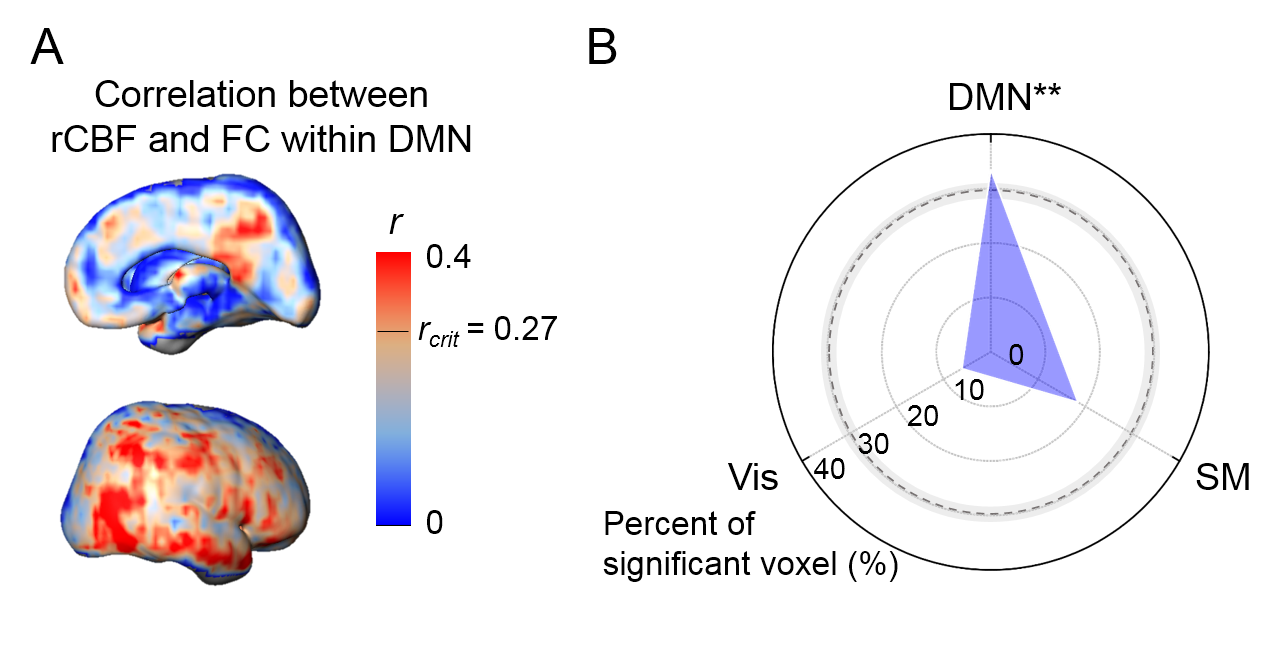
CBF maps of the infant brains: Regional CBF differences at a certain age and general increases of CBF with age are clear in the view of 2D slices (Fig 1) and 3D (Fig 2A). The correlation between rCBF map and age is shown in Fig 2B. CBF measurements in some regions, such as Vis, are higher than other regions (Fig 2D). Heterogeneous CBF increases among brain regions: Fig. 2C shows the significant CBF increases measured at DMN, Vis and DM. Interestingly, the CBF increases appear faster in the DMN regions than in SM. Coupling between FC and rCBF at DMN: Voxel-wise coupling between rCBF and FC shows significant correlation at DMN, but not Vis and SM (Fig 3).Discussion and conclusions
In this study, we found that rCBF increased significantly and heterogeneously among brain regions from 0 to 2 years. RCBF measurements increase faster in the DMN ROIs, including PCC, MPFC and IPL, than other functional ROIs. Faster rCBF increase at specific ROIs suggested a higher rate of metabolism to support brain circuit formation at these regions. Permutation tests revealed significant correlation between rCBF increases and FC increases at the DMN ROIs, not visual or sensorimotor functional ROIs. This study provides unique insight into the quantified rCBF dynamics during infant development and suggests the physiological underpinning of the emergence of certain functional networks.Acknowledgements
This study is funded by NIH MH092535, MH092535-S1, and HD086984.References
[1] Alsop et al., (2015) MRM 73: 102.
[2] Herscovitch & Raichle (1985) Cereb Blood Flow Metab 5: 65.
[3] Liu et al. (2015) Magn Reson Med 75: 1730.
[4] Smith et al. (2009) PNAS 106: 13040.
Figures