3033
Atlas-based analysis of brain development from newborn to adolescence using NODDI1Institute of Science and Technology for Brain-inspired Intelligence, Fudan University, Shanghai, China, 2Department of Radiology, Tongji Hospital, Tongji Medical College, Huazhong University of Science and Technology, Wuhan, China
Synopsis
Neurite orientation dispersion and density imaging (NODDI) is a specific designed diffusion model for brain, which provides insights into intra-cellular water contents. Here, we investigated the brain development from 0 to 14 years old using NODDI. The whole brain was divided into 159 regions including cortical gray matter, deep gray matter (dGM) and white matter, and was analyzed through exponential regression. Neurite density presented a higher sensitivity to age-related changes than FA, especially in gray matters. Regional specific asymmetry was found between hemispheres in dGM. Sex difference was observed in the developmental rate of GM.
Introduction
Diffusion tensor imaging (DTI) has been widely used to detect the anatomical changes during brain development. The changes in fractional anisotropy (FA) and diffusivity are thought to reflect myelination, neuronal growth and pruning. However, DTI lacks the specificity to disentangle microstructures in brain. As a biophysical compartment model, neurite orientation dispersion and density imaging1 (NODDI) can provide new parameters such as neurite density (ND) and orientation dispersion (OD), which give insights into the intra-cellular compartment we are interested in. Here, we used NODDI to investigate the brain development from 0 to 14 years old. A whole brain atlas-based maturing pattern was obtained, including cortical gray matter (cGM), deep gray matter (dGM) and white matter (WM). Regional variation, cerebral asymmetry and sex difference were discussed in this study through quantitative analysis.Materials and methods
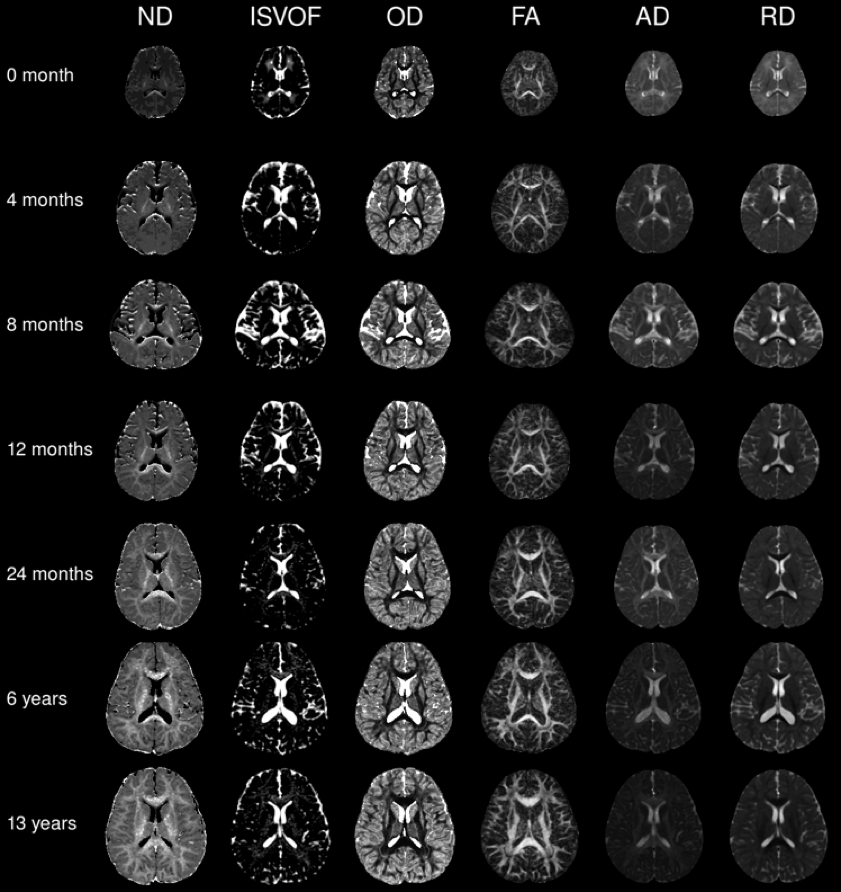
The study was approved by the Women and Children Health Care Center in Wuhan City Ethics Committee. 217 subjects (135 boys, 82 girls; age range:1day-14years) who underwent brain MRI for non-neurological indications were included in our study. Their whole brain DWIs were acquired with 10 non-diffusion weighted (b=0 s/mm2) images, and 30 diffusion weighted (b=1000, 2000 s/mm2) images each along 15 directions; NEX=2, TR/TE=4800/92.9ms, voxel size=1.9*1.9*3 mm3, scan time=6min 29s. After image pre-processing, 7 parameters (ND, OD, isotropic volume fraction (ISOVF), FA, axial/radial/mean diffusivity (AD/RD/MD)) were obtained for each voxel from NODDI and DTI (representative mappings were shown in Fig. 1). The JHU Pediatric (24month) Atlas with a 159-region segmentation was used for normalization. Average values of parameters were calculated within each region. Exponential regression $$$Y=C+Ae^{-age/\tau}$$$ was applied for quantitative analysis where $$$C$$$, $$$-A$$$ and time constant $$$\tau$$$ can represent the mature value, the total change and the developmental rate of $$$Y$$$ respectively. For sex difference analysis, boys and girls were fitted separately and compared using the two-sample two-tailed t test.Results
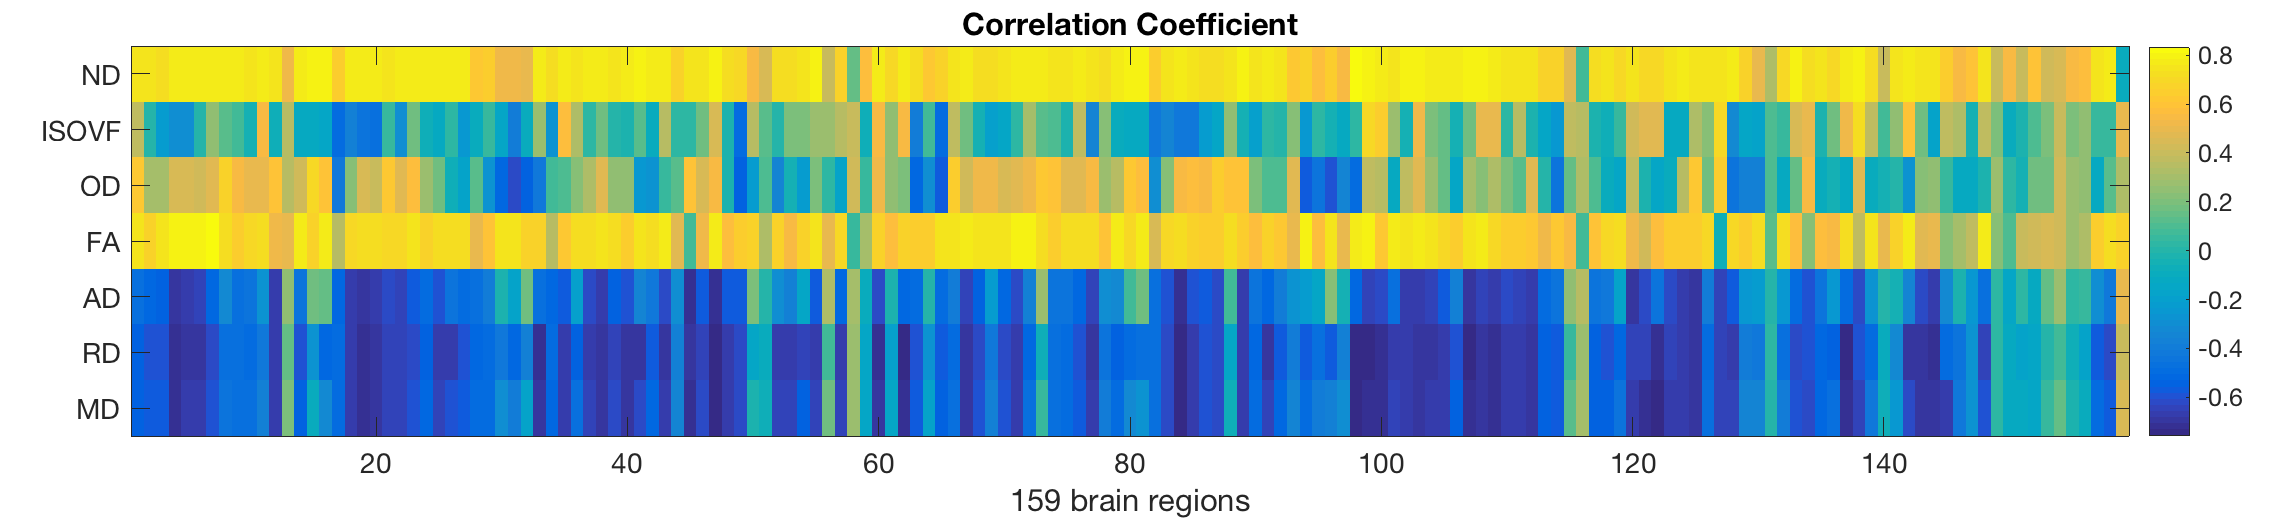
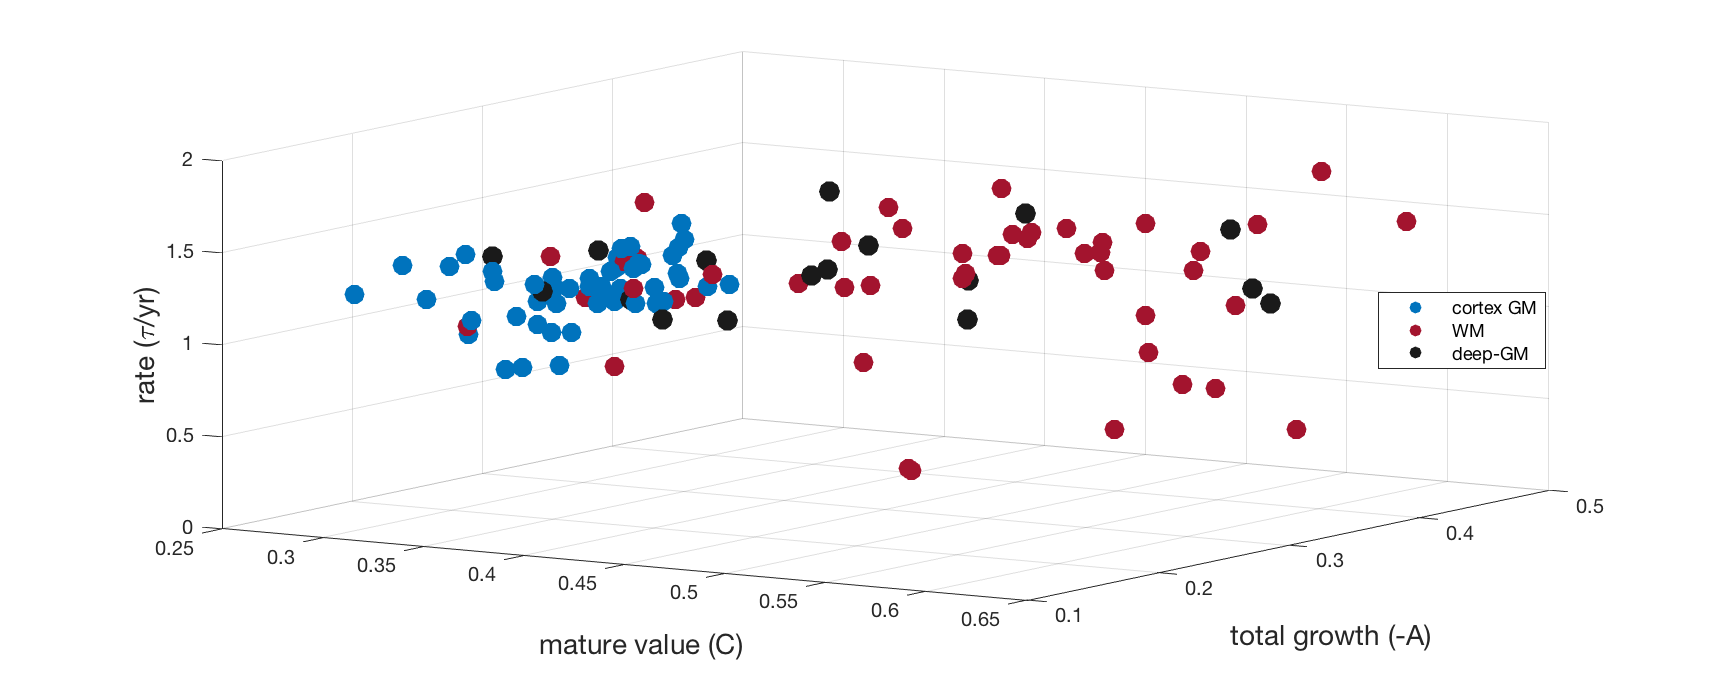
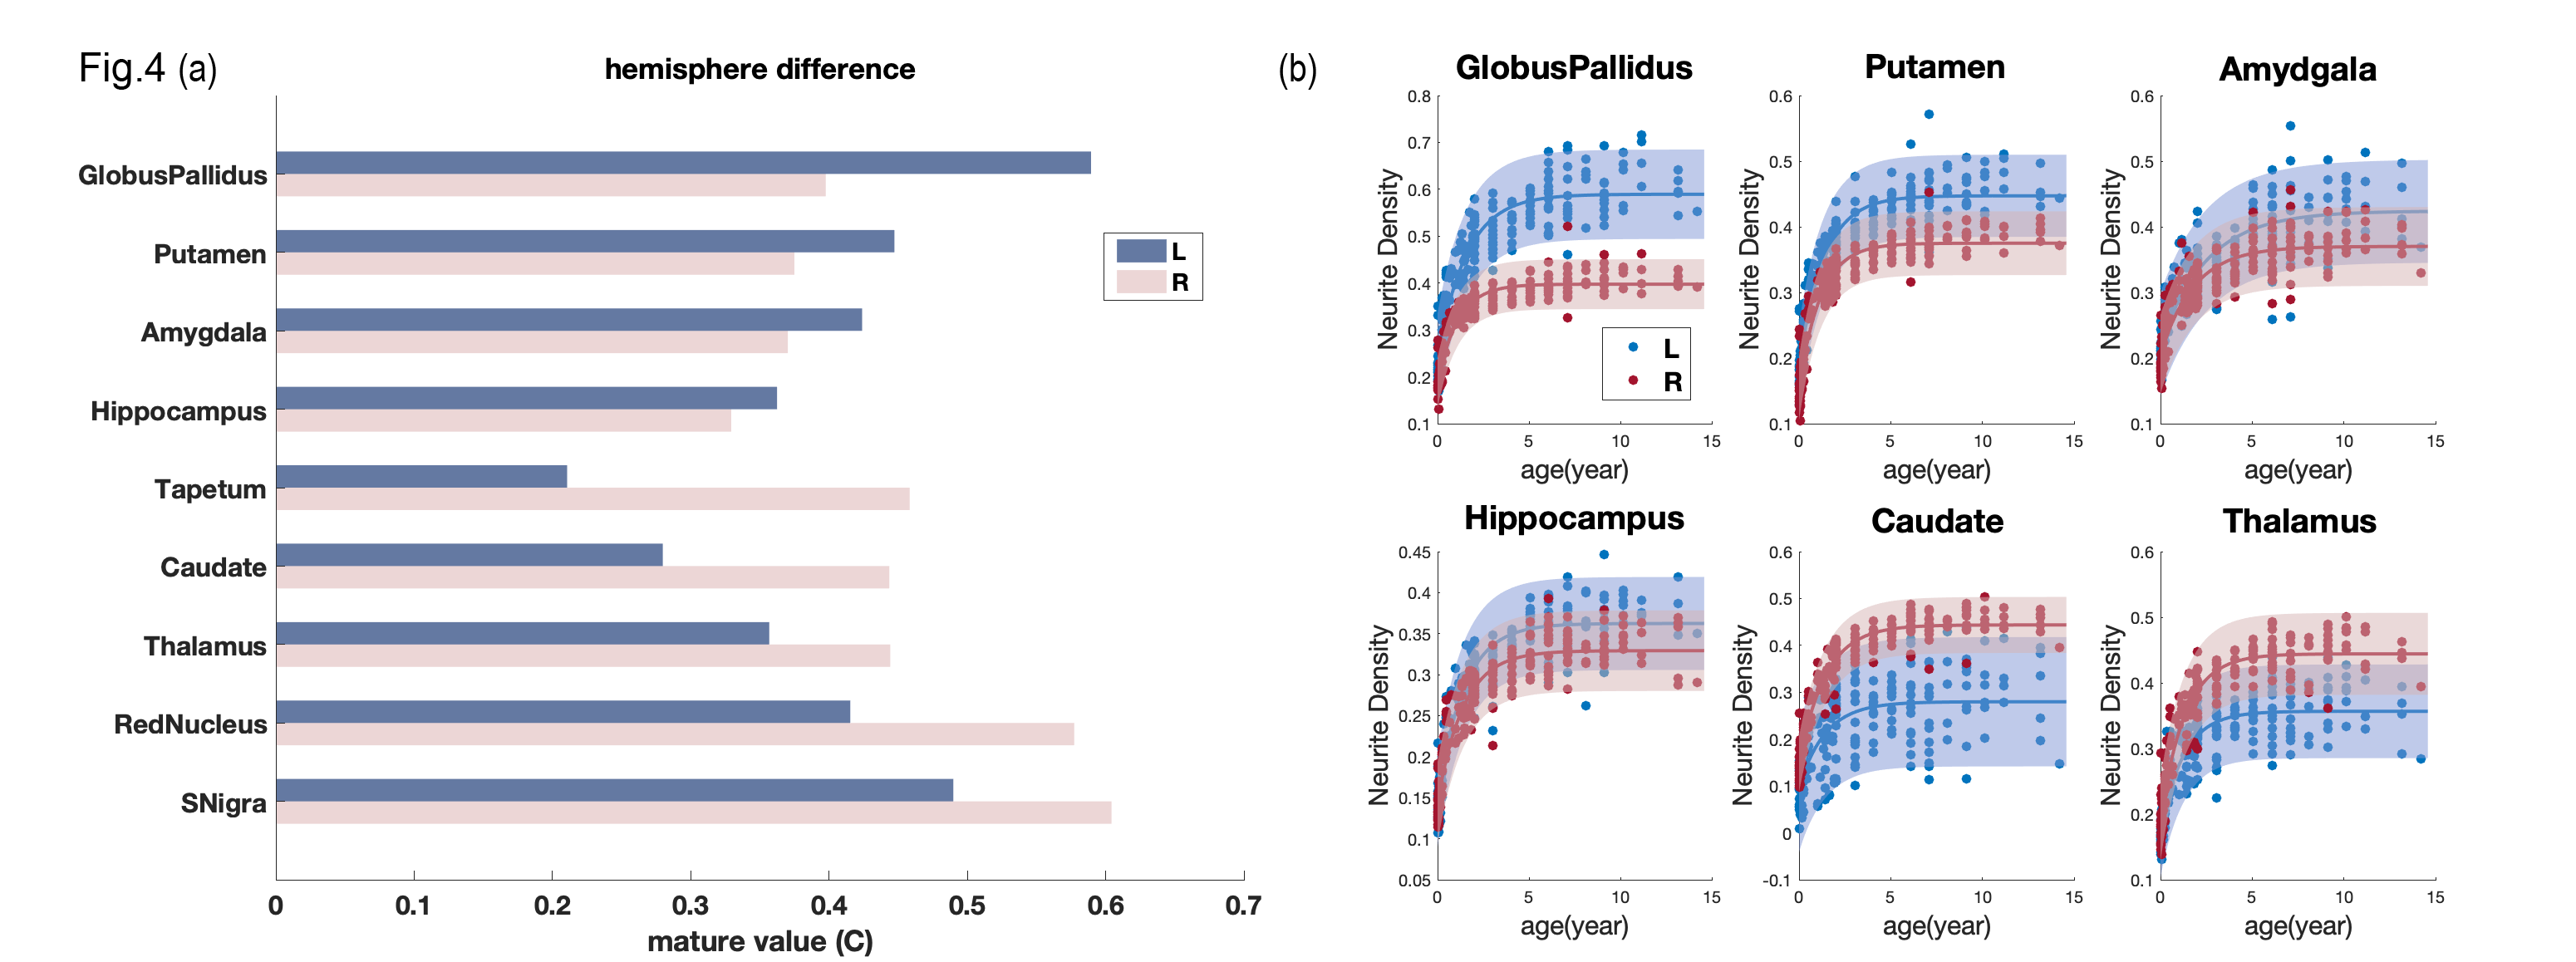
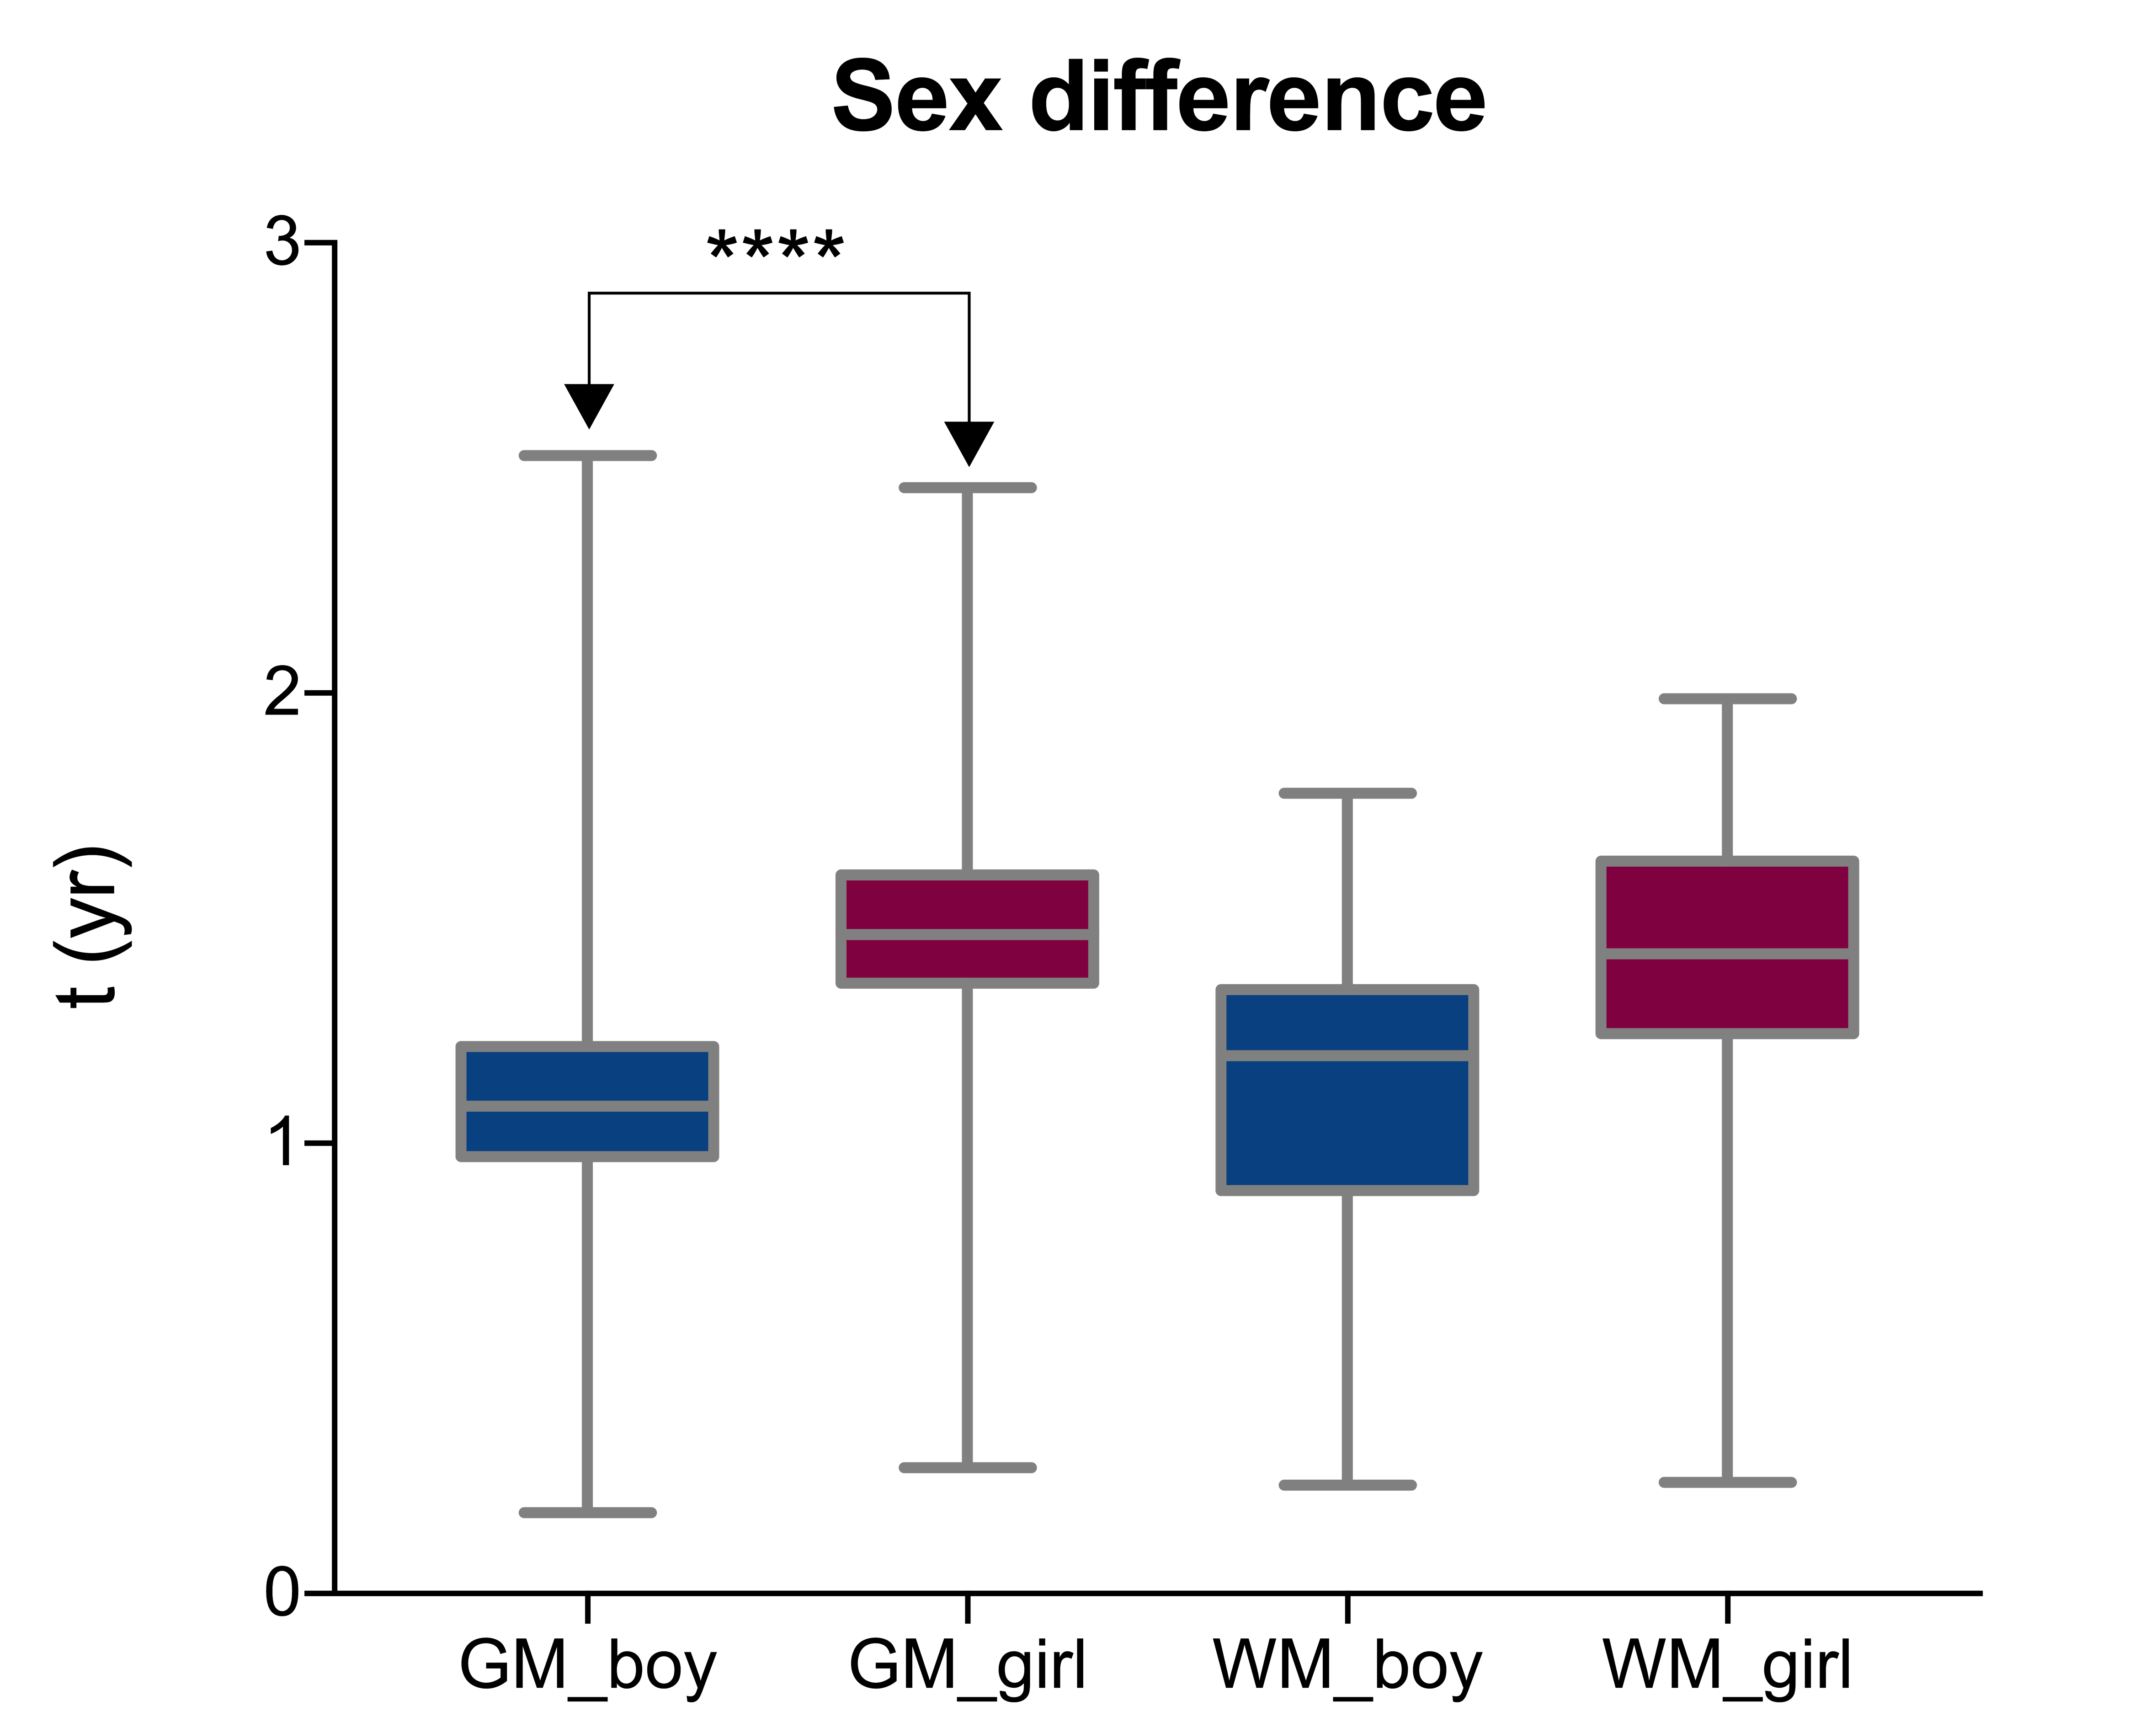
As shown in Fig. 2, ND has the highest sensitivity to age-related changes, where the average correlation coefficients over all brain regions for ND and FA are 0.703 and 0.623, respectively. Results of exponential regression were displayed in Fig.3, regions in cGM, dGM and WM were represented as scatters with coordinate ($$$C$$$, $$$-A$$$, $$$\tau$$$), and noted by different colors. cGM can be distinguished from WM with a smaller $$$C$$$ (P=1.110×10⁻¹⁶) and a smaller $$$–A$$$ (P=0). However, dGM were mixed with both cGM and WM. In deep GM, hemispheric difference was observed with regional variation (Fig. 4). ND of the left hemisphere were larger in globus pallidus, putamen, amygdala and hippocampus. Conversely, ND of the right side were larger in caudate and thalamus all along the developmental timescale. No sex difference was observed in the newborn value $$$C+A$$$ in GM (P=0.658) nor in WM (P=0.756). The mature value $$$C$$$ also showed no difference between genders, with P=0.738 in GM and P=0.279 in WM. However, statistical significance was found in time constant $$$\tau$$$ of GM (P=1.164×10⁻¹²), though no difference was seen in WM (P=0.259), as shown in the box and whiskers plot in Fig. 5.Discussion
The higher sensitivity of ND to brain development observed in our study is consistent with previous comparison studies between NODDI and DTI2,3. Also a strong correlation of cerebral neurite density with the intensity of myelin stain under light microscopy was corroborated by postmortem histology study4. This is unsurprising because ND provides information of water content from intra-cellular, which may be more associated with microstructural changes happened during development. WM underwent greater ND growth than cGM, reflecting a relative smaller occupation of myelinated axons in cGM. The hemispheric asymmetry developmental trajectories found in dGM agrees with the former research on subcortical volumes5. Sex difference was only seen in GM, the smaller $$$\tau$$$ of boys is caused by a higher ND during early development (from 0 to 5 years old under our context) in GM. We can infer that the GM of boys underwent rapid neuronal growth during early development, which may contribute to the lager neuron numbers and the well known bigger brain size of males6.Conclusion
Neurite density has shown to be a promising biomarker in brain development, with higher sensitivity than FA, especially in gray matters. Thus, NODDI can be a useful tool in brain development and aging description, as well as neurodevelopmental abnormity detection.Acknowledgements
No acknowledgement found.References
1. H. Zhang, T. Schneider, C.A. Wheeler-Kingshott, D.C. Alexander, NODDI: practical in vivo neurite orientation dispersion and density imaging of the human brain, NeuroImage, 61 (2012) 1000-1016.
2. A. Mah, B. Geeraert, C. Lebel, Detailing neuroanatomical development in late childhood and early adolescence using NODDI, PloS one, 12 (2017) e0182340.
3. S. Genc, C.B. Malpas, S.K. Holland, R. Beare, T.J. Silk, Neurite density index is sensitive to age related differences in the developing brain, NeuroImage, 148 (2017) 373-380.
4. S.N. Jespersen, C.R. Bjarkam, J.R. Nyengaard, M.M. Chakravarty, B. Hansen, T. Vosegaard, L. Østergaard, D. Yablonskiy, N.C. Nielsen, P. Vestergaard-Poulsen, Neurite density from magnetic resonance diffusion measurements at ultrahigh field: Comparison with light microscopy and electron microscopy, NeuroImage, 49 (2010) 205-216.
5. M. Dennison, S. Whittle, M. Yücel, N. Vijayakumar, A. Kline, J. Simmons, N.B. Allen, Mapping subcortical brain maturation during adolescence: evidence of hemisphere- and sex-specific longitudinal changes, Developmental Science, 16 (2013) 772-791.
6. B. Pakkenberg, H.J.G. Gundersen, Neocortical neuron number in humans: Effect of sex and age, Journal of Comparative Neurology, 384 (1997) 312-320.
Figures