3031
Age-specific Optimization Strategies of T1-weighted Image Contrasts in Infant Brain1Radiology, Children’s Hospital, Zhejiang University School of Medicine, Hangzhou, China, 2Biomedical Engineering, Zhejiang University, Hangzhou, China
Synopsis
T1-weighted images of the infant brains (≤ 1-year-old) have the inherently low and rapidly-changing contrasts. Previous optimization methods focused on the neonatal brains (≤ 1-month-old), yet the image contrasts in the rest of the infancy are more dynamic and challenging. Here we measured T1, T2 and proton density maps in 58 infant brains at 3T, and performed simulations to maximize the relative white/gray matter contrast using a centrically encoded 3D-MPRAGE sequence. We proposed differential optimization strategies for 0-3 month-old, 4-6 month-old and 7-12 month-old infants. Results demonstrated improved relative contrasts, even in 4-6 month-old infants who had nearly isointense images.
Introduction
Infant brain images are known to have low and rapidly-evolving contrasts that are challenging for anatomical definition and automated segmentation. Efforts have been made to optimize T1-weighted contrast in the neonatal brains (≤ 1-month-old) [1-4], yet the contrasts in the 1-12 month-old infants are more dynamic and complicated. Particularly, it is a worldwide challenge to segment the nearly isointense 6-month-old infant brains (http://iseg2017.web.unc.edu). Beyond the development of advanced image processing algorithms [5-8], direct improvement of native image contrast would be critical for following analyses. In addition, previous studies aimed to maximize the absolute contrast between white and gray matter (subtraction difference), which depends on intensity scaling, e.g., if the image intensity is doubled, the absolute contrast would double but the real contrast remains the same. We used a relative contrast as the optimization criteria, and employed a centric-encoding 3D-MPRAGE sequence to achieve a wide range of image contrasts. Differential optimization strategies were defined for sub-divided age groups.Methods
Relaxometry mapping: T1, T2 and proton density (PD) maps were simultaneously quantified using the vendor-preset MIX sequence [9], which used interleaved spin-echo (SE) and inversion recovery (IR) readout. The MIX sequence was performed with TRIR = 2260ms, TI = 500ms, TRSE = 1000ms, and TE = 40ms, 80ms, 120ms and 160ms.
Bloch Simulation: Two types of phase-encoding schemes were simulated for 3D-MPRAGE readout with N equally-spaced RF pulses of flip angle θ, echo spacing of τ, and inversion time of TI and delay time TD.
a) Linear-encoding. For the ith readout pulse [10]: $$$s_L^i\propto M_0\cdot(\frac{(1-\delta)(1-\mu^{i-1})}{1-\mu}+\mu^{i-1}(1-\lambda)-\lambda\cdot\mu^{i-1}\frac{M_{eq}}{M_0})\cdot\sin\theta$$$
where $$$M_{eq}=M_0\frac{1-\phi+\frac{\phi\cos\theta(1-\delta)(1-\mu^{N-1}))}{1-\mu}+\phi\cos\theta\mu^{N-1}-\rho{\cos\theta}^{N}}{1+\rho{\cos\theta}^{N}}$$$, and $$$\lambda=e^{-\frac{TI}{T1}}$$$, $$$\delta=e^{-\frac{\tau}{T1}}$$$, $$$\phi=e^{-\frac{TD}{T1}}$$$, and $$$\mu=\cos\theta$$$
b) Centric-encoding: $$$S_C\propto M_0\cdot(1-e^{-\frac{TI}{T1}}+e^{-\frac{TR}{T1}})$$$
Age-specific contrast optimization: We examined two types of contrast definitions: i) absolute contrast= SWM - SGM, and ii) relative contrast= (SWM - SGM)/ (SWM + SGM).
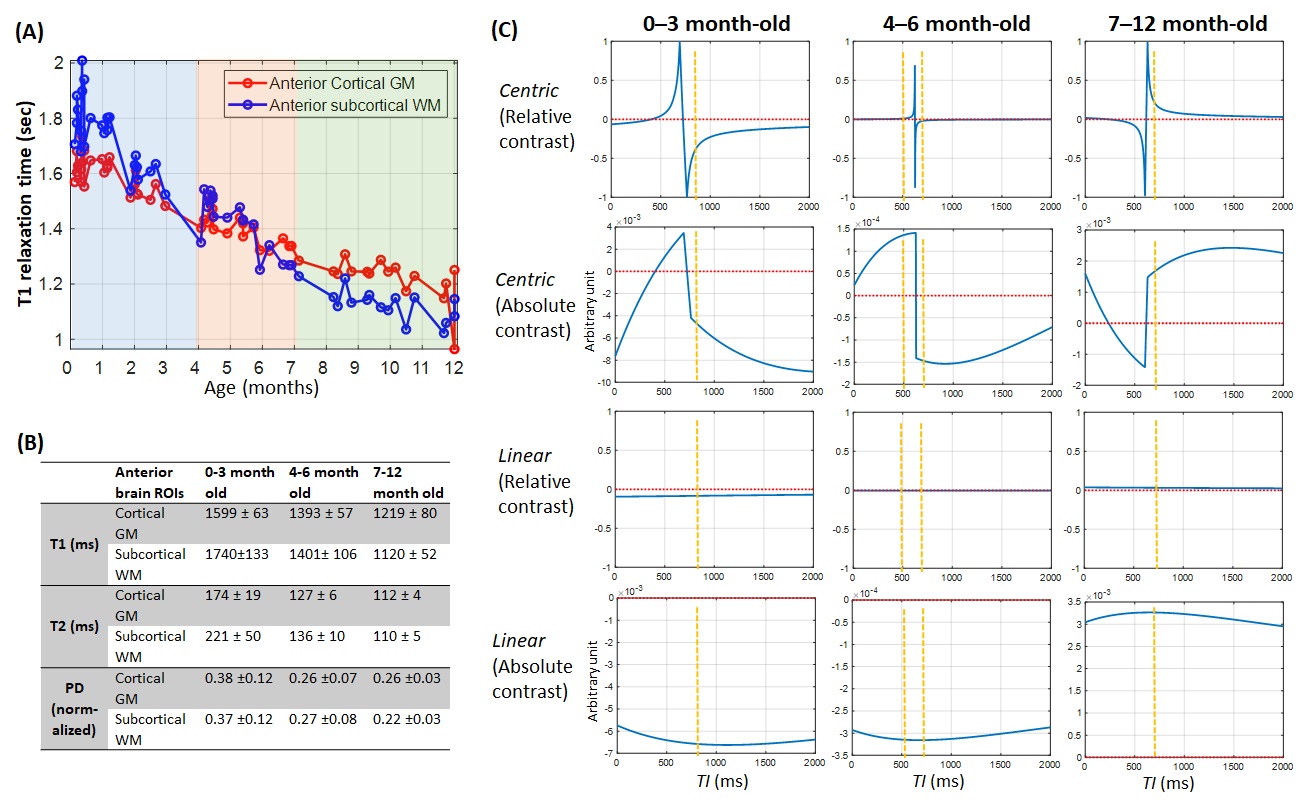
According to the T1 trajectories (Figure 2A), we defined three groups: 1) 0-3 month-old, who has negative contrast (compared to adult); 2) 4-6 month-old, who has nearly isointense contrasts; and 3) 7-12 month-old, who has positive contrast. For group 1 and 3, we identified the optimal protocols based on the TI that gave high relative contrasts; whereas for group 2, we acquired images at dual-TI that gave opposite contrasts.
Data acquisition: All experiments performed on a 3T Philips Achieva scanner. Normal term-born infants were recruited upon parental consent. T1, T2 and PD were measured in 58 infants using the MIX sequence. T1-weighted images were acquired with FOV=180*180*120 mm3, 1mm isotropic resolution, TR/TE=2000/3.7ms, θ=8°, N=120, τ=8ms, SENSE factor=2, and scan time=3.07min.
Results
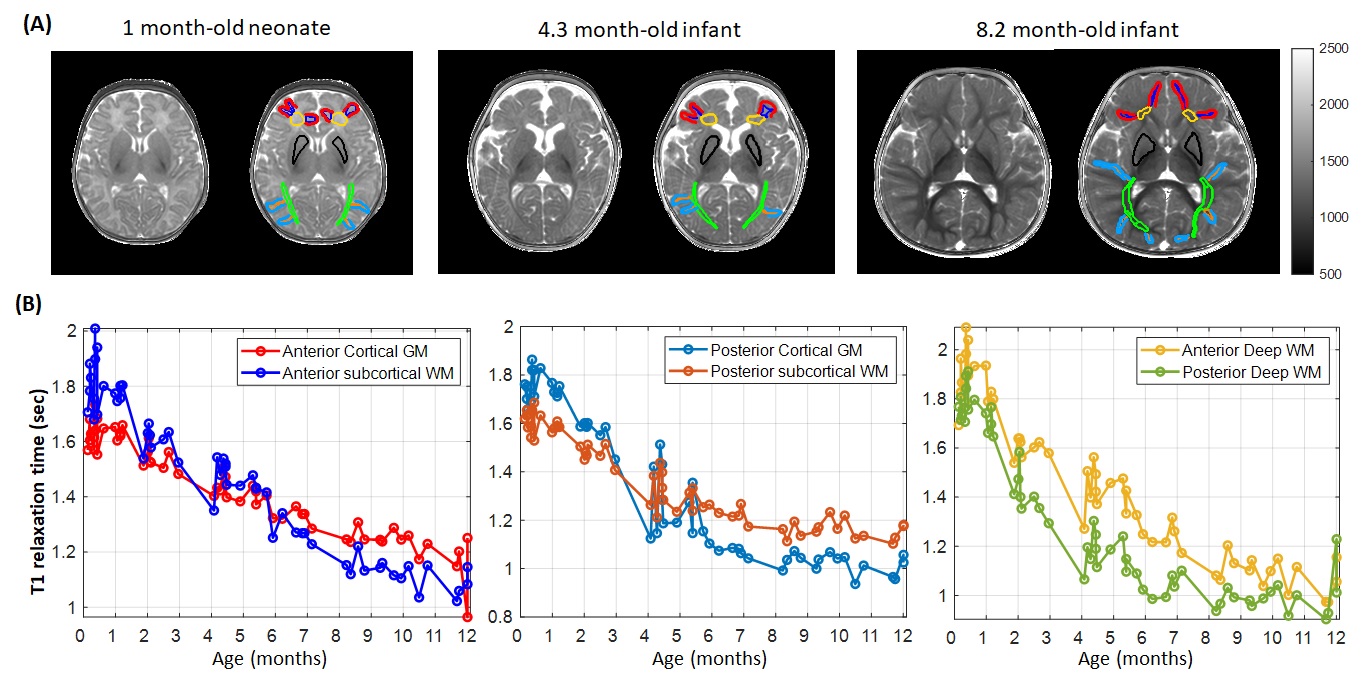
Figure 1 shows the T1 measured in manually delineated anterior and posterior WM and GM ROIs. A posterior-to-anterior, central-to-peripheral developmental gradient was observed [11-12]. PD was almost identical across the brain (data not shown). Signals were simulated using linear or centric encodings at TI between 0-2000ms, based on the relaxometry measurements in the anterior brain in three age groups (Figure 2B). For relative contrast, linear-encoding showed monotonically increasing contrasts within a narrow range, whereas centric-encoding provided a wider range with local maxima positions depending on the age groups (Figure 2C).
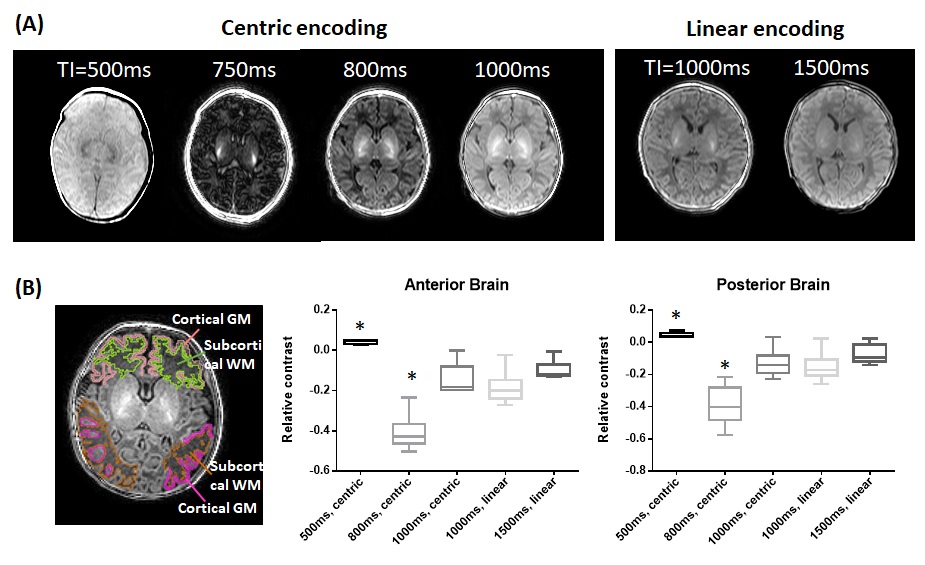
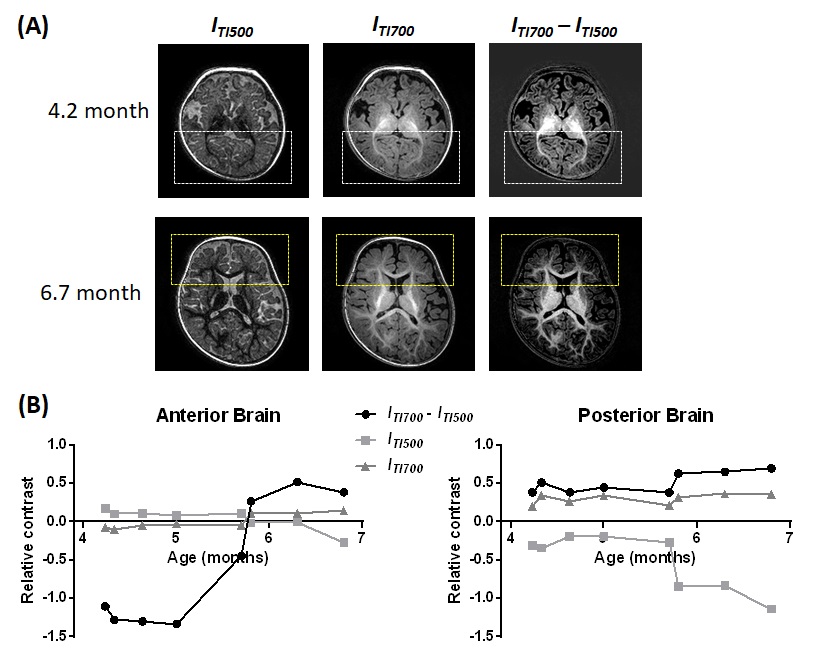
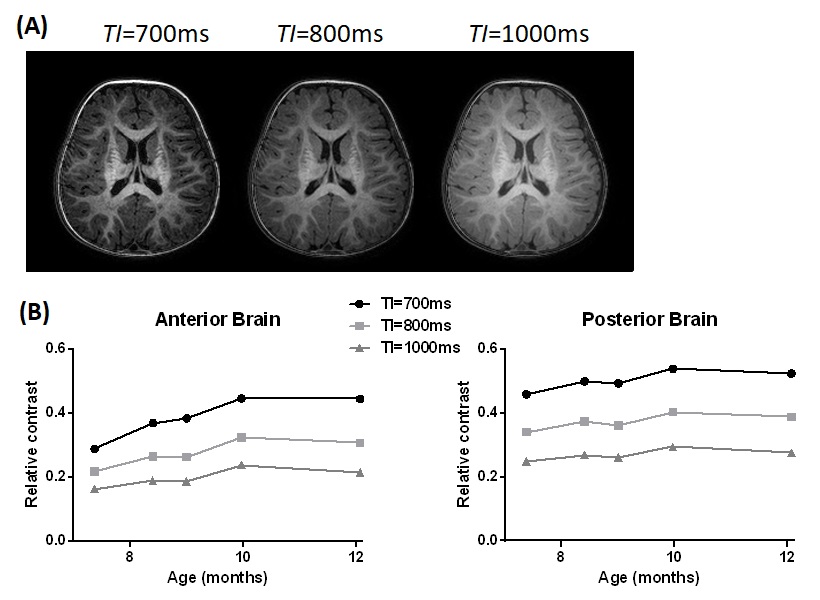
Figure 3 demonstrated that in the neonates, image contrasts can be tuned by varying TI, as predicted by the simulation, and that centric-encoding allows flexible contrasts with TI between 500-1000ms. Several protocols were compared, and centric-encoding with TI=800ms showed the highest (negative) contrast compared to the other protocols in both anterior and posterior brain (p<0.01, n=6). In 4-6 month-old infants (n=8), it is consistent that centric-encoding with TI of 500ms and 700 gave opposite contrasts (Figure 4). Relative contrast in the anterior brain was near to 0 and switched signs around 6 month-old, while the posterior brain showed low but positive contrasts. The difference image (ITI680 – ITI500) enhanced contrasts in all cases. In 7-12 month-old infants (n=5), relative contrasts was the highest with TI=700ms, agreed with the simulation (Figure 5).
Discussion and Conclusion
We demonstrated that optimizing T1-weighted contrasts in the evolving infant brains is possible, with age-specific imaging protocols. For example, TI=800ms for 0-3 month-old and TI=700ms for 7-12 month old infants were shown to achieve high contrasts, using a centrically encoded MPRAGE sequence; and that dual-TI enchanced contrasts in 4-6 month-old infants. We realize that simulation of the relative contrast offered theoretically optimal TI, but it does not take SNR into account. The absolute contrast could be used to infer SNR (if scaled by noise), and therefore, the two can be used together to decide the optimal protocol. Our next step is to see whether the improved contrast improves segmentation accuracy, e.g., whether the dual contrasts in 4-6 month-old infants help segmentation of those isointense images. The proposed strategies could be potentially facilitate routine clinical practice of infant brain MRI.Acknowledgements
This work is made possible by NSFC support (61801424).References
1. Williams LA, DeVito TJ, Winter JD, Orr TN, Thompson RT, Gelman N. Optimization of 3D MP-RAGE for neonatal brain imaging at 3.0 T. Magnetic resonance imaging 2007;25(8):1162-1170.
2. He LL, Wang JH, Lu ZL, Kline-Fath BM, Parikh NA. Optimization of magnetization-prepared rapid gradient echo (MP-RAGE) sequence for neonatal brain MRI. Pediatr Radiol 2018;48(8):1139-1151.
3. Nossin-Manor R, Chung AD, Morris D, Soares-Fernandes JP, Thomas B, Cheng HLM, Whyte HEA, Taylor MJ, Sled JG, Shroff MM. Optimized T1-and T2-weighted volumetric brain imaging as a diagnostic tool in very preterm neonates. Pediatr Radiol 2011;41(6):702-710.
4. Wang JH, He LL, Zheng HR, Lu ZL. Optimizing the Magnetization-Prepared Rapid Gradient-Echo (MP-RAGE) Sequence. Plos One 2014;9(5).
5. Nie D, Wang L, Gao YZ, Shen DG. Fully Convolutional Networks for Multi-Modality Isointense Infant Brain Image Segmentation. I S Biomed Imaging 2016:1342-1345.
6. Wang L, Shi F, Yap PT, Lin WL, Gilmore JH, Shen DG. Longitudinally Guided Level Sets for Consistent Tissue Segmentation of Neonates (vol 34, pg 956, 2013). Hum Brain Mapp 2013;34(7):1747-1747.
7. Devi CN, Chandrasekharan A, Sundararaman VK, Alex ZC. Neonatal brain MRI segmentation: A review. Computers in Biology and Medicine 2015;64:163-178.
8. Wang L, Shi F, Yap PT, Gilmore JH, Lin WL, Shen DG. 4D Multi-Modality Tissue Segmentation of Serial Infant Images. Plos One 2012;7(9).
9. In den Kleef JJ, Cuppen JJ. RLSQ: T1, T2, and rho calculations, combining ratios and least squares. Magnetic resonance in medicine 1987;5(6):513-524.
10. Gowland PA, Leach MO. Fast and accurate measurements of T1 using a multi-readout single inversion-recovery sequence. Magnetic resonance in medicine 1992;26(1):79-88.
11. Oishi K, Mori S, Donohue PK, Ernst T, Anderson L, Buchthal S, Faria A, Jiang HY, Li X, Miller MI, van Zijl PCM, Chang LD. Multi-contrast human neonatal brain atlas: Application to normal neonate development analysis. Neuroimage 2011;56(1):8-20.
12. Dubois J, Hertz-Pannier L, Dehaene-Lambertz G, Cointepas Y, Le Bihan D. Assessment of the early organization and maturation of infants' cerebral white matter fiber bundles: a feasibility study using quantitative diffusion tensor imaging and tractography. Neuroimage 2006;30(4):1121-1132.
Figures