3028
Characterization of neurobiochemical profiles in the neonates using GABA-edited Multi-voxel MR spectroscopy1University of California, San Francisco, CA, United States
Synopsis
This study evaluated neurobiochemical profiles in 11 neonates using GABA-edited MR spectroscopy.
Introduction
Proton (H-1) MR spectroscopy is a powerful method for non-invasively investigating brain metabolism. The newborn brain is relatively immature and has much less neuronal activity compared with the adult brain. The changes in metabolic profile that occur as the brain matures can be quantified by MRS. The purpose of this study was to evaluate neurobiochemical profiles in the neonates using GABA-edited MR spectroscopy (1).Methods
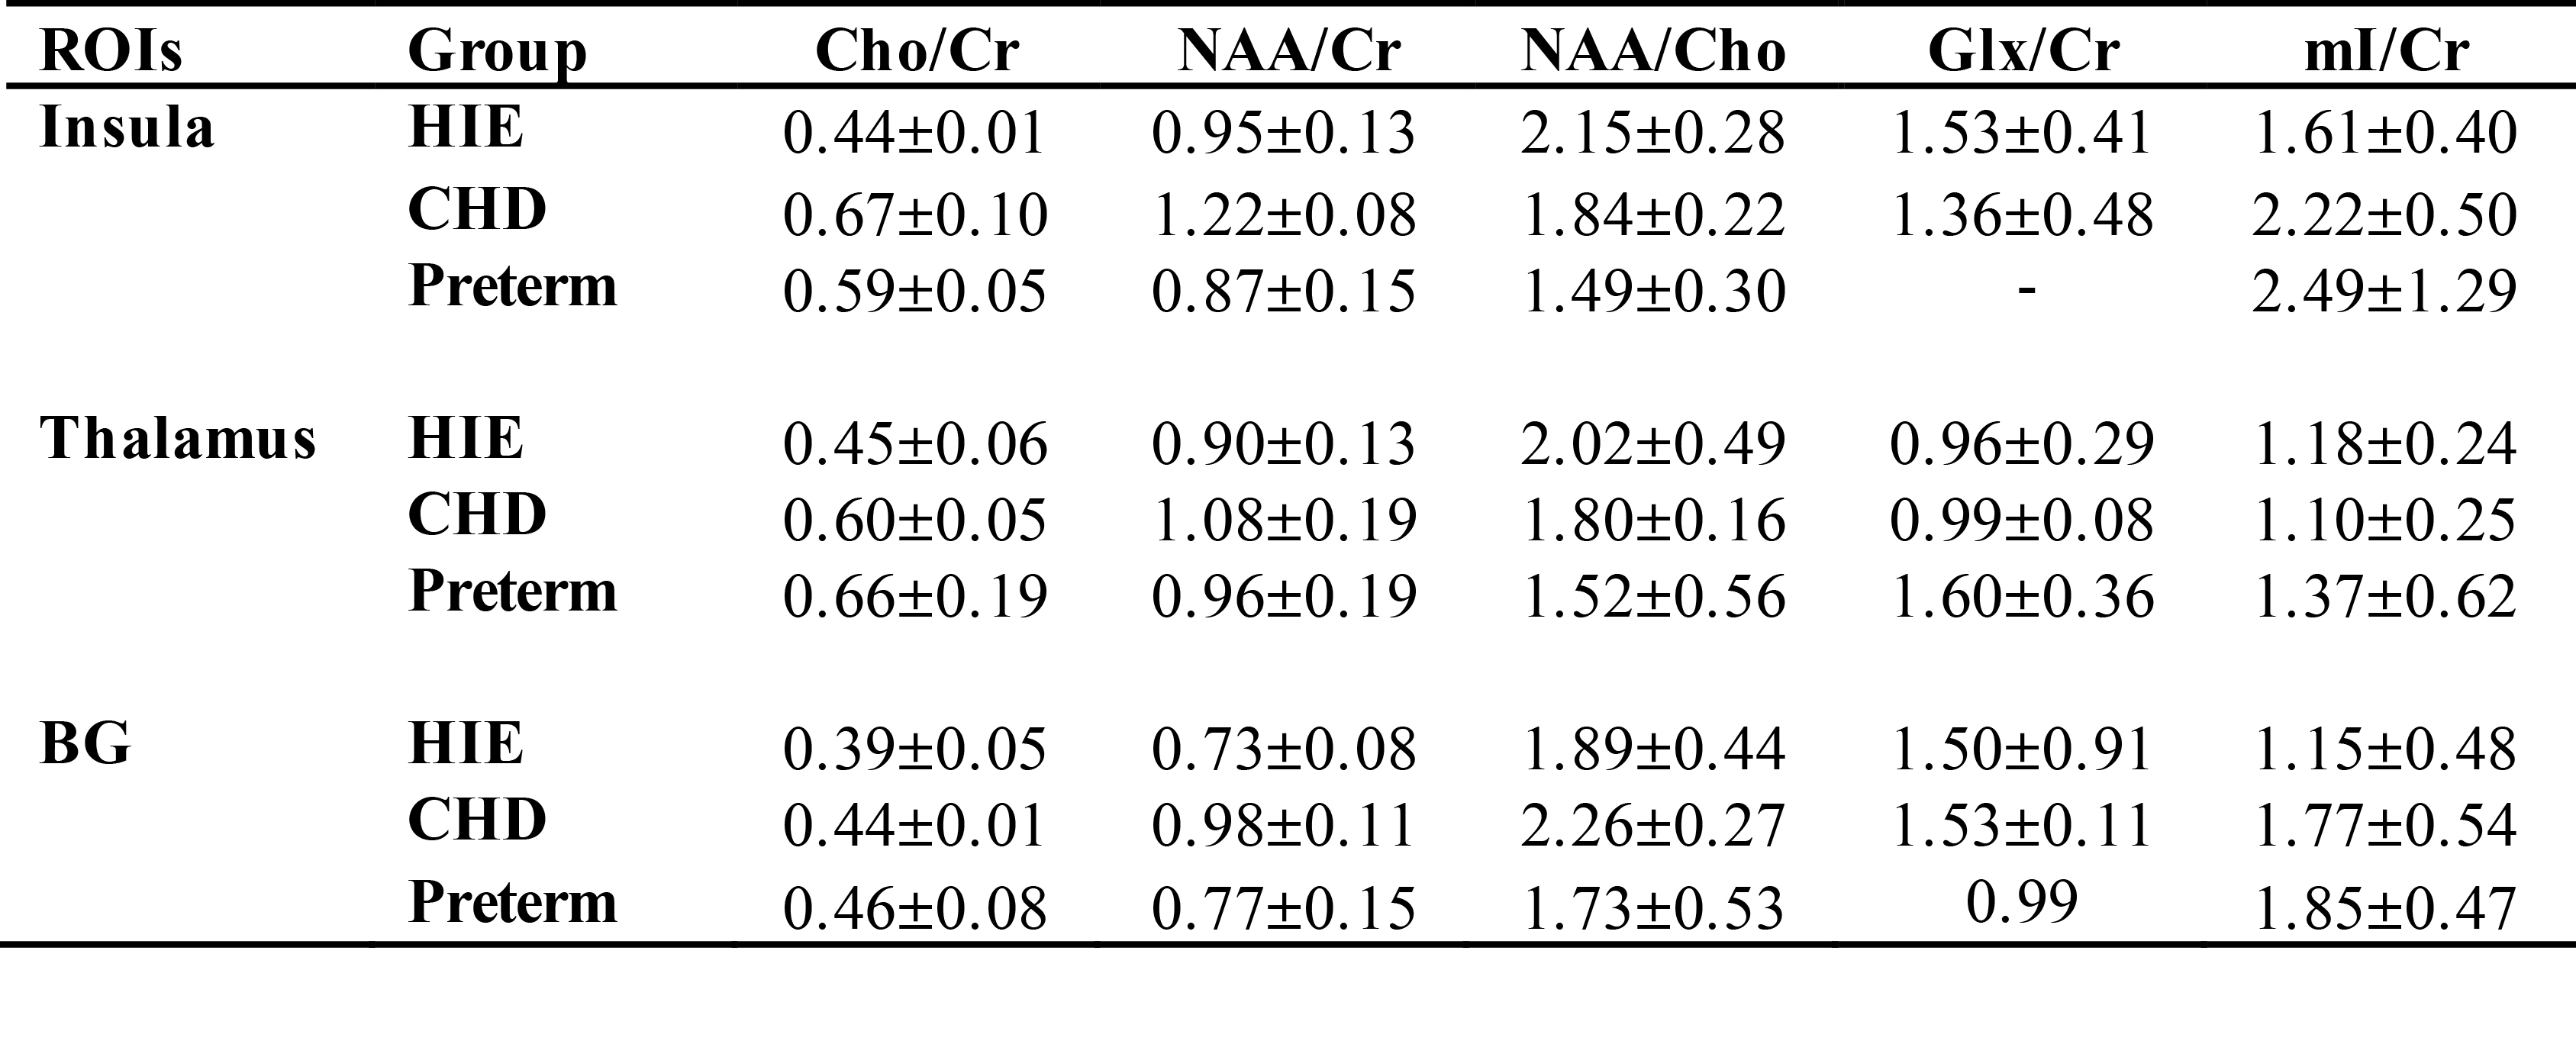
Patient population consists of 5 term neonates with hypoxic ischemic encephalopathy (HIE) at the median age of 4 days [range, 4-5 days], 3 neonates with congenital heart defects (CHD) at the median age of 20 days [5-35 days], and 3 preterm infants (Preterm) at the median corrected gestational age of 36w5d [30w0d – 38w6d]. The MR data were acquired from 3 T scanner (GE Healthcare Technologies, Waukesha, WI) using 8 channel phased array head coil. The 2D H-1 GABA-edited MRSI data were obtained using PRESS volume selection, VSS outer volume suppression and CHESS water suppression with a TE/TR = 68/1500 ms, matrix = 8x8, spatial resolution = 1x1x1 cm3, NEX=2, and total acquisition = 6.5 minutes. The editing pulse was applied symmetrically to the resonance of water. The non-edited spectra were processed and quantified using methods described previously. The difference spectra, the subtraction of edited from non-edited spectra, after phase and frequency corrections will be quantified by using LCModel (2), which will utilize a basis-set generated by individual metabolite phantoms. Regions of interest (ROIs) include basal ganglia (caudate, putamen and globus pallidum), thalamus and insula (Figure 1).Results
An example of 2D GABA-edited MRSI is illustrated in Figure 1. Table 1 summarize the relative metabolite ratios for each ROI quantified from non-edited spectra. Among 3 patient population, the preterm has the lowest Cho/NAA and highest value of mI/Cr in the BG and thalamus. The median ratios of GABA/NAA within the deep brain were 0.50±0.07 in the HIE and 0.72±0.19 in the CHD, respectively.Discussion
The changes in metabolic profile that occur as the brain matures can be quantified by MRS. NAA is initially lower relative to other metabolites and its rate of increase has been shown to correlate with the maturation process (3). Lower NAA/Cho has been observed in different regions of the brain for preterm compared to term infants using 3D MRSI (4). This is consistent with our finding from non-edited spectra. During the period from preterm to term, mI/Cho has been shown to decrease (5), which could explain the difference on mI/Cr among groups. Glu (excitatory) and GABA (inhibitory) are the main neurotransmitters in the mature brain. However, GABA acts as an important excitatory mediator on brain development (6, 7). Recently, it is also reported that neonates had significantly lower in vivo brain GABA+ levels than children in both the BG and cerebellum (8). Relatively high GABA/NAA was found in the regions of deep brain structures in our study, which can be due to lower concentration of NAA in our patient population and clinical status. Currently we are collecting the clinical measurements and will correlate them with neurochemical profiles. Considering relatively low SNR of GABA, we will also combine the voxels within the ROIs first and then quantify the averaged spectra.Conclusion
We have found different brain metabolism within the deep brain structures in the term neonates with HIE, CHD and the preterm.Acknowledgements
This research was supported by NIH R21HD092660 and P01NS082330.References
1. Li Y, Bian W, Larson P, Crane JC, Parvathaneni P, Nagarajan S, Nelson SJ. Reliable and Reproducible GABA Measurements Using Automated Spectral Prescription at Ultra-High Field. Front Hum Neurosci. 2017;11:506. Epub 2017/11/10. doi: 10.3389/fnhum.2017.00506. PubMed PMID: 29118697; PMCID: PMC5661373.
2. Provencher SW. Estimation of metabolite concentrations from localized in vivo proton NMR spectra. Magn Reson Med. 1993;30(6):672-9. Epub 1993/12/01. PubMed PMID: 8139448.
3. Kreis R, Hofmann L, Kuhlmann B, Boesch C, Bossi E, Huppi PS. Brain metabolite composition during early human brain development as measured by quantitative in vivo 1H magnetic resonance spectroscopy. Magn Reson Med. 2002;48(6):949-58. Epub 2002/12/05. doi: 10.1002/mrm.10304. PubMed PMID: 12465103.
4. Vigneron DB, Barkovich AJ, Noworolski SM, von dem Bussche M, Henry RG, Lu Y, Partridge JC, Gregory G, Ferriero DM. Three-dimensional proton MR spectroscopic imaging of premature and term neonates. AJNR Am J Neuroradiol. 2001;22(7):1424-33. Epub 2001/08/11. PubMed PMID: 11498441.
5. Roelants-van Rijn AM, van der Grond J, Stigter RH, de Vries LS, Groenendaal F. Cerebral structure and metabolism and long-term outcome in small-for-gestational-age preterm neonates. Pediatr Res. 2004;56(2):285-90. Epub 2004/06/08. doi: 10.1203/01.PDR.0000132751.09067.3F. PubMed PMID: 15181199.
6. Ben-Ari Y. [GABA, a key transmitter for fetal brain maturation]. Med Sci (Paris). 2007;23(8-9):751-5. Epub 2007/09/19. doi: 10.1051/medsci/20072389751. PubMed PMID: 17875295.
7. Owens DF, Kriegstein AR. Is there more to GABA than synaptic inhibition? Nat Rev Neurosci. 2002;3(9):715-27. Epub 2002/09/05. doi: 10.1038/nrn919. PubMed PMID: 12209120.
8. Tomiyasu M, Aida N, Shibasaki J, Umeda M, Murata K, Heberlein K, Brown MA, Shimizu E, Tsuji H, Obata T. In vivo estimation of gamma-aminobutyric acid levels in the neonatal brain. NMR Biomed. 2017;30(1). Epub 2016/11/20. doi: 10.1002/nbm.3666. PubMed PMID: 27859844; PMCID: PMC5216898.
Figures