3025
R2* relaxation rate of white matter in neonates and correlation with clinical predictors of hypoxic ischemic encephalopathy1Children’s Hospital of Chongqing Medical University, Chongqing, China, 2UBC MRI Research Centre, University of British Columbia, Vancouver, BC, Canada
Synopsis
Objective: To evaluate the potential correlation between the clinical predictors of hypoxic ischemic encephalopathy (HIE) and R2* relaxation rate, and the correlation between R2* and radial diffusivity (RD), axial diffusivity (AD). Methods: We obtained mean R2*, RD and AD within the whole white matter of 19 term infants with clinical diagnosis of HIE and 12 healthy controls. Results: R2*, RD and AD did not differ significantly between the healthy controls and infants with HIE. R2* did not associate with the clinical predictors of HIE. Reduced R2* was correlated with increased RD and AD. Conclusion: R2*, RD and AD do not show a clear relationship with clinically defined HIE.
Introduction
Diffuse excessive high signal intensity (DEHSI) is a term used by radiologists to describe abnormally bright appearing white matter on T2-weighted images of premature infants at term-equivalent age.1,2 It has been proposed to represent diffuse periventricular white matter injury, 3–6 but the histological correlations remain unclear. There has been some debate as to whether DEHSI is correlated with poorer developmental outcomes in later childhood. 7–9
Diffuse
white matter hyperintensity also can be observed in term infants with
hypoxic ischemic
encephalopathy (HIE)10,
which is likely due to an increased tissue water content, and may be
a consequence of injury or some kind of change in cells. 11
Diffuse white matter hyperintensity remains a challenging issue in terms of definition, as its detection on T2-weighted images is subjective and has low inter- and intra-observer agreement. 12,13 R2* relaxation is a by-product of multi-echo susceptibility-weighted images (SWI), and is a semi-quantitative magnetic resonance technique that is strongly influenced by iron and myelin content in adults and tissue water content in infants. 14 Diffusion tensor imaging (DTI) is sensitive to microstructural changes, radial diffusivity (RD) and axial diffusivity (AD) were reported to be associated with myelin and/or axonal abnormality. 15-17
In the current study, we investigated the potential use of R2* relaxation as a sensitive measurement of diffuse white matter hyperintensity in term infants with or without HIE, and to determine if there is any correlation between HIE clinical predictors and R2* relaxation rates. We evaluated the difference of RD and AD between the healthy controls and infants with HIE, and the correlation between R2* relaxation rate and RD, AD to investigate if RA and AD are associated with clinically defined HIE.
Methods
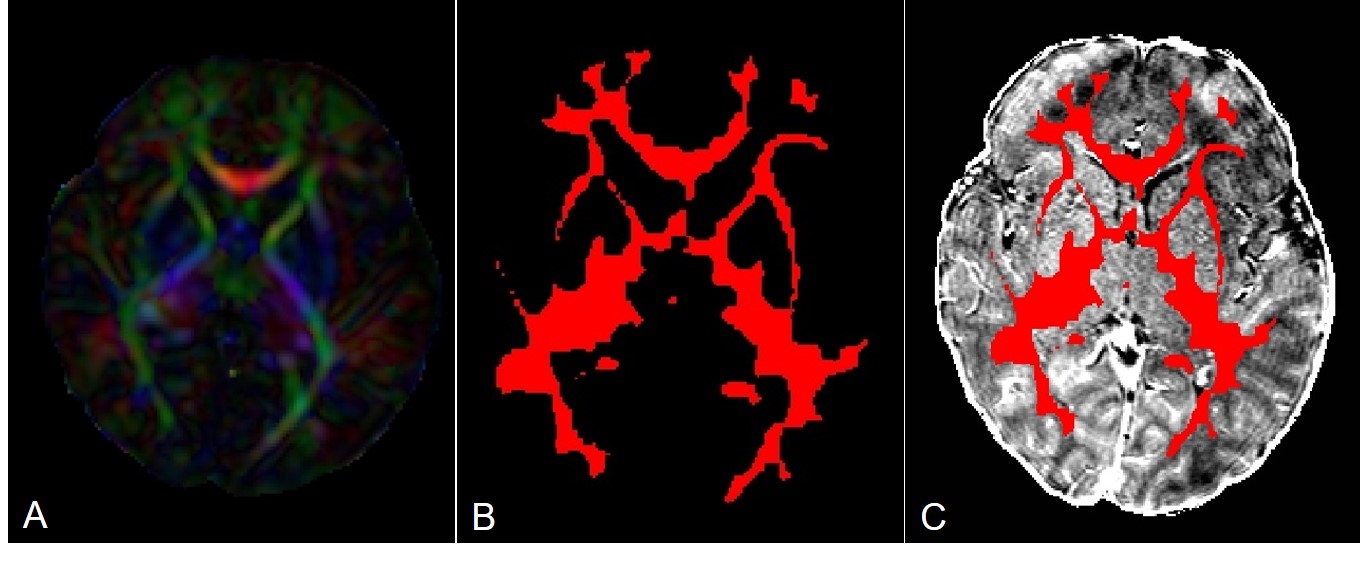
We obtained T2-weighted, DTI, and multi-echo SWI of 19 term infants with clinical diagnosis of HIE and 12 healthy controls. Apart from diffuse white matter hyperintensity seen on T2-weighted scans, there were no other signal abnormalities found on conventional MRI, along with and no microbleeds detected on SWI. DTI data were linearly registered to the R2* maps by linearly registering FA maps to the SWI magnitude images. FA maps were also used for tissue segmentation using FSL’s FAST. The obtained WM masks were eroded using a 3-voxel 2D kernel (Fig 1). For quantitative assessments of diffuse white matter hyperintensity, mean R2* values, RD and AD within the whole white matter of all 31 term infants were acquired.Results
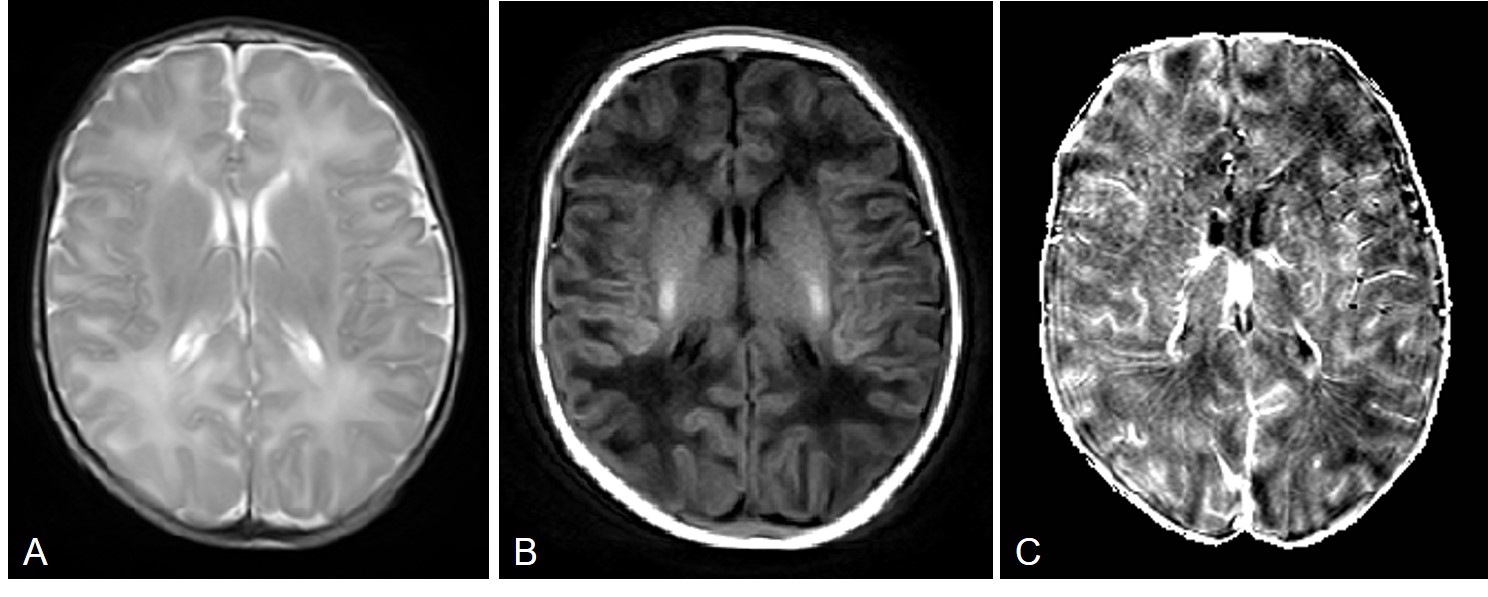
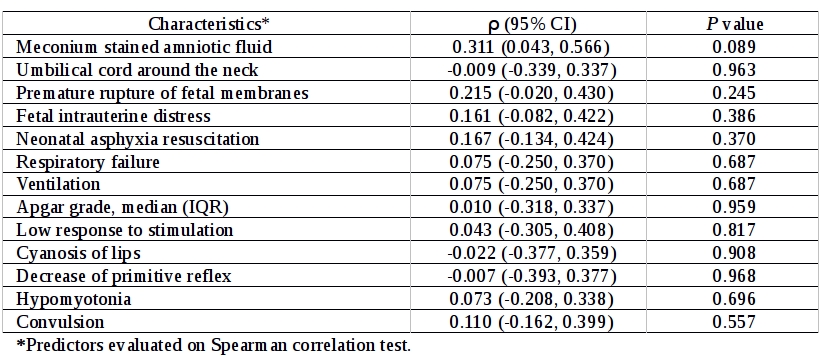
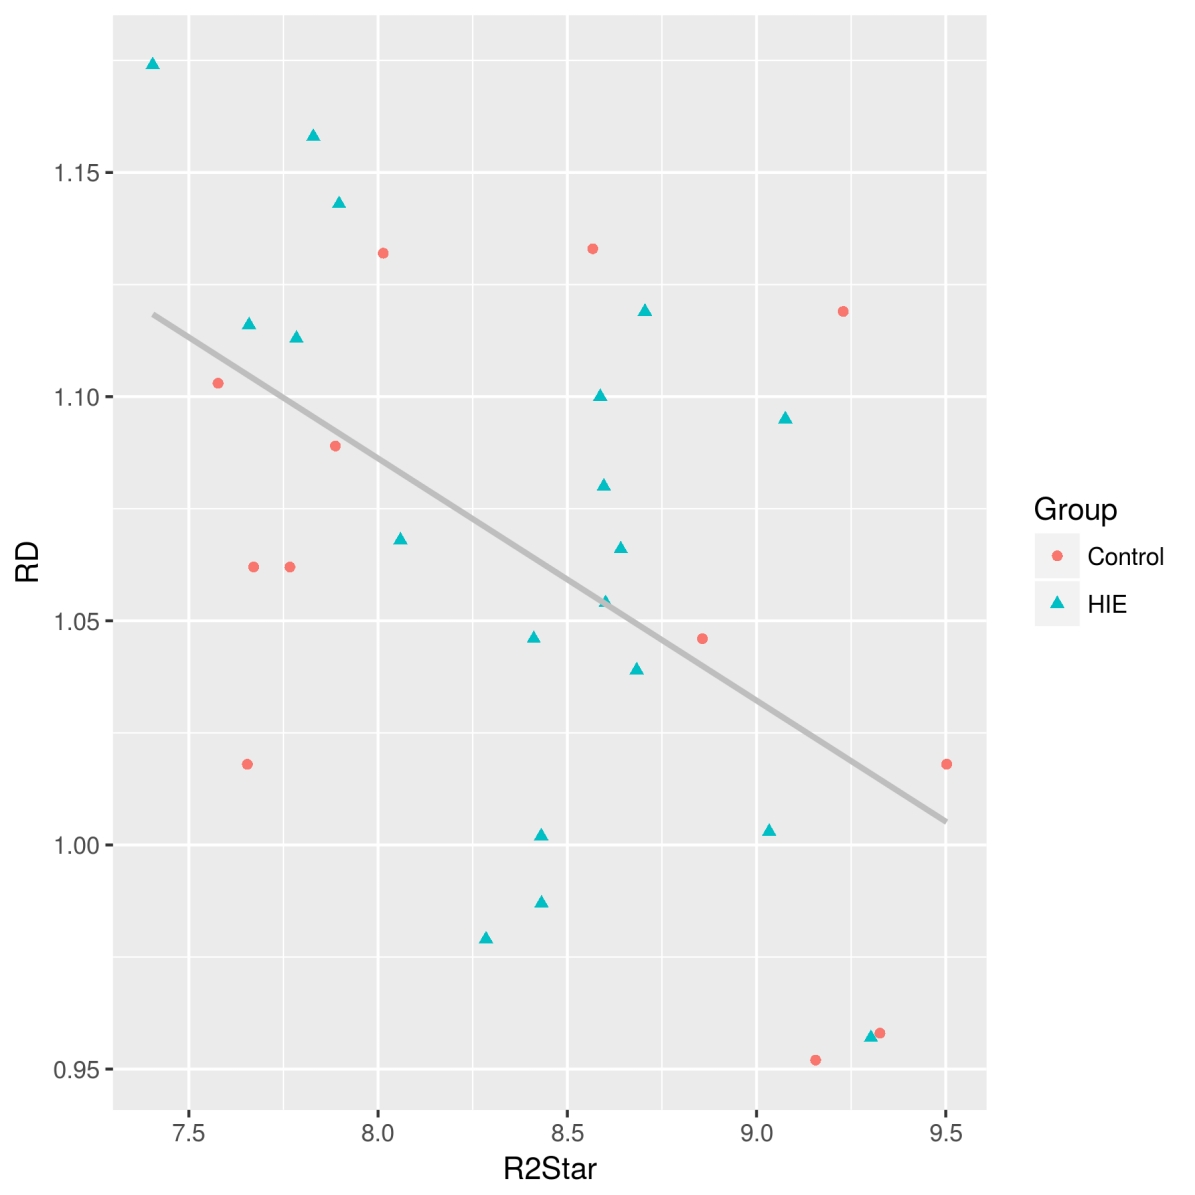
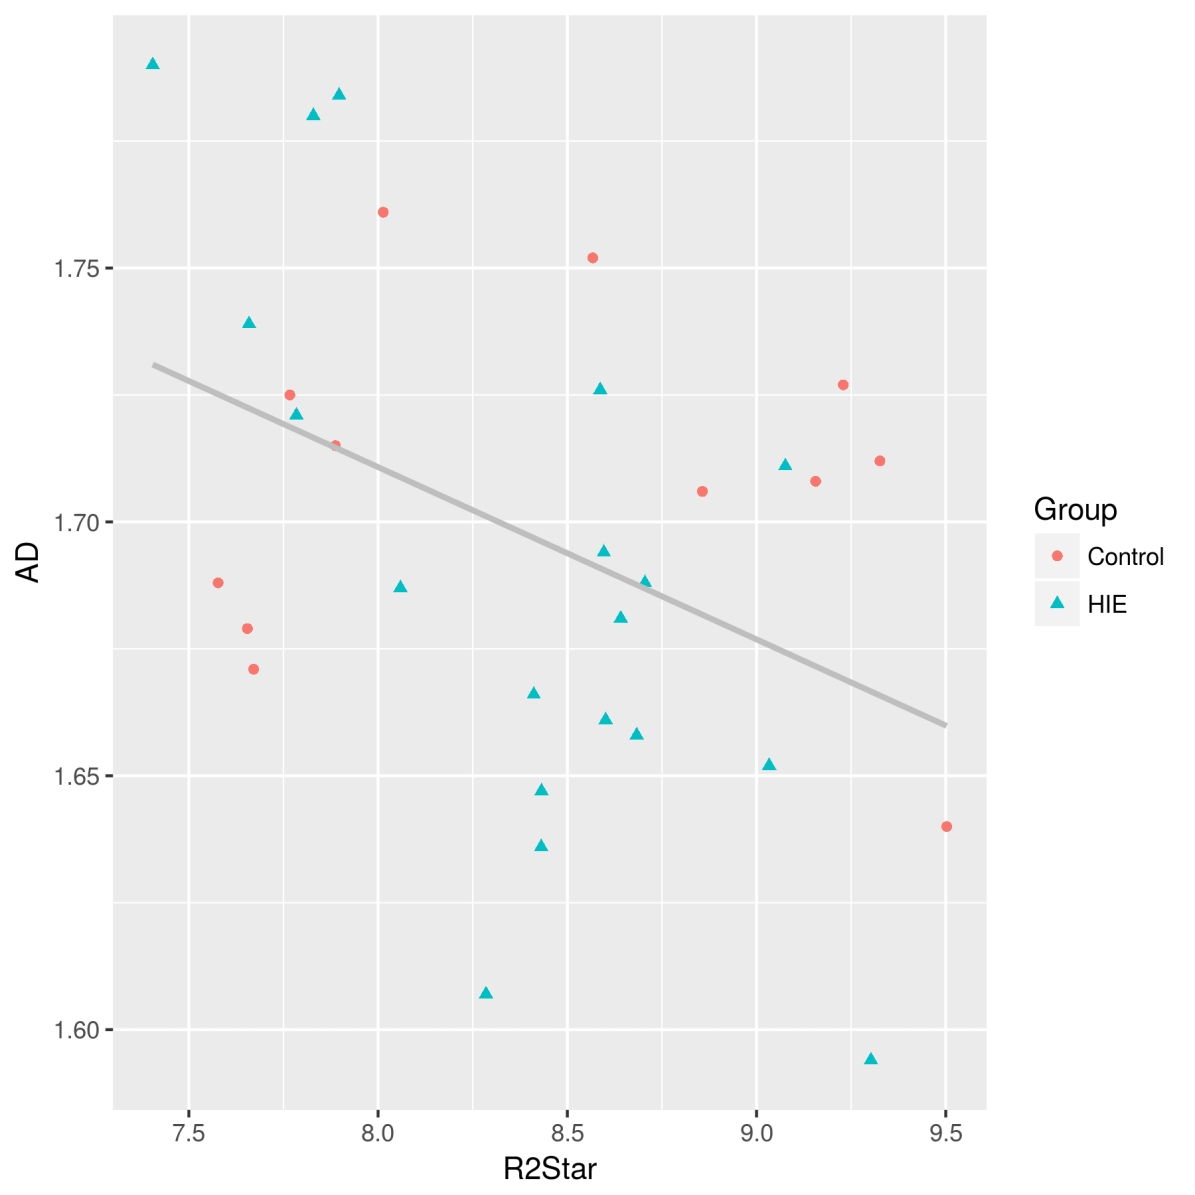
Diffuse white matter hyperintensity on T2-weighted images correlated with reduced R2* values, as expected (Fig 2). No statistically significant difference of mean R2* values, RD and AD within the whole white matter between the healthy controls and infants with HIE were found (t = 0.178, p = 0.861; t = -0.465, p = 0.646; t = 0.906, p = 0.372). Infants with reduced R2* relaxation rate can be observed in both groups, and did not associate with the clinical predictors of HIE (Fig 3). Reduced R2* was correlated with increased RD (r = -0.526, p < 0.01) and AD (r= -0.417, p < 0.05) both in the healthy controls and infants with HIE (Fig 4, Fig 5).Discussion
Whether or not diffuse white matter hyperintensity can be used as a possible indicator of diffuse white matter injury still requires long-term cohort studies to establish. Baud et al. 18 used a rat model of gestational hypoxia to produce a milder white matter injury, which showed an increase in ADC values, as found in DEHSI. 19 At histology, the white matter of these rat pups showed increased numbers of activated microglia.
Focal white matter hyperintensities are easy to see, while diffuse white matter hyperintensity is difficult to identify, since there is less contrast. The data R2* are easily acquired on most modern clinical MRI scanners and they also provide the added bonus of detecting microbleeds using SWI. 20 The reduced R2* in infants with diffuse white matter hyperintensity is likely due to do an increased tissue water content. Unfortunately there is no histological correlate for edema, as water is likely removed in the fixation process.21
Reduced R2* was correlated with increased RD and AD, but the increased RD and AD did not associate with clinically defined HIE, and may not be proposed as a possible indicator of diffuse white matter injury in term infants with HIE.
Conclusion
R2* relaxation rate, RD and AD do not show any relationship with clinically defined HIE. R2* relaxation is a sensitive detection and quantification method of white matter hyperintensities in MRI, and will be of interest to see if there is any correlation with future developmental outcomes.Acknowledgements
No acknowledgement found.References
1. MRI of the neonatal brain. (Saunders, 2003).
2. Maalouf, E. F. et al. Magnetic resonance imaging of the brain in a cohort of extremely preterm infants. J. Pediatr. 135, 351–357 (1999).
3. Back, S. A., Riddle, A. & McClure, M. M. Maturation-dependent vulnerability of perinatal white matter in premature birth. Stroke 38, 724–730 (2007).
4. Gilles, F. H. & Gomez, I.-G. Developmental neuropathology of the second half of gestation. Early Hum. Dev. 81, 245–253 (2005).
5. Counsell, S. J. et al. Diffusion-weighted imaging of the brain in preterm infants with focal and diffuse white matter abnormality. Pediatrics 112, 1–7 (2003).
6. Counsell, S. J., Rutherford, M. A., Cowan, F. M. & Edwards, A. D. Magnetic resonance imaging of preterm brain injury. Arch. Dis. Child. Fetal Neonatal Ed. 88, F269-274 (2003).
7. Woodward, L. J., Anderson, P. J., Austin, N. C., Howard, K. & Inder, T. E. Neonatal MRI to predict neurodevelopmental outcomes in preterm infants. N. Engl. J. Med. 355, 685–694 (2006).
8. de Bruïne, F. T. et al. Clinical implications of MR imaging findings in the white matter in very preterm infants: a 2-year follow-up study. Radiology 261, 899–906 (2011).
9. Parikh, N. A., Lasky, R. E., Kennedy, K. A., McDavid, G. & Tyson, J. E. Perinatal factors and regional brain volume abnormalities at term in a cohort of extremely low birth weight infants. PLoS ONE 8, e62804 (2013).
10. Rutherford, M. et al. Assessment of brain tissue injury after moderate hypothermia in neonates with hypoxic-ischaemic encephalopathy: a nested substudy of a randomised controlled trial. Lancet Neurol 9, 39–45 (2010).
11. Parikh, N. A., Pierson, C. R. & Rusin, J. A. Neuropathology Associated With Diffuse Excessive High Signal Intensity Abnormalities on Magnetic Resonance Imaging in Very Preterm Infants. Pediatr. Neurol. 65, 78–85 (2016).
12. Morel, B., Antoni, G., Teglas, J. P., Bloch, I. & Adamsbaum, C. Neonatal brain MRI: how reliable is the radiologist’s eye? Neuroradiology 58, 189–193 (2016).
13. Morel, B. et al. A challenging issue: Detection of white matter hyperintensities in neonatal brain MRI. Conf Proc IEEE Eng Med Biol Soc 2016, 93–96 (2016).
14. Yablonskiy, D. A. & Haacke, E. M. Theory of NMR signal behavior in magnetically inhomogeneous tissues: the static dephasing regime. Magn Reson Med 32, 749–763 (1994).
15. Song, S.-K. et al. Dysmyelination revealed through MRI as increased radial (but unchanged axial) diffusion of water. Neuroimage 17, 1429–1436 (2002).
16. Song, S.-K. et al. Diffusion tensor imaging detects and differentiates axon and myelin degeneration in mouse optic nerve after retinal ischemia. Neuroimage 20, 1714–1722 (2003).
17. Song, S.-K. et al. Demyelination increases radial diffusivity in corpus callosum of mouse brain. Neuroimage 26, 132–140 (2005).
18. Baud, O. et al. Gestational hypoxia induces white matter damage in neonatal rats: a new model of periventricular leukomalacia. Brain Pathol. 14, 1–10 (2004).
19.
Counsell, S. J. et al. Axial and radial diffusivity in preterm
infants who have diffuse white matter changes on magnetic resonance
imaging at term-equivalent age. Pediatrics 117, 376–386
(2006).
20. Denk, C. & Rauscher, A. Susceptibility weighted imaging with multiple echoes. J Magn Reson Imaging 31, 185–191 (2010).
21.
Thavarajah, R., Mudimbaimannar, V. K., Elizabeth, J., Rao, U. K. &
Ranganathan, K. Chemical and physical basics of routine formaldehyde
fixation. J Oral Maxillofac Pathol 16, 400–405
(2012).
Figures