3023
MRI quantitative assessment of neonatal hyperbilirubin brain damage1Department of Radiology, XIAN XD GROUP HOSPITAL, XIAN, China, 2GE Healthcare China, beijing, China, 3Baoji Municipal Central Hospital, baoji, China, 4Baoji Municipal Central Hospital, Baoji, China, 5XIAN XD GROUP HOSPITAL, XIAN, China
Synopsis
Neonatal hyperbilirubinemia (NHB) is a common clinical disease and can cause bilirubin encephalopathy in severe cases,which may lead to serious sequelae such as hearing impairment, visual abnormality and mental retardation in children. Quantitatively evaluating the degree of brain damage in neonates with hyperbilirubinemia is of great significance for the prognosis of neonates.In this study, T1 value was measured in different brain regions of newborns with different serum bilirubin levels using T1 mapping, a new magnetic resonance imaging technology of 3.0T.The threshold value of T1 in neonates with bilirubin brain injury was obtained.It provides the quantitative reference index of neonatal hyperbilirubin brain damage for clinic.
Introduction
Bilirubin encephalopathy often lacks specific symptoms and is easy to be missed during the warning period, which makes treatment often lag behind1,2.Hyperbilirubinemia in some "healthy children" is likely to be overtreated, so it is far from sensitive to the diagnosis of bilirubin encephalopathy based solely on clinical symptoms and serum bilirubin levels, and it is impossible to detect the neurotoxic effects of bilirubin in the early reversible stage of treatment3,4.T1 mapping technique was used to measure T1 value of different brain region with different bilirubin levels in neonates5-7. Therefore, the threshold value of hyperbilirubin brain injury is obtained, which provides a quantitative reference index for the early prevention and treatment of neonatal bilirubin brain damage8.
Methods
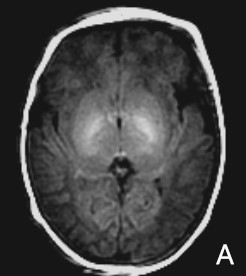
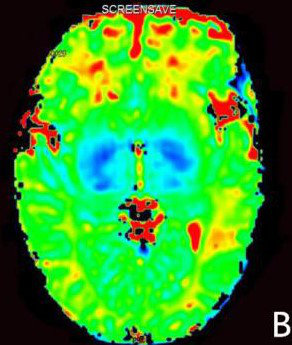
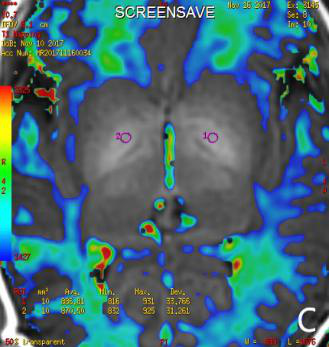
The study protocol was reviewed and approved by the Institutional Review Board and written informed consent was obtained from all participants prior to enrollment in the study. 63 neonates were collected and divided into 3 groups according to the level of serum bilirubin : 20 cases of physiologic jaundice neonates(TSB<221μmol/L),28 cases of hyperbilirubinemia neonates(TSB≥342μmol/L), and 15 cases of bilirubin encephalopathy neonates(TSB≥428μmol/L),and performed T1WI and T1 mapping imaging respectively. T1 mapping uses 6 different inversion time (TI), which are 200ms, 400ms, 600ms, 800ms, 1000ms and 1200ms respectively, with imaging time of 6 min.The GE AW4.6 post-processing workstation software was used to process the image to obtain the fusion map of T1WI and T1mapping.The bilateral globus pallidus, putamen nucleus, thalamus and the posterior limb of the internal capsule(PLIC) were selected as the region of interest(ROI), T1 values were measured respectively, and comparing the differences in brain regions between groups.The correlation between T1 values and serum bilirubin level was analyzed.Results
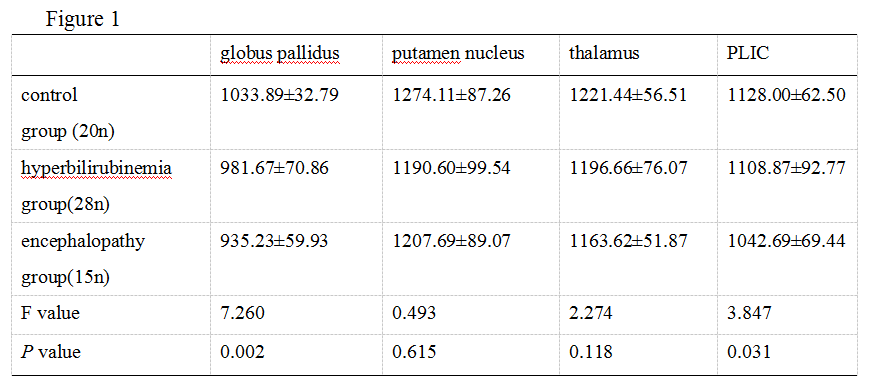
The T1 values of globus pallidus and PLIC in three group were respectively(1033.89±32.79)ms,(981.67±70.86)ms,(935.23±59.93)ms and (1128.00±62.50)ms,(1108.87±92.77)ms,(1042.69±69.44)ms.There were statistically significant differences between the three groups in T1 value of the globus pallidus and PLIC respectively(P =0.002 and P=0.031).The threshold value of T1 of globus pallidus and PLIC were respectively 935ms and 1042ms. There was no significant difference in T1 value between putamen nucleus and thalamus among groups(P >0.05).T1 value of globus pallidus and PLIC was negatively correlated with serum bilirubin level(r=-0.439, P=0.007 and r=-0.342, P=0.038).Discussion
The results showed that globus pallidus and PLIC were the vulnerable sites of bilirubin encephalopathy.This may be because the blood-brain barrier function in the neonatal period is not yet perfect, the basal ganglia nerve cells have high physiological and biochemical metabolism, high oxygen consumption and energy demand9,10.Therefore, hyperselective deposition of serum bilirubin in basal ganglia leads to its neurotoxic effect.Secondly, the correlation analysis showed that T1 value of the globus pallidus and PLIC was negatively correlated with serum bilirubin level.It is possible that a large amount of bilirubin deposited in the basal ganglia will affect the precession frequency of the surrounding protons, resulting in shortened relaxation time of T1 and reduced value of T111-13.Conclusions
The occurrence of bilirubin encephalopathy should be highly guarded when T1 value of globus pallidus of hyperbilirubinemia neonates is less than 935ms and T1 value of PLIC is less than 1042ms.T1 value of globus pallidus and PLIC was negatively correlated with serum total bilirubin level.Acknowledgements
I would like to thank my beloved mentor professor Ren Zhuanqin for his guidance and instruction on my study and life.
I would like to thank professor Wei Xiaocheng of GE for his thoughtful guidance and instruction in the subject design and abstract writing.
Thank my family for giving me academic support, life care and spiritual power!
References
[1]Manchanda S,Prasad A,Baruah B P.MRI findings in kernicterus[J]. Indian J Pediatr,2013,80( 2) : 181-182.
[2]Wisnowski J L,Panigrahy A,Painter M J,et al. Magnetic resonance imaging of bilirubin encephalopathy: current limitations and future promise[J].Semin Perinatol,2014,38( 7) : 422-428.
[3] Sari S,Yavuz A,Batur A,et al. Brain magnetic resonance imaging and magnetic resonance spectroscopy findings of children with kernicterus[J].Pol J Radiol,2015,11( 80) : 72-80.
[4] Watchko J F,Painter M J,Panigrahy A.Quantitative ADC in bilirubin encephalopathy[J].Jpn J Radiol,2013,31 ( 4) :299-300.
[5] Vrenken H,Jeroen J,et al. Whole-Brain T1 Mapping in Multiple Sclerosis: Global Changes of Normal-appearing Gray and White Matter [J]. Radiology,2006,240(3):811-820.
[6] Niepel G,Paul T,et al. Deep gray matter and fatigue in MS: a T1 relaxation time study[J]. J Neurol ,2006,253(13):896-902.
[7] Salerno M,Kramer CM. Advances in parametric mapping with CMR imaging[J]. JACC Cardiovasc Imaging,2013,6(7):806-822.
[8] Ding Y,Rao SX,Zhu T,et al. Liver fibrosis staging using T1 mapping on gadoxetic acid-enhanced MRI compared with DW imaging[J]. Clin Radiol,2015,70(10):1098-1103.
[9] Ruifang Y,Dongming H,et al. Diagnostic value of conventional MRI combined with DTI for neonatal hyperbilirubinemia [J]. Pediatr Neonatol,2017,8(3):1-7.
[10] Wisnowski JL, Panigrahy A, Painter MJ, Watchko JF. Magnetic resonance imaging abnormalities in advanced acute bilirubin encephalopathy highlight dentato-thalamo-cortical pathways[J] . J Pediatr 2016,174(3):260-263.
[11] Shah B,Anderson SW,Scalera J,et al. Quantitative MR imaging: physical principles and sequence design in abdominal imaging[J]. Radiogragphics,2011,31(3):867-880.
[12] Kim SG,Hu X,Ugurbil K.Accurate T1 determination from inversion recovery imaging:Application to human brain at 4 Tesla.Magn reson Med,1994,31(4):445-449.
[13] Coolen BF, Poot DH, Liem MI, et al. Threedimensional quantitative T1 and T2 mapping of the carotid artery: sequence design and in vivo feasibility [J]. Magn Reson Med, 2016,75(3):1008-1017.
Figures