3020
Monozygotic twin differences in structural connectivity networks underlying Autism Spectrum Disorder (ASD) symptom severity1Melbourne School of Psychological Sciences, University of Melbourne, Melbourne, Australia, 2Developmental Imaging, Clinical Sciences Theme, Murdoch Children's Research Institute, Melbourne, Australia, 3Developmental Imaging, Clinical Sciences Theme, Murdoch Children’s Research Institute, Melbourne, Australia, 4Neuroscience research, Murdoch Children’s Research Institute, Melbourne, Australia, 5Department of Neurosurgery, The Royal Children’s Hospital, Melbourne, Australia, 6Centre for Molecular and Medical Research, Deakin University Medical School, Melbourne, Australia, 7Department of Paediatrics, University of Melbourne, Melbourne, Australia
Synopsis
Neurodevelopmental abnormalities in autism spectrum disorders (ASD) have yet to be reliably identified. Recent work suggests that a likely roadblock is the high degree of subject-specific variation in ASD. We previously implemented a validated network analysis method that identified an atypical functional network underlying individual differences in ASD symptom severity. Here we applied the same approach cross-modally to investigate the association between intra-pair differences in structural connectivity networks and within-twin-pair differences in ASD symptom severity in monozygotic twins. A single structural subnetwork was identified with similar hubs implicating the salience and face-perception networks in severity of social deficits in ASD.
Introduction
Due to the heterogeneity in phenotypic expression of Autism Spectrum Disorders (ASD), the neurobiology of the condition remains poorly defined with highly inconsistent neuroimaging findings across multiple studies1. We recently applied a novel method that identified atypical functional subnetworks as predictors of intra-pair ASD symptom severity that were replicated across multiple cohorts2. If previous model-selected functional network features were indeed putative markers of ASD, we expect the same features to be represented independently in structural connectivity networks underlying ASD. To investigate this, we examined within-twin-pair differences in structural networks in monozygotic twins concordant or discordant for ASD.Methods
Participants and data acquisition
Twelve monozygotic twins concordant or discordance for ASD were recruited (age range, 5 to 18 years). ASD symptom severity was measured with the Social Responsiveness Scale (SRS-2)3. MRI data was acquired on a 3Tesla MRI scanner with a 32-channel head coil. A multi-echo MPRAGE sequence was used to acquire T1-weighted images (TR/ TE / TI = 2530/ 1.77, 3.51, 5.32, 7.20 / 1260ms, flip angle = 7.0 deg, voxel size = 0.9 mm3 isotropic, FOV = 230mm). Multi-band multi-shell diffusion-weighted imaging (DWI) data was acquired (b=2800, 2000, 1000 s/mm2, interleaved b=0 s/mm2, MB factor=3). A pair of b=0 s/mm2 images with reversed phase-encoded polarity were obtained to correct for susceptibility-induced EPI distortion.
Data preprocessing and FOD modelling
DWI preprocessing included sequentially for: Gaussian data denoising, Gibbs ringing removal, motion and eddy current distortion correction, susceptibility-induced EPI distortion correction, and b1 bias field correction. Fibre orientation distributions (FOD) were computed using the Multi-shell Multi-tissue Constrained Spherical Deconvolution model (MSMT-CSD) for white matter, gray matter and CSF4,5.
Structural connectome building
Whole brain tractogram was reconstructed per subject, using the iFOD-2 and probabilistic tracking algorithm (2 million streamlines) based on Anatomically-Constrained Tractography6 and Spherical-deconvolution Informed Filtering of Tractograms (SIFT2)7 to reduce reconstruction biases. Connectome nodes were parcellated based on the Desikan-Killiany atlas8, with edges defined in the resulting 84 x 84 adjacency matrix as weighted streamline counts representing the sum of SIFT2 track weights.
PNMF network decomposition
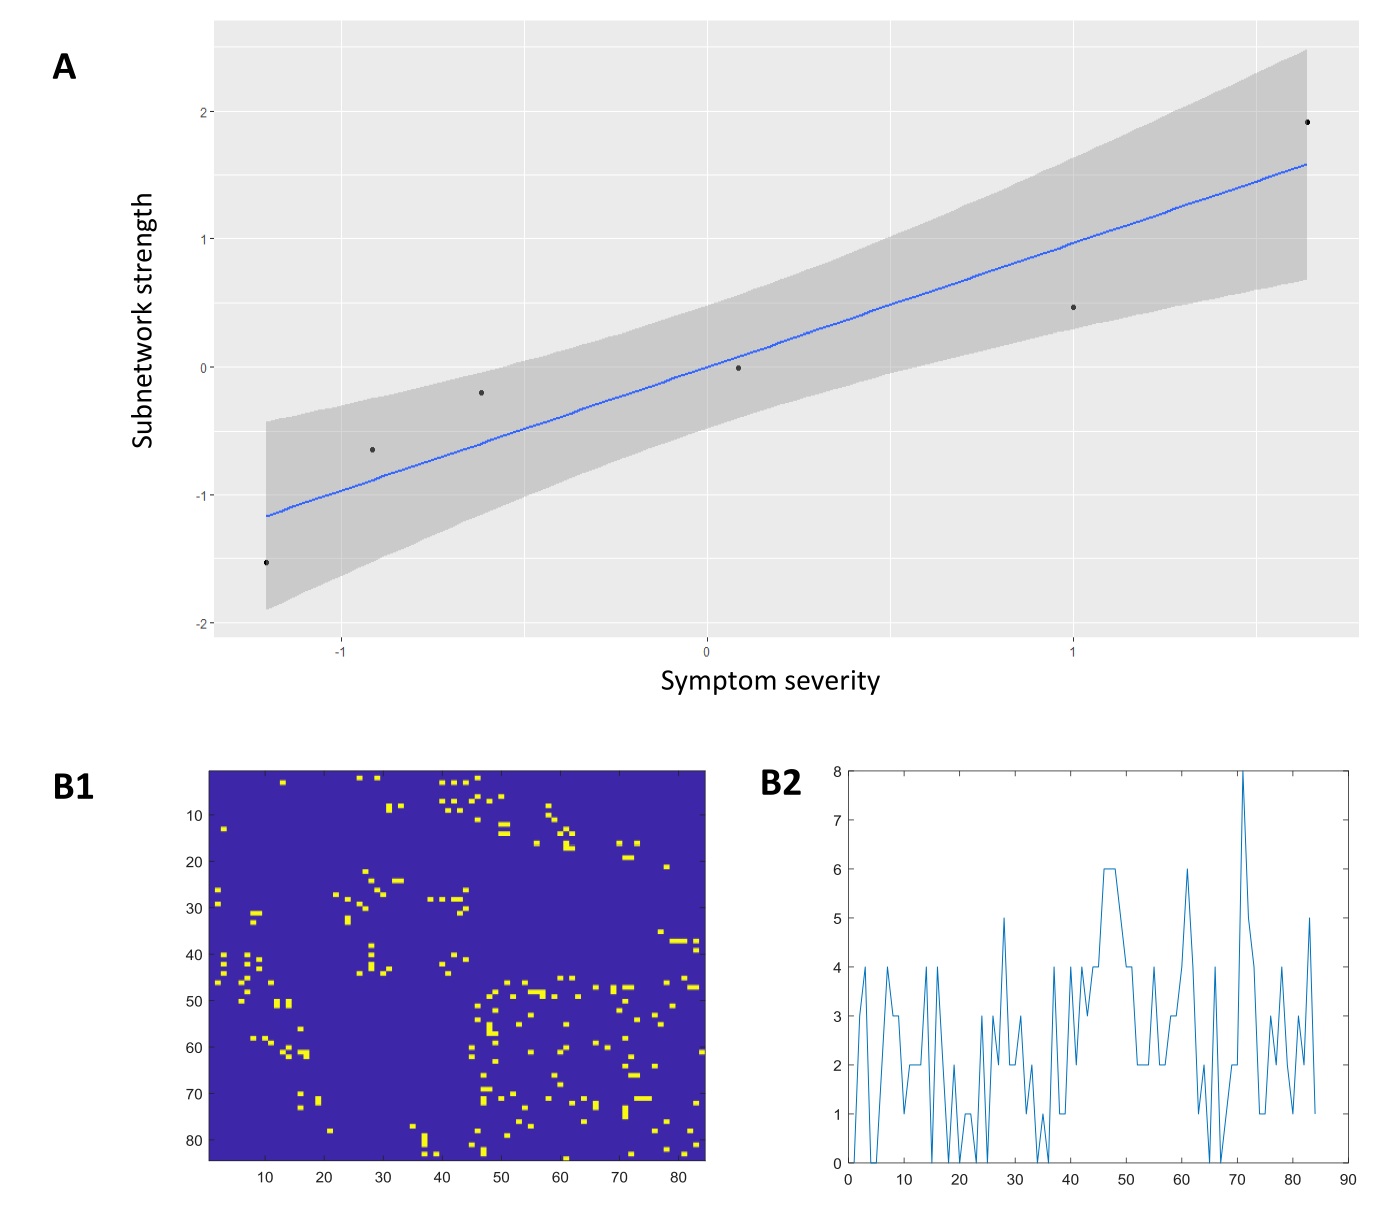
Network decomposition was performed using projective non-negative matrix factorization(PNMF)9. PNMF is a machine learning method for multivariate data decomposition and component analysis to extract sparse network components. Each component comprises a sparse set of topologically localized connections that represent putative subnetworks, with subject-specific weightings that indicate the contribution of each component to the full network in each subject10. Applying this method to within-pair difference modelling in monozygotic twins11, the standardized age-adjusted Euclidean distance in subnetwork strength within-twin-pairs was used to predict intra-pair differences in ASD symptom severity. Node importance was ranked by node degree to identify putative hubs within the subnetwork.
Results
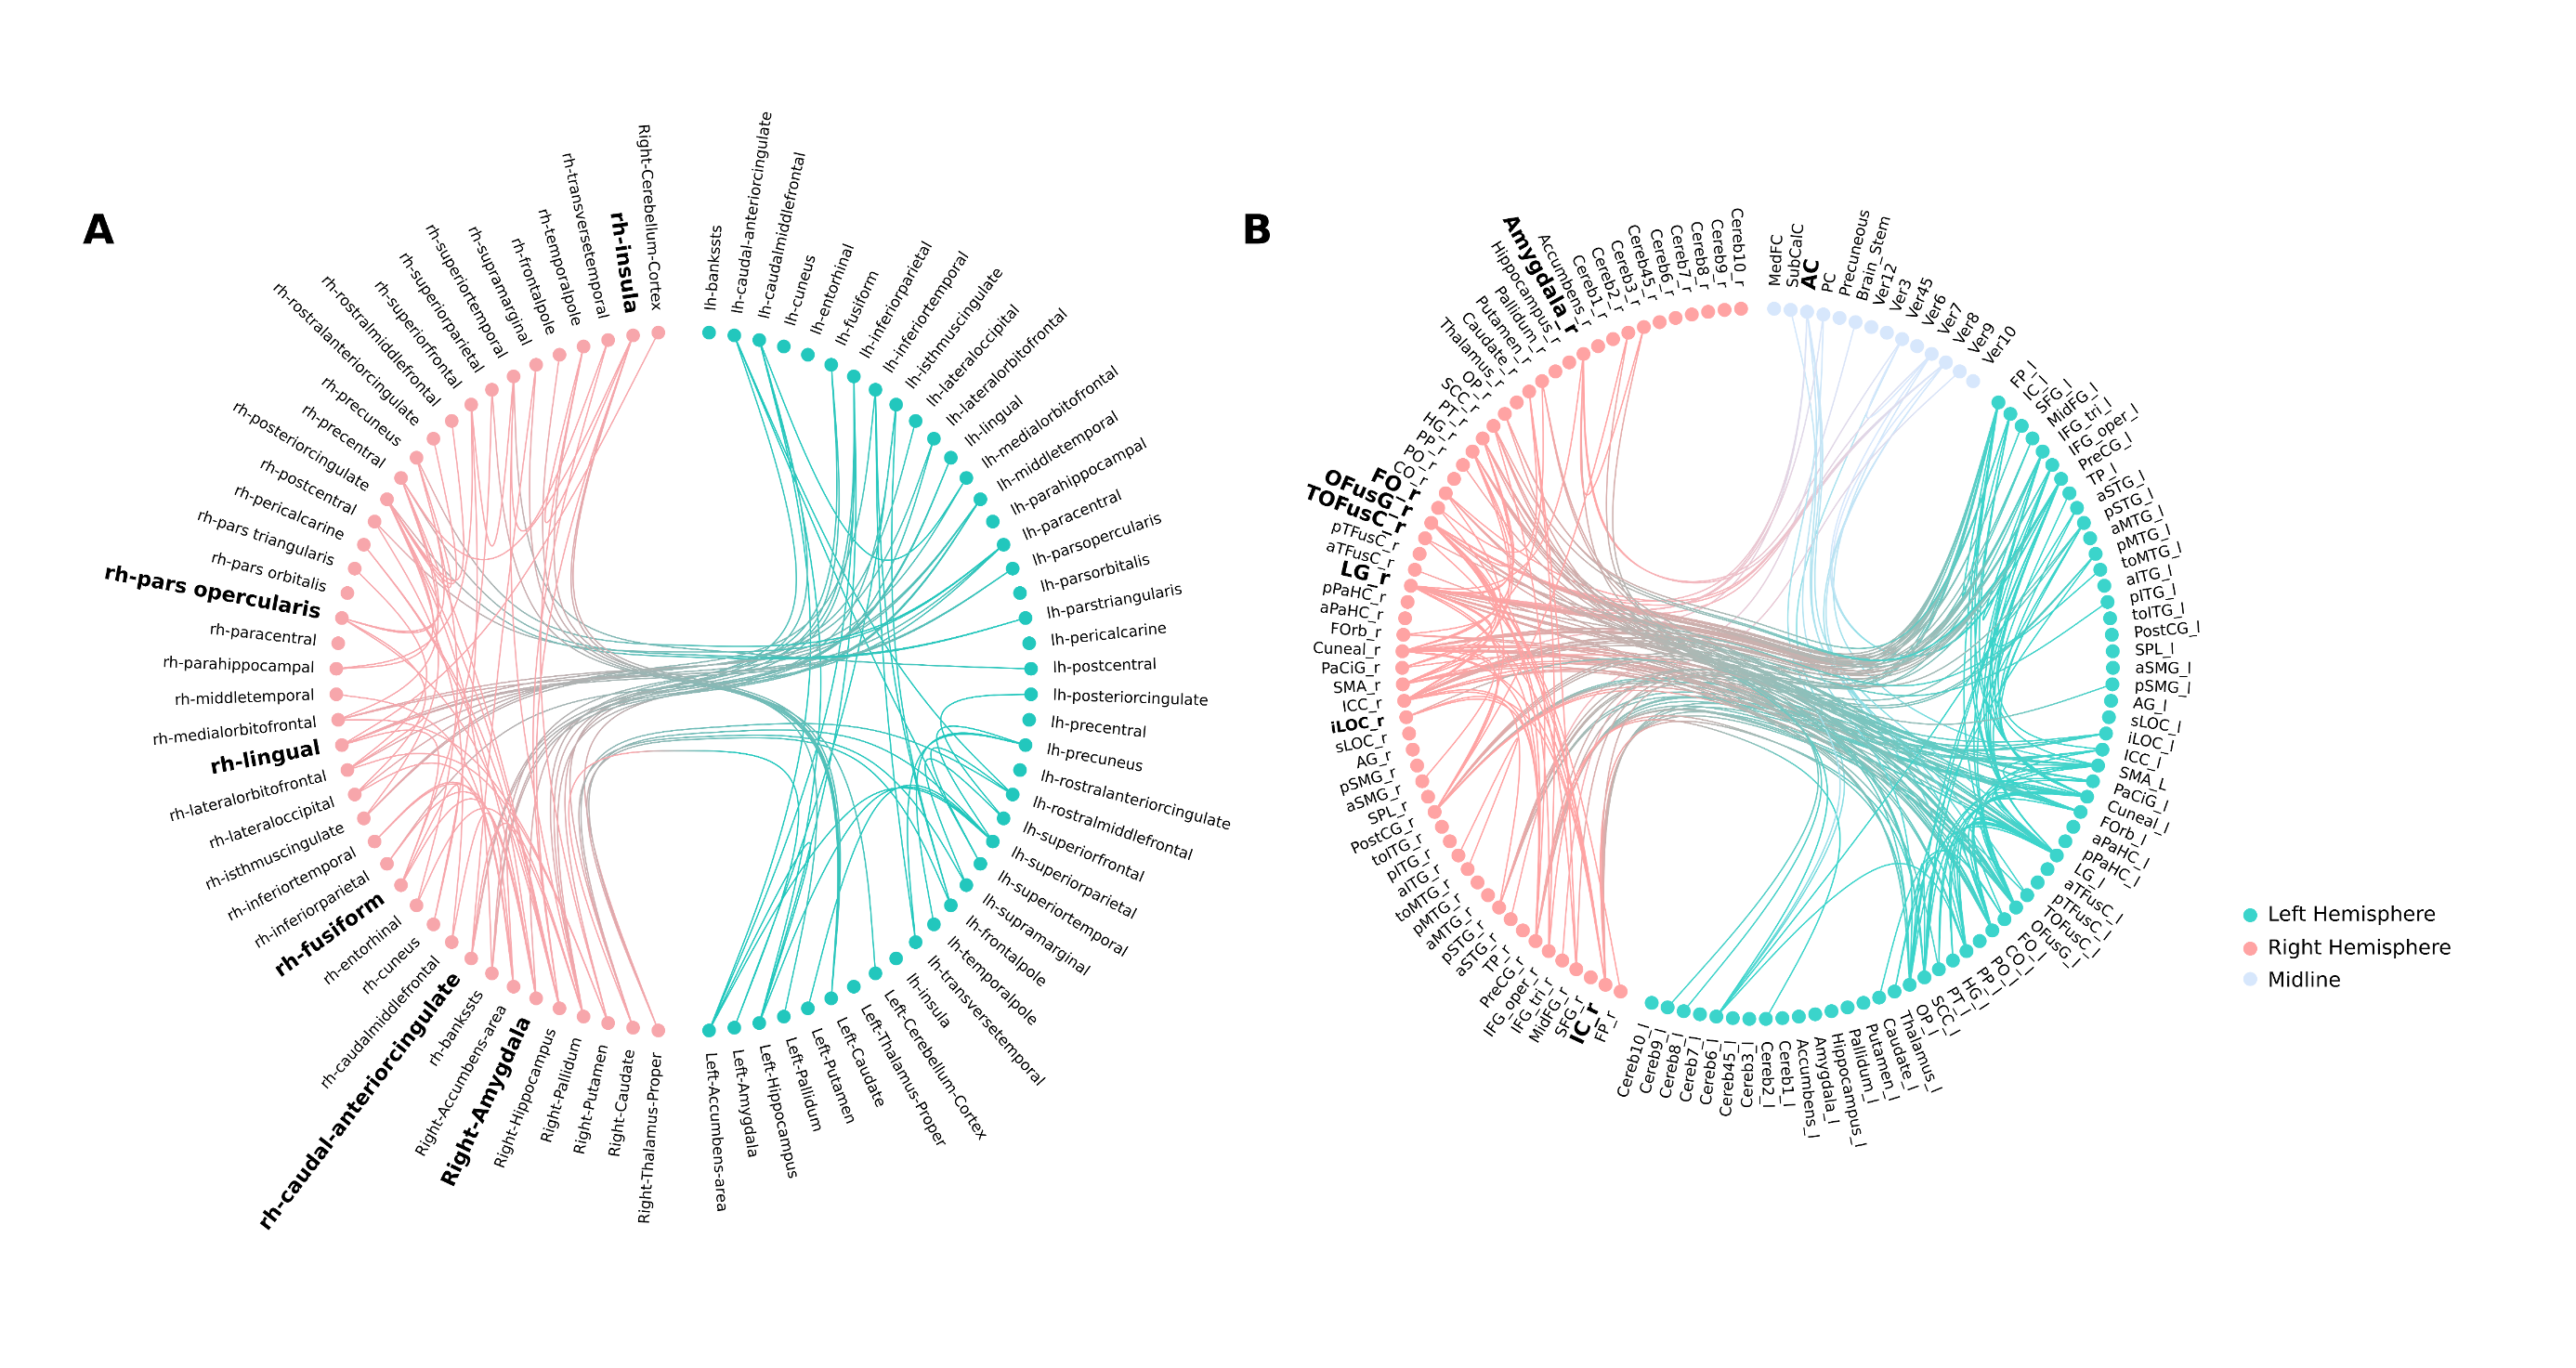
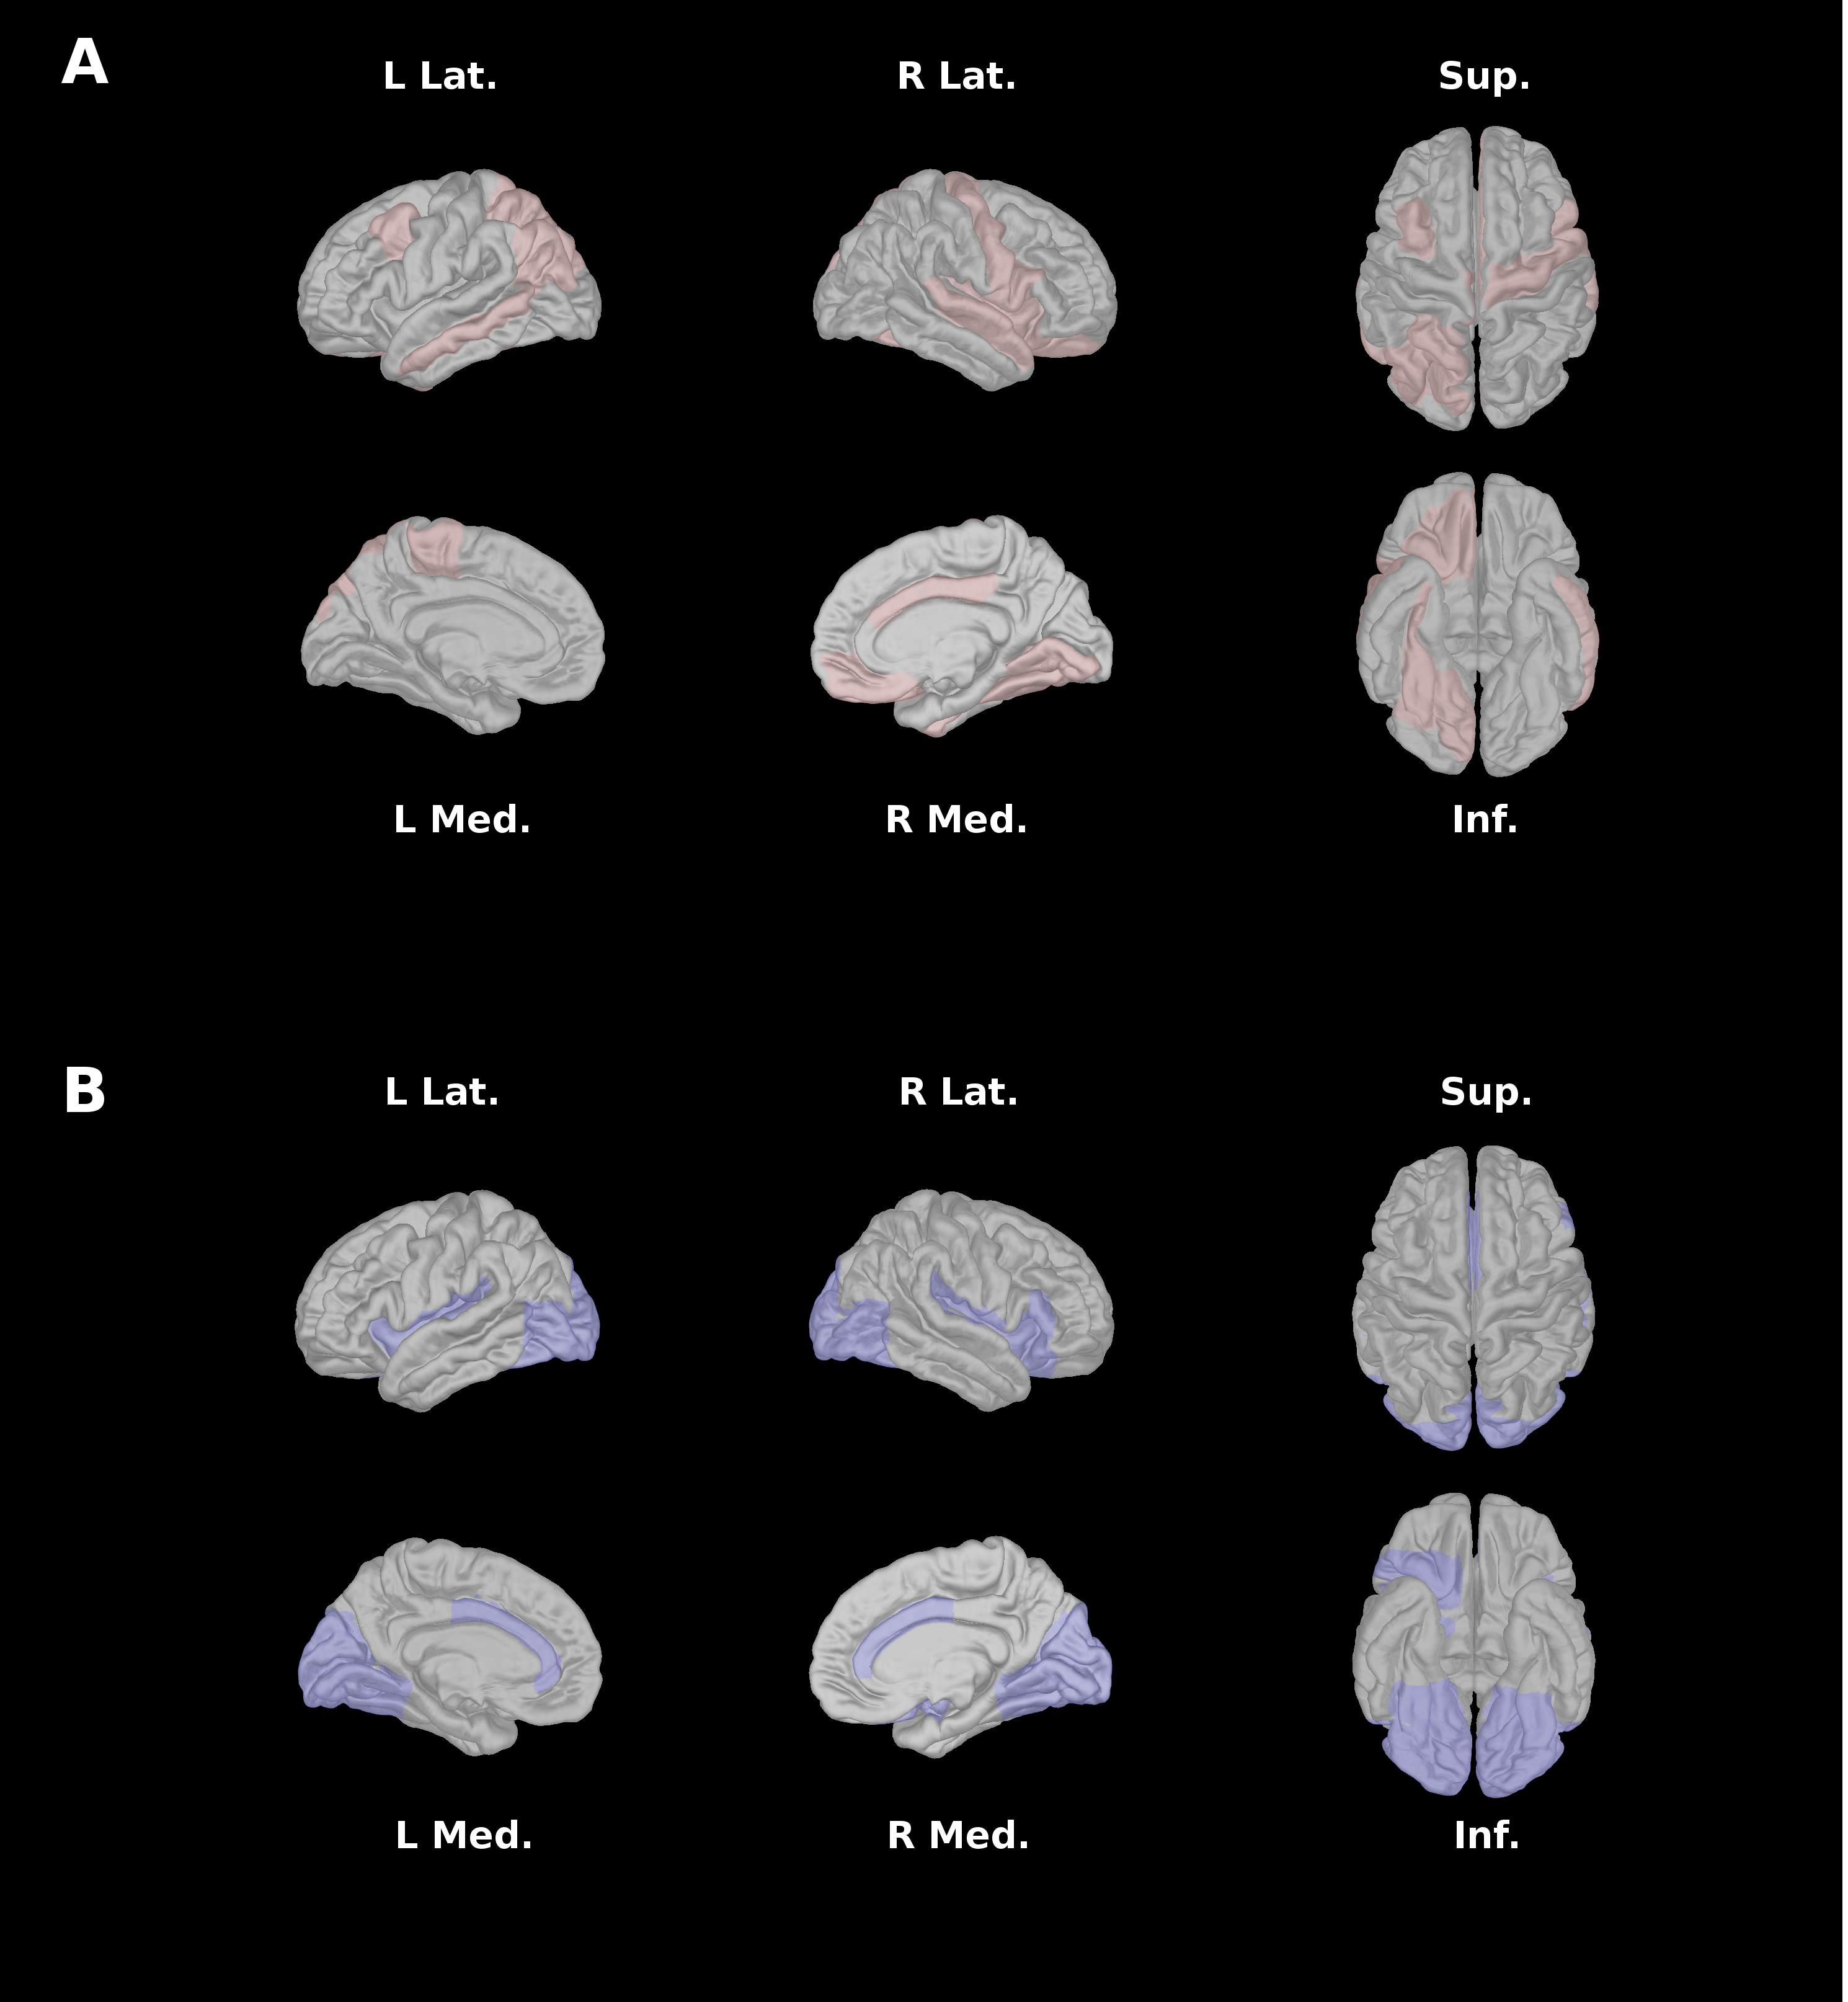
A single structural subnetwork was identified as a predictor of symptom severity (Figure 1A). Intra-pair differences in component strength of the identified subnetwork predicted within-pair differences in symptom severity (Figure 3A; T=5.76, p=0.0045). Key nodes (Figure 2A) of the structural subnetwork implicated major hubs of the salience network (SN) and occipital-temporal face perception network in the anterior cingulate cortex (ACC), insula, lingual, fusiform, superior temporal gyrus, amygdala, caudate, and the posterior cingulate cortex. These findings are consistent with our previous findings identified atypical SN and occipital-temporal functional subnetworks (Figure 1B) implicating the bilateral insula, ACC, bilateral lingual gyri, occipital fusiform and lateral occipital cortex (Figure 2B).Discussion
By integrating network analysis approaches with monozygotic twin modelling, we identified a structural subnetwork underlying within-pair differences in ASD symptom severity. Subnetwork topology implicates the involvement of salience and face-perception networks. This finding is consistent with the previously identified functional subnetwork in ASD that was replicated across multiple cohorts2. These intrinsic networks support complex functions such as social behaviour, communication, self-awareness, and facial individuation12. Given that these are hallmark features implicated in ASD symptomatology13, perturbations in associated networks may play a major role in altered neurodevelopmental pathways underlying ASD. The consistency of spatial topology in identified structural and functional subnetworks, as well as the stability of PNMF network decomposition across different imaging modalities, lend further support for this hypothesis. Due to shared genetic and familial environment, the observed within-pair symptom severity differences are further assumed to be related to variation in pre- and perinatal exposures to the non-shared environmental influences14.Conclusion
Atypical development of the salience and occipital-temporal face-perception networks are promising candidate markers in ASD neurobiology. Unique environmental influences are implicated as potential risk factors in the association between with individual differences in subnetwork strength and variation in ASD symptom severity.Acknowledgements
Research was conducted with support from Twins Research Australia. The authors declare no potential conflicts of interest with respect to the research, authorship, and/or publication of this article.References
1. Pua EPK, Bowden SC, Seal ML. Autism spectrum disorders: Neuroimaging findings from systematic reviews. Research in Autism Spectrum Disorders. 2017;34:28-33.
2. Pua EPK, Ball G, Seal ML. Individual variation in intrinsic brain subnetworks are neural correlates of Autism Spectrum Disorders (ASD) symptom severity. Manuscript in prep. 2018.
3. McConachie H, Parr JR, Glod M, et al. Systematic review of tools to measure outcomes for young children with autism spectrum disorder. Health Technology Assessment. 2015;19(41):1-506.
4. Tournier JD, Calamante F, Connelly A. MRtrix: diffusion tractography in crossing fiber regions. International Journal of Imaging Systems and Technology. 2012;22(1):53-66.
5. Jeurissen B, Tournier J-D, Dhollander T, Connelly A, Sijbers J. Multi-tissue constrained spherical deconvolution for improved analysis of multi-shell diffusion MRI data. NeuroImage. 2014;103:411-426.
6. Smith RE, Tournier J-D, Calamante F, Connelly A. Anatomically-constrained tractography: improved diffusion MRI streamlines tractography through effective use of anatomical information. NeuroImage. 2012;62(3):1924-1938.
7. Smith RE, Tournier J-D, Calamante F, Connelly A. SIFT: spherical-deconvolution informed filtering of tractograms. NeuroImage. 2013;67:298-312.
8. Desikan RS, Ségonne F, Fischl B, et al. An automated labeling system for subdividing the human cerebral cortex on MRI scans into gyral based regions of interest. NeuroImage. 2006;31(3):968-980.
9. Yang Z, Zhu Z, Oja E. Automatic rank determination in projective nonnegative matrix factorization. Paper presented at: International Conference on Latent Variable Analysis and Signal Separation2010.
10. Ball G, Beare R, Seal ML. Network component analysis reveals developmental trajectories of structural connectivity and specific alterations in autism spectrum disorder. Human Brain Mapping. 2017;38(8):4169-4184.
11. Carlin JB, Gurrin LC, Sterne JA, Morley R, Dwyer T. Regression models for twin studies: a critical review. International journal of epidemiology. Oct 2005;34(5):1089-1099.
12. Menon V. Salience Network. In: Arthur W. Toga, editor. Brain Mapping: An Encyclopedic Reference, vol. 2, pp. 597-611. Academic Press: Elsevier.2015:597-611.
13. Joseph RM, Tanaka J. Holistic and part‐based face recognition in children with autism. Journal of Child Psychology and Psychiatry. 2003;44(4):529-542.
14. Plomin R. Commentary: Why are children in the same family so different? Non-shared environment three decades later. International journal of epidemiology. 2011;40(3):582-592.
Figures