3014
Analysis of automatically extracted structural features to describe traumatic brain injury severity1Laboratory of Neuro Imaging, Mark and Mary Stevens Neuroimaging and Informatics Institute, University of Southern California, Keck School of Medicine, Los Angeles, CA, United States, 2Departments of Neurology and Neurosurgery, David Geffen School of Medicine, The University of California, Los Angeles (UCLA), Los Angeles, CA, United States
Synopsis
Post-traumatic epilepsy (PTE) prediction is one of the greatest challenges in recent years. The probability of developing PTE is strongly connected with injury severity. Accordingly, having an automated alternative to clinician scoring, to measure injury severity, could be helpful to measure the progression of the disease in view of finding PTE biomarkers. Therefore, we have conducted a study aimed to evaluate if injury severity can be established from automatic analyses of MRI data in a way comparable to manual clinical scoring. We found a statistical association between morphological features and two clinical scores used to quantify injury severity.
Introduction
Traumatic brain injury (TBI) is a heterogeneous condition, due to a brain insult, that affects more than 50 million people worldwide every year. TBI can cause secondary debilitating problems; it is one of the primary causes of post-traumatic epilepsy1. PTE refers to recurrent and unprovoked seizures that develop at least one week after TBI occurs. PTE is preceded by a latent period during which therapeutic treatment may stop, revert, or prevent epileptogenesis2. Therefore, one of the most recent challenges is to identify validated biomarkers of PTE for measuring the evolution and presence of the disease. Injury severity is a well-known risk factor for PTE3,4 and finding an automatic method to monitor it could be of great importance. Consequently, we studied structural magnetic resonance imaging (MRI) scans of subjects after TBI to assess if morphological brain changes can be statistically associated with two clinical scores: Glasgow Coma Scale (GCS)5 and a clinical score that we obtained by considering all the aggravating factors for a TBI patient.
Methods
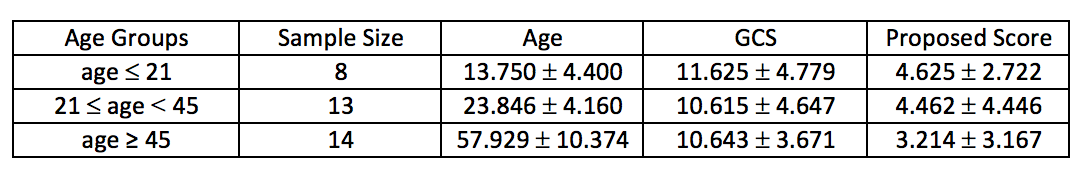
We used 35 MRI scans of TBI patients from The Epilepsy Bioinformatics Study for Anti-epileptogenic Therapy (EpiBioS4Rx)6, a longitudinal multi-site study, to discover and validate biomarkers of epileptogenesis after TBI. MRI data include MPRAGE T1 brain scans acquired from a Siemens 3T scanner within 14 days of the TBI. In Table 1, demographic and clinical information of the patients are reported.
From each subject of the cohort, we extracted morphological brain measurements and two clinical scores. Clinical scores were used to evaluate the severity of the TBI. In addition to GCS, we used a clinical score obtained by assigning a value of 1 to each element that may represent an aggravating factor, such as number of neurosurgical procedures, midline shift, loss of consciousness, presence of seizures, epileptiform activity after TBI, and penetrating injury. This score ranges from 0 to 14 and takes into account more follow-up aspects compared with GCS, which measures the mental status of patients according to three responsiveness categories: eye opening, motor, and verbal responses. GCS is scored between 3 and 15; higher scores indicate a less severe injury.
For the extraction of structural features from MRI scans, we used the publicly available brain segmentation package, FreeSurfer v.6.07. The FreeSurfer pipeline automatically performs: brain extraction, intensity normalization, spatial registration, volume labeling, segmentation, and all steps necessary to compute morphological features from each image. This tool allowed us to obtain 182 features, for each MRI scan, including subcortical and cortical gray matter parcellations, white matter parcellations, total grey and white matter volumes, and intracranial volume.
To quantify the statistical association between Freesurfer measurements and injury severity, described by the two clinical scores, we carried out a Poisson regression. Regression was performed by stratifying the data into three age groups to remove the confounding effect of normal aging on the structural features. We categorized subjects into three groups: the youngest group $$$(age < 21)$$$, the intermediate group $$$(21 ≤ age < 45)$$$, and the oldest group $$$(age ≥ 45)$$$.
Results
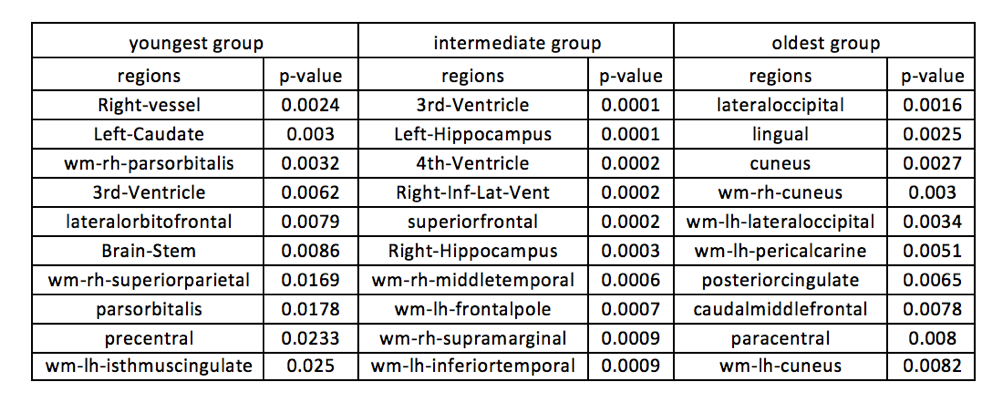
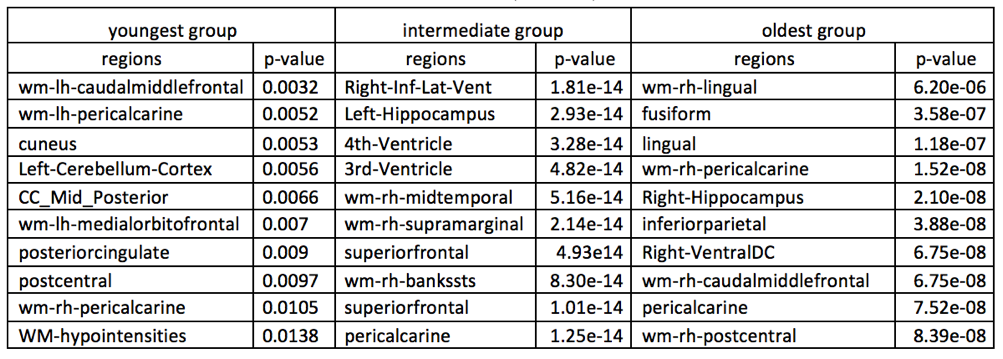
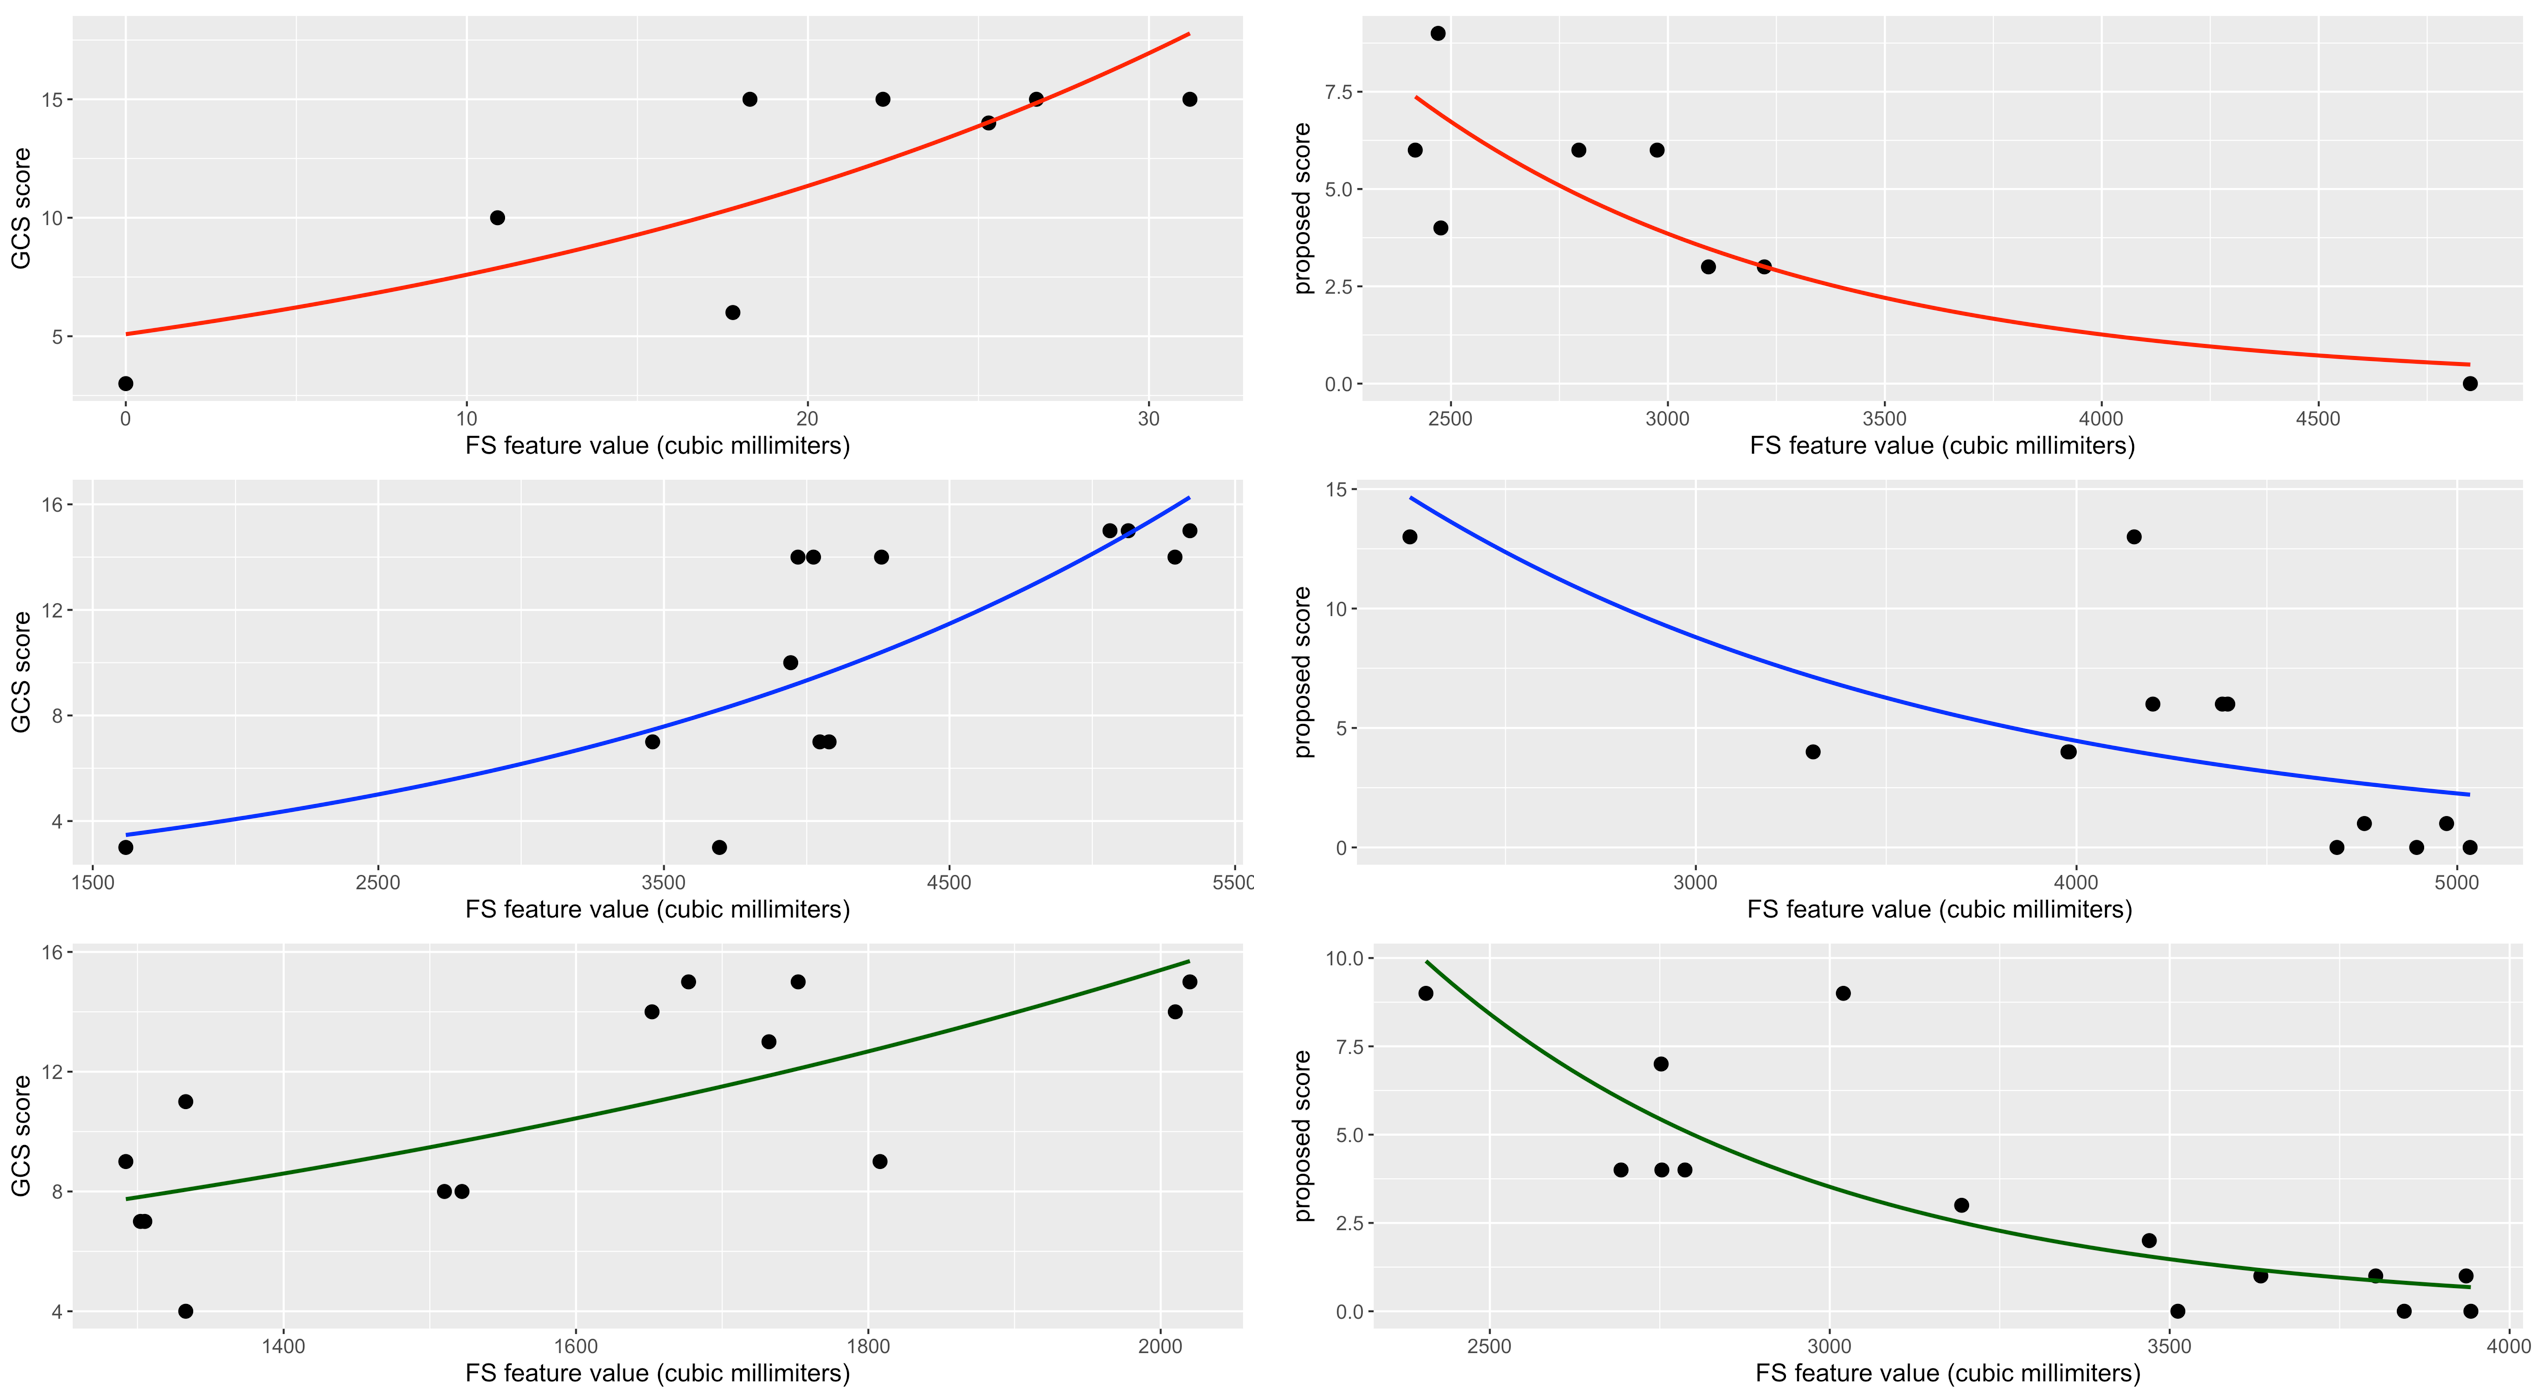
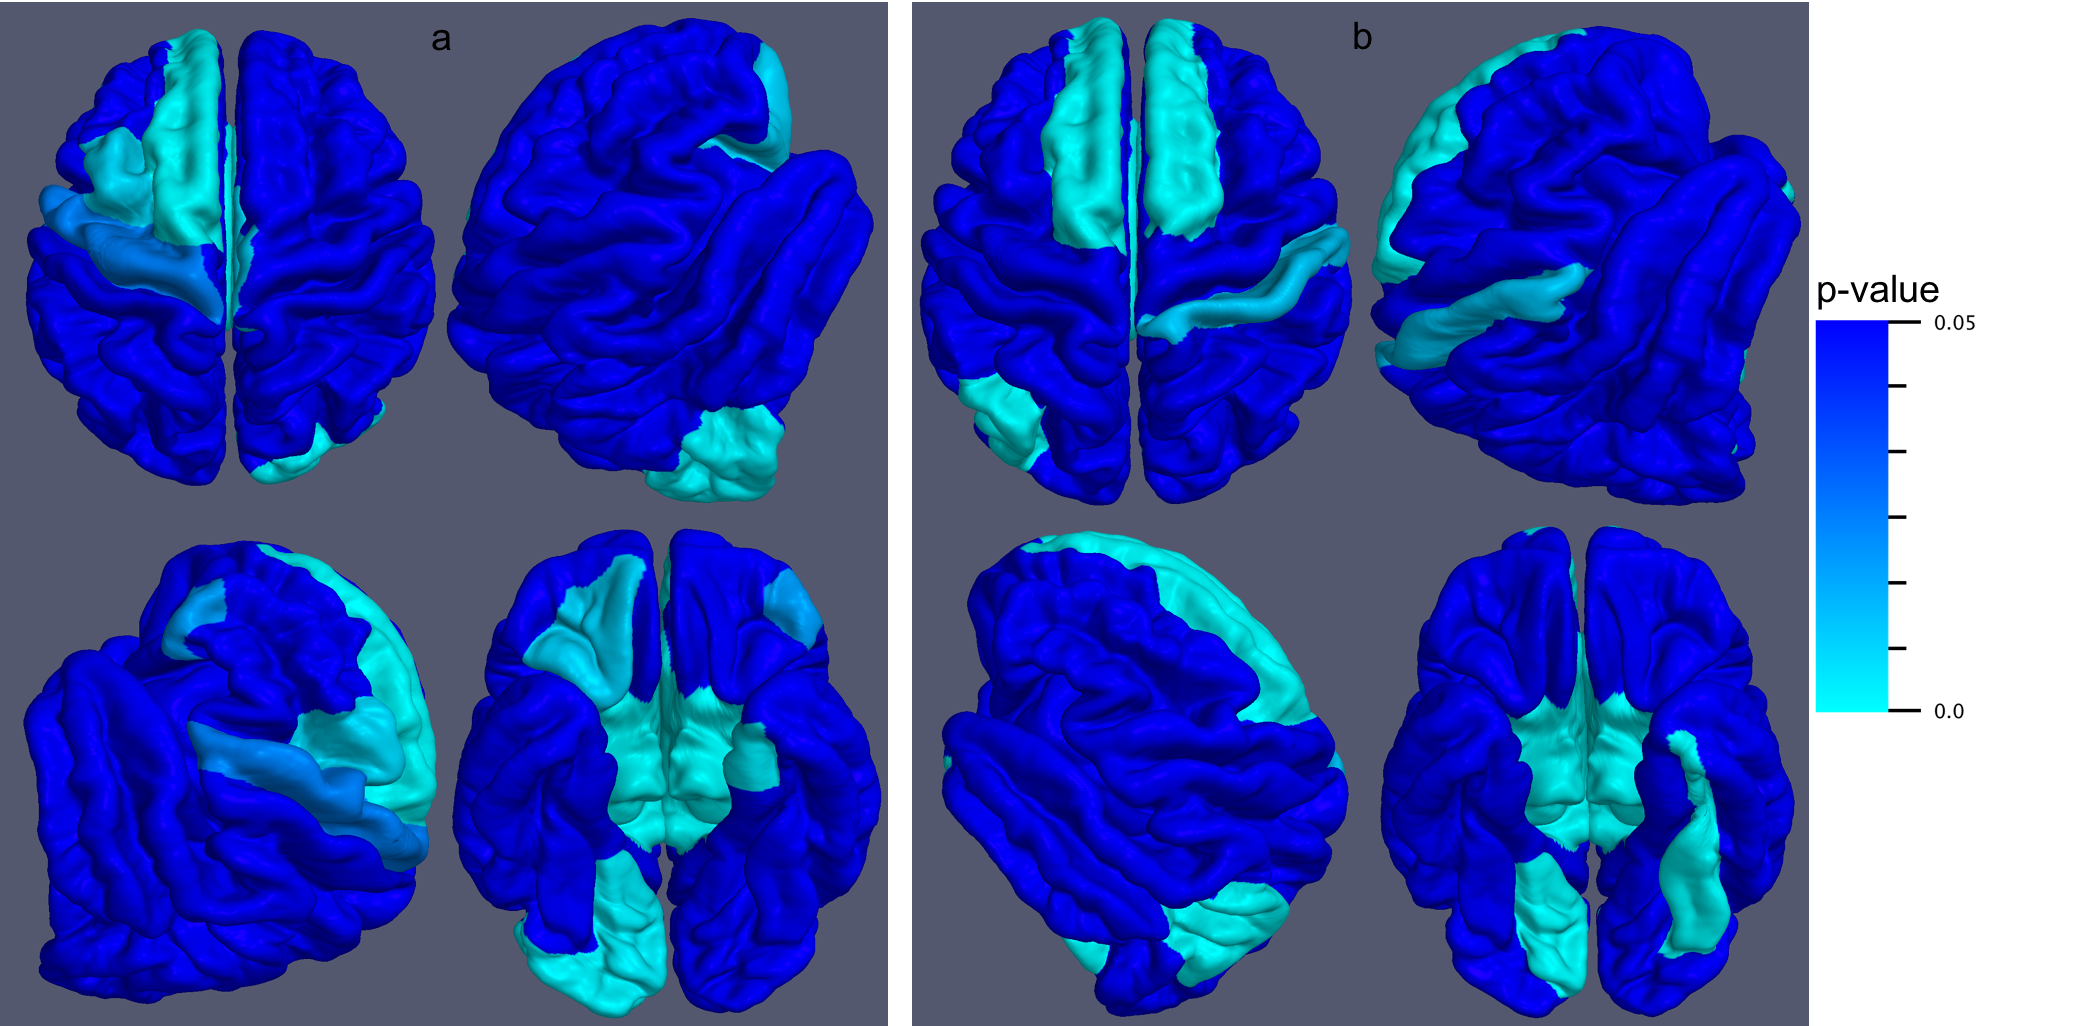
MRI morphological changes measured with FreeSurfer proved to be statistically associated with both scores with $$$5\%$$$ significance. For the GCS score, 19 significant associations ($$$p < 0.05$$$) were found in the youngest group, 98 in the intermediate group, and 39 in the oldest group. For the proposed score, 37 significant associations were found in the youngest group, 143 in the intermediate group, and 122 in the oldest group. We report in Tables 2 and 3 an overview of the first 10 p-values and the corresponding significant anatomical regions for the GCS and the proposed score, respectively. In Figure 1, the GCS score and the proposed score are shown as a function of some significant FS features change. In Figure 2, significant cortical regions for the two scores and their p-values are reported.
Conclusions and Future Work
We demonstrated that FS structural features are statistically associated with the two clinical scores studied and could, therefore, be further investigated to automatically examine the injury severity and its eventual correlation with PTE. Further confirmation of the structural feature potential in measuring the progression of the disease is the greater association with the proposed score that is more reliable than the GCS score as it includes more follow-up information. An interesting future step could be the clinical validation of these results to understand if the position of the significant anatomical regions is correlated to the initial lesion.Acknowledgements
This research was supported by the National Institute of Neurological Disorders and Stroke (NINDS) of the National Institutes of Health (NIH) under Award Number U54NS100064 (EpiBioS4Rx).References
1. Dadas, Aaron, and Damir Janigro. "Breakdown of blood brain barrier as a mechanism of post-traumatic epilepsy." Neurobiology of disease (2018).
2. Frey, Lauren C. "Epidemiology of posttraumatic epilepsy: a critical review." Epilepsia 44 (2003): 11-17.
3. Tubi, Meral A., et al. "Early seizures and temporal lobe trauma predict post-traumatic epilepsy: a longitudinal study." Neurobiology of disease (2018).
4. Ferguson, Pamela L., et al. "A population‐based study of risk of epilepsy after hospitalization for traumatic brain injury." Epilepsia 51.5 (2010): 891-898.
5. Pal, Jozsef, Robin Brown, and D. Fleiszer. "The value of the Glasgow Coma Scale and Injury Severity Score: predicting outcome in multiple trauma patients with head injury." The Journal of trauma 29.6 (1989): 746-748.
5. Paul M., et al. "The epilepsy bioinformatics study for anti-epileptogenic therapy (EpiBioS4Rx) clinical biomarker: Study design and protocol." Neurobiology of disease (2018).
7. Fischl, Bruce. "FreeSurfer." Neuroimage 62.2 (2012): 774-781.
Figures