3013
Perfusion and brain volume loss after traumatic brain injury1Radiology, University Medical Center Utrecht, Utrecht, Netherlands, 2National Institute of Neurological Disorders and Stroke, National Institutes of Health, Bethesda, MD, United States, 3Division of Intramural Research, National Heart Lung, and Blood Institute, National Institutes of Health, Bethesda, MD, United States
Synopsis
How can we identify traumatic brain injury (TBI) patients at risk for long-term brain injury? In this longitudinal study, 57 patients with a relatively good clinical status on admission underwent MRI within 48 hours and at 90 days after injury. Brain volume changes were markedly larger in patients with subarachnoid hemorrhage (-3.2%) compared to patients without subarachnoid hemorrhage (-0.4%; P <0.001). Perfusion was moderately correlated with brain volume change at 90 days (ρ = 0.39; P = 0.003). This demonstrates the utility of imaging markers on acute MRI, especially subarachnoid blood, to identify patients at risk for long-term brain injury.
Introduction
One in five mild TBI patients is affected by long-term functional impairment.1,2 Therefore, markers are needed to determine which patients are at risk for long-term impairment despite a relatively good clinical status on admission.
Accelerated brain volume loss occurs beyond one year after TBI.3,4 As TBI is commonly followed by an acute mismatch in oxygen delivery and cerebral oxygen consumption, those who show impaired perfusion may have more brain volume loss. In particular, perfusion in the borderzone regions, prone to impairment due to blood delivery by the most distal arterial branches, may be a biomarker of future accelerated brain volume loss. As well, traumatic subarachnoid hemorrhage (SAH) might provoke and exacerbate secondary injury after TBI through its stimulating effect on inflammation, and the release of glutamate, nitric oxide and free radicals.5
In this study, we set out to evaluate the association between perfusion and brain volume change after 90 days in TBI patients. As well, we investigated whether SAH leads to a more pronounced brain volume change.
Methods
Fifty-seven patients were included in this study, mean acute imaging time was 17 hours (IQR: 7 - 25) and mean follow-up imaging time was 91 days (IQR: 76 – 110). First, the lesion prediction algorithm for SPM was used to segment lesions on T2-FLAIR images and correct the corresponding T1 images for these hyperintensities.6 Subsequently, brain volume was obtained with CAT12 by taking the sum of the gray and white matter volumes, including the lesion volume.
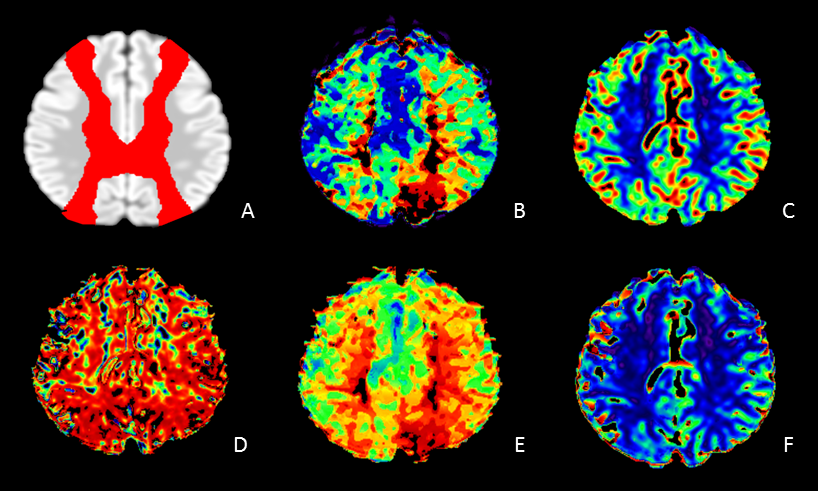
Motion-corrected PWI data were analyzed with a block-circulant singular value deconvolution (bSVD) analysis,7 and temporal similarity perfusion mapping (TSP).8 The bSVD approach yielded CBF and Tmax maps. TSP is a model-free method based on a voxelwise comparison of PWI-contrast-inflow-curves. It provides Pearson’s r correlation maps, peak signal intensity maps, and a relative delay map. The resulting perfusion maps were coregistered to a Dartel template, and whole brain as well as borderzone values were retrieved. The borderzone ratio relative to whole brain values was calculated for each perfusion parameter.
SAH presence was scored blinded on the GRE and FLAIR images.
Results
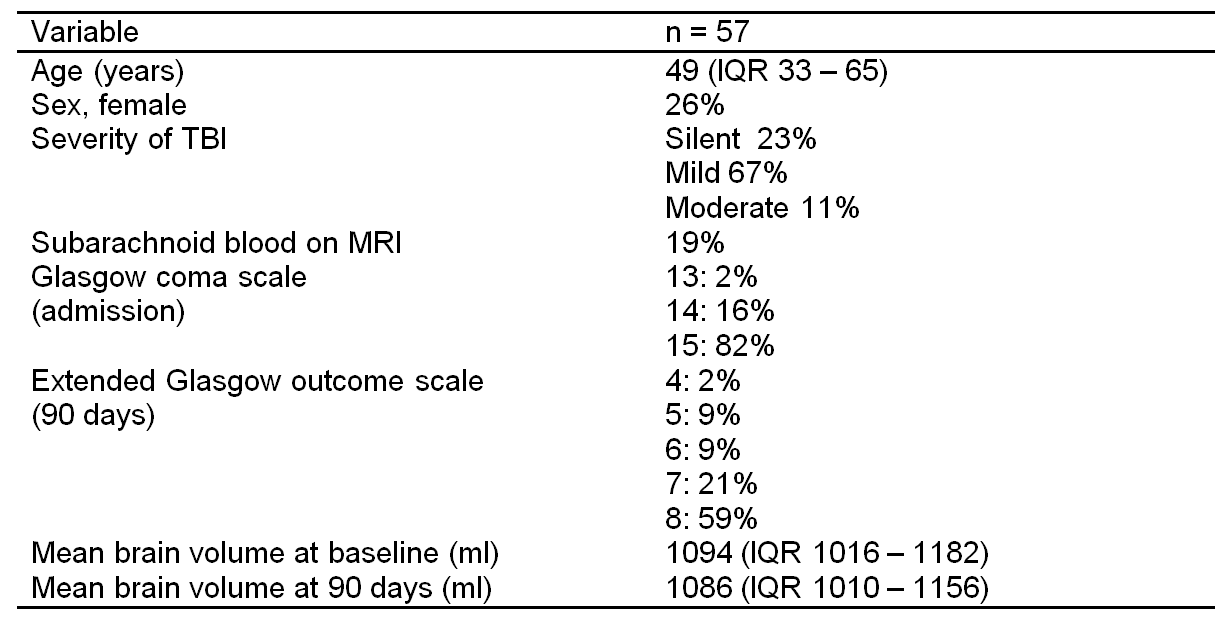
Subject characteristics are shown in Table 1, 90% of patients were diagnosed with silent or mild TBI and median brain volume change was -0.7% (IQR -2.1 – 0.6%).
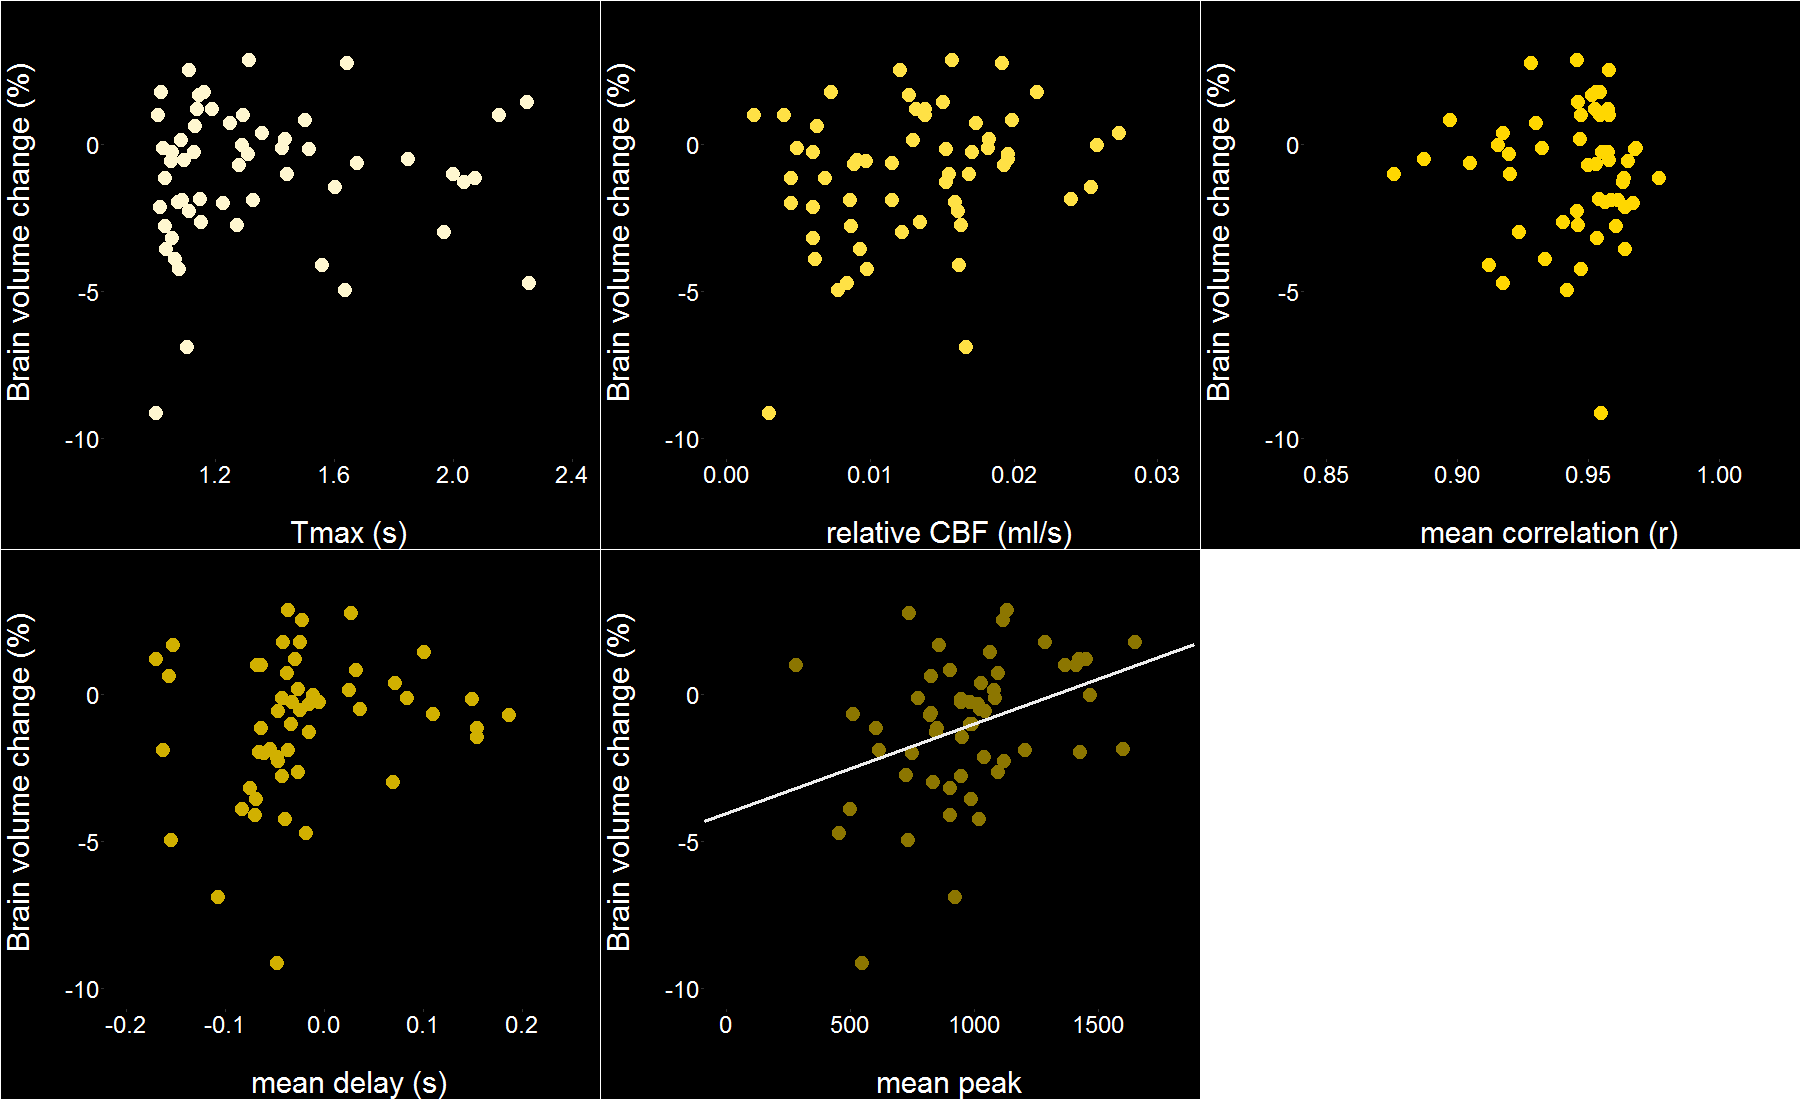
Whole brain TSP peak values were significantly associated with brain volume change: ρ = 0.39 (P = 0.003; Fig.2) and a trend was noticed between whole brain bSVD CBF values and relative brain volume change: ρ = 0.24 (P = 0.079). The borderzone ratio, however, was not associated with brain volume change (%).
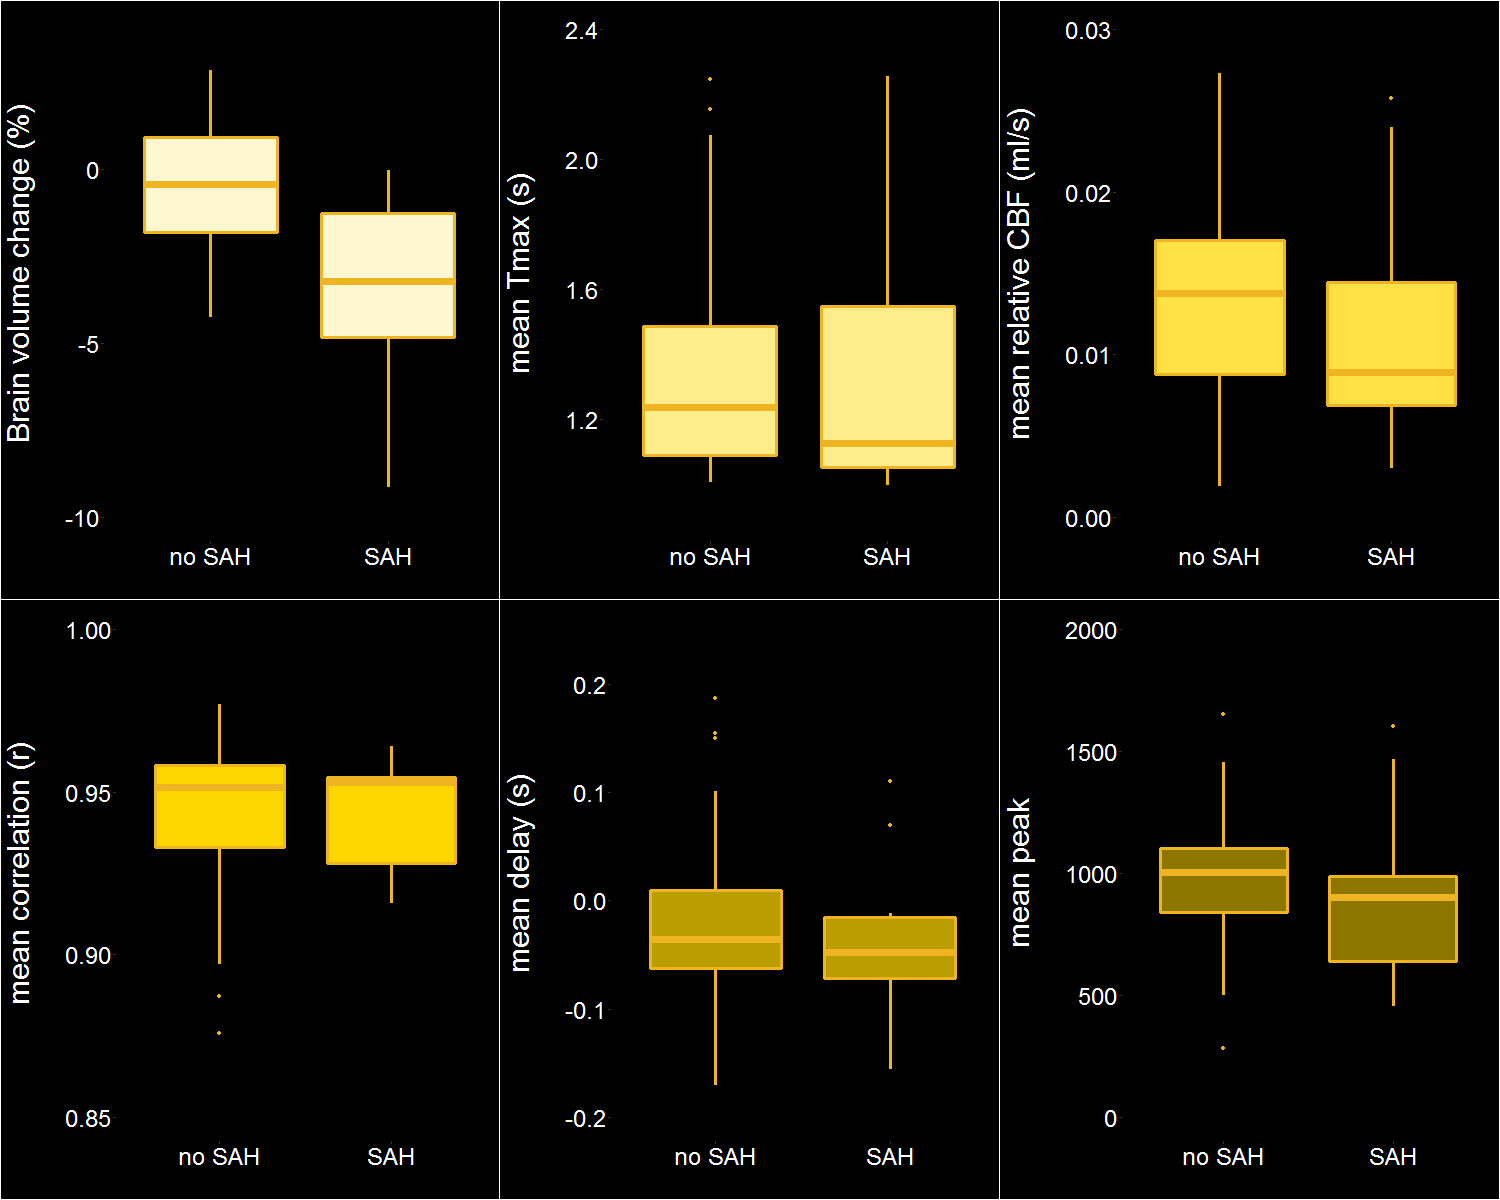
Brain volume change was more pronounced in patients with SAH compared to patients clear of SAH: -3.2 % (IQR -4.8 – -1.3%) versus -0.4% (IQR -1.8 – 0.9%; P < 0.001; Fig. 2). In contrast, perfusion parameters did not significantly differ in patients with and without SAH (Fig. 3).
The level of disability at 90 days as measured by the extended Glasgow outcome scale (GOS-E) was not related to FLAIR lesion volume, brain volume change, TSP peak values or bSVD CBF values, nor was it different between those with and without subarachnoid hemorrhage (P = 0.51).
Discussion
Accelerated brain volume loss was observed among TBI patients with a relatively good clinical status upon admission. Lower perfusion (TSP peak) and presence of SAH in the acute phase may predict subjects at increased risk for this accelerated brain volume loss. Additionally, there was no clear correlation between perfusion and presence of SAH, which would imply that these observations independently affect brain volume. Future work will investigate differences between white matter and gray matter borderzones .Conclusion
The reults of this study help us understand the cause of brain volume change associated with mild TBI, which may be the cause of functional impairment. Our findings show the potential of imaging markers on acute MRI, especially subarachnoid blood, to identify patients at risk for long-term brain volume changes.Acknowledgements
European Research Council under ERC grant agreement n°637024 (HEARTOFSTROKE).References
1. Lundin, A., et al., Symptoms and disability until 3 months after mild TBI. Brain Injury, 2006. 20(8): p. 799-806.
2. McMahon, P., et al., Symptomatology and functional outcome in mild traumatic brain injury: results from the prospective TRACK-TBI study. J Neurotrauma, 2014. 31(1): p. 26-33.
3. Xu, Y., et al., Early nonischemic oxidative metabolic dysfunction leads to chronic brain atrophy in traumatic brain injury. Journal of Cerebral Blood Flow and Metabolism: Official Journal of the International Society of Cerebral Blood Flow and Metabolism, 2010. 30(4): p. 883-894.
4. Trivedi, M.A., et al., Longitudinal changes in global brain volume between 79 and 409 days after traumatic brain injury: relationship with duration of coma. J Neurotrauma, 2007. 24(5): p. 766-771.
5. Greve, M.W. and B.J. Zink, Pathophysiology of traumatic brain injury. Mount Sinai Journal of Medicine: A Journal of Translational and Personalized Medicine: A Journal of Translational and Personalized Medicine, 2009. 76(2): p. 97-104.
6. Schmidt, P., et al., An automated tool for detection of FLAIR-hyperintense white-matter lesions in multiple sclerosis. Neuroimage, 2012. 59(4): p. 3774-3783.
7. Wu, O., et al., Tracer arrival timing-insensitive technique for estimating flow in MR perfusion-weighted imaging using singular value decomposition with a block-circulant deconvolution matrix. Magnetic Resonance in Medicine, 2003. 50(1): p. 164-174.
8. Song, S., et al., Temporal similarity perfusion mapping: A standardized and model-free method for detecting perfusion deficits in stroke. PLOS ONE, 2017. 12(10): p. e0185552.
Figures