3007
Monitoring subtle brain structural changes following concussion through advanced texture analysis of standard MRI scans1University of Calgary, Calgary, AB, Canada, 2University of British Columbia, Vancouver, BC, Canada
Synopsis
Concussion is a severe health problem and occurs extremely common in contact sports. Clinical MRI is typically used to detect brain abnormalities following injury. However, focal brain pathologies are rarely found. We applied a local spatial frequency-based texture analysis method to evaluate whether invisible MRI changes exist and how they evolve following concussion. Results show that T2 texture spectra decreased uniformly at 2 weeks, continuing at 2 months before recovering thereafter towards baseline in concussed subjects. There were no changes in the non-concussed groups. Advanced texture analysis of clinical MRI may help monitor subtle brain structural changes following concussion.
Introduction
Concussion is a growing health problem worldwide and one of the most common consequences of contact sports such as ice hockey. While acute symptoms vary and may recover within days, many concussed patients suffer from long-term functional deficits including cognitive and emotional disturbances.1 Magnetic resonance imaging (MRI) is a promising tool for assessing brain structural changes following concussion, but it is rarely associated with focal brain abnormalities using standard analysis.2 Our goal was to characterize invisible brain structural abnormalities concealed in standard MRI through advanced analysis of the distribution pattern (texture) of image voxels. Specifically, we used a local spatial frequency-based method3 to follow changes in the texture of brain corpus callosum in ice hockey players who had a single concussion, comparing with non-concussed players and healthy controls.Methods
We studied 39 ice hockey players (mean age = 21.2 ± 3.1 years; 20 females) and 9 matched controls (mean age = 22.9 ± 2.3 years; 4 females). All players underwent baseline 3T MRI and the Sport Concussion Assessment Tool 2 (SCAT 2) tests prior to the beginning of the hockey season. The concussed subjects had additional MRI at 72 hours, 2 weeks, 2 months, and end of the season (EOS). Non-concussed players received one additional MRI at EOS only. Four control subjects also had serial MRI at baseline, 72 hours, 2 weeks, and 2 months; 5 had only baseline MRI. The MRI protocol included a standard axial T2-weighted MRI sequence, with TR/TE = 1426/80 ms; slice thickness = 4 mm; matrix size = 512x512, and field of view = 230 x 230 mm2.
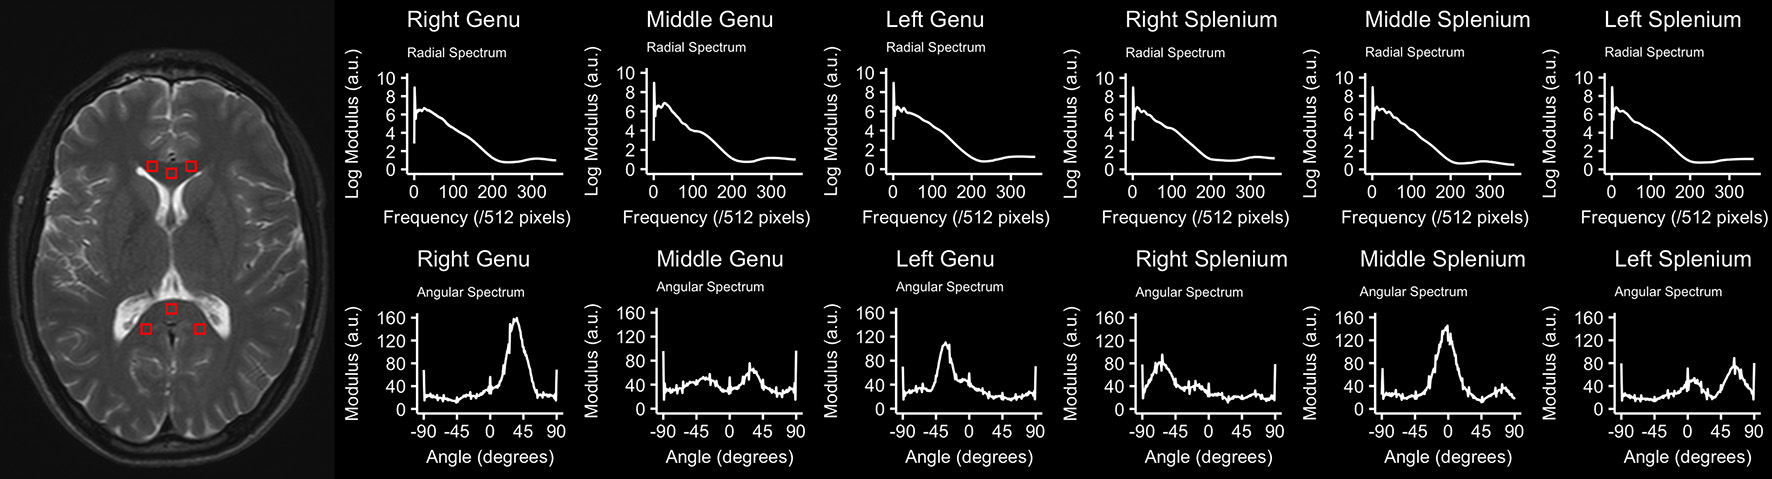
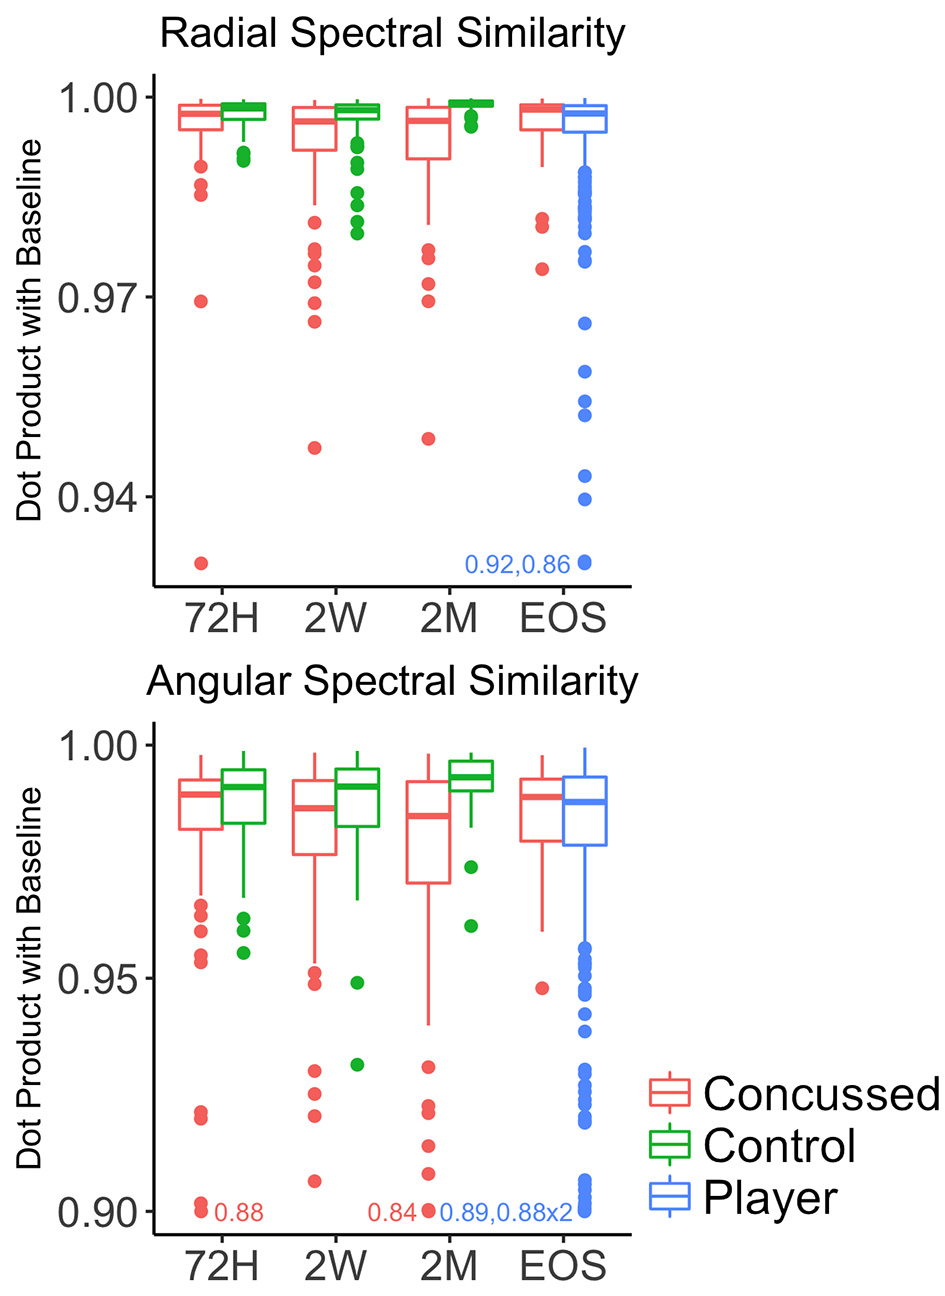
Image analysis focused on the T2-weighted MRI. At baseline, we selected 2 MRI slices demonstrating the largest cross-sectional areas of the genu and splenium of corpus callosum per brain and then identified the matching slices at follow-up MRI scans. To ensure comparability between outcomes over time, we normalized the sequential images per subject by finding the linear transformation which minimized the root-mean-square error between the grey/white matter portion of the corresponding histograms of each image (via kernel density estimation). There were 6 regions of interest (ROIs): left, middle, and right aspects of the genu and splenium respectively (Fig. 1), ranging 6x6 to 8x8 voxels. We performed texture analysis using the polar Stockwell transform,3 which computed 1) Fourier transform of the whole brain image; 2) spatial distribution of each frequency in the image; and 3) integrated frequency spectrum per spatial location of a voxel. This included two types of spectra: radial and angular, indicating structural regularity and alignment respectively, averaged per ROI. Moreover, to quantify temporal changes of the spectra, we computed the normalized dot product (similarity) between individual spectra of baseline and follow-up time-points, higher values reflecting greater recovery to baseline. Variable differences were assessed using the Wilcox non-parametric t-test.
Results
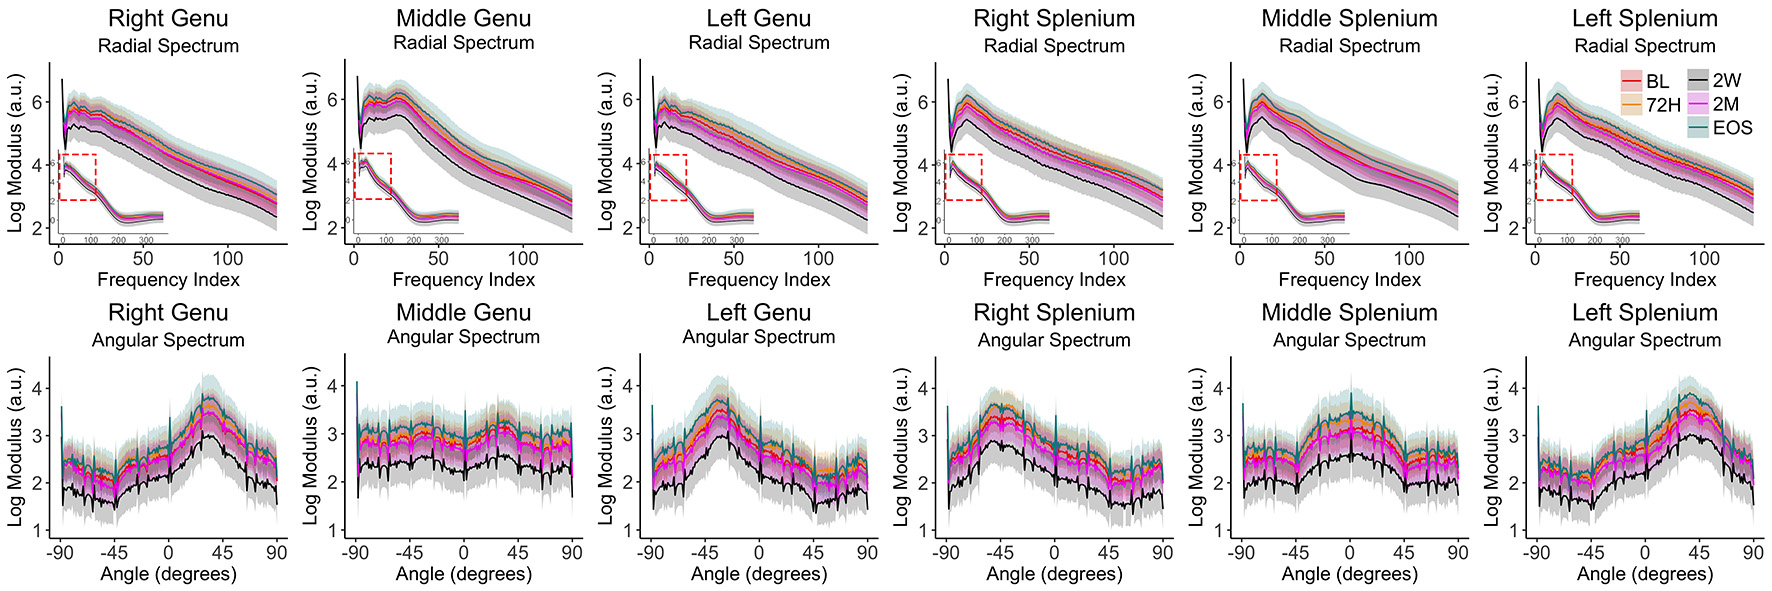
There were 11 concussed and 28 non-concussed players. At baseline, the spectral shape of these subjects looked similar to the controls (Fig. 1). Over time, the average strength of the radial spectra in concussed subjects was decreased in each ROI at 2 weeks, which was then increased at 2 months and EOS, approaching to baseline. The angular spectra showed a similar changing pattern in these subjects (Fig. 2). The dot product was lower in concussed players at 72 hours (p<0.05), 2 weeks and 2 months (p<0.001) than non-concussed players (EOS) and controls (Fig. 3), and then increased at EOS that was not different from the other two groups (p=0.31 and 0.56 respectively for radial and angular spectra). There were no changes in either spectral or dot product outcomes in the non-concussed groups (p>0.05).Discussion
Collective findings indicate a dynamic changing pattern in texture regularity after concussion with continuous decrease at 2 weeks and 2 months. Prior evidence shows that decreased regularity in MRI texture spectra is associated with greater demyelination and axonal loss in postmortem brains.4 This is consistent with a previous report showing transient loss of myelin content at 2 weeks following concussion before repair at 2 months.5 However, our results further suggest that nerve fiber damage may extend up to 2 months post injury.Conclusion
Advanced texture analysis of standard MRI may be a promising new tool for assessing subtle brain structural changes after mild concussion. Two weeks following injury may be a critical window for optimal management, and extended monitoring of disease evolution for up to 2 months may be necessary to minimize the risk of repeated injury, particularly around 18 days when returning to play typically occurs.Acknowledgements
We thank the funding supports from the Natural Sciences and Engineering Council of Canada (NSERC), MS Society of Canada, and Alberta Innovates, Canada.References
1. Gavett BE, Stern RA, McKee AC. Chronic traumatic encephalopathy: a potential late effect of sport-related concussive and subconcussive head trauma. Clin Sports Med. 2011 Jan;30(1):179-88.
2. Jarrett M, Tam R, Hernandez-Torres E, et al. A Prospective Pilot Investigation of Brain Volume, White Matter Hyperintensities, and Hemorrhagic Lesions after Mild Traumatic Brain Injury. Front Neurol 2016; 12: 7-11.
3. Zhu H, Goodyear BG, Lauzon ML, et al. A new local multiscale Fourier analysis for medical imaging. Med Phys 2003; 30: 1134-41.
4. Zhang Y, Moore GR, Laule C, et al. Pathological correlates of magnetic resonance imaging texture heterogeneity in multiple sclerosis. Ann Neurol 2013; 74: 91-9.
5. Wright AD, Jarrett M, Vavasour I, et al. Myelin Water Fraction Is Transiently Reduced after a Single Mild Traumatic Brain Injury – A Prospective Cohort Study in Collegiate Hockey Players. 2017; 11: e0150215.
Figures