2997
Multi-parametric analysis reveals metabolic and vascular effects driving differences in BOLD cerebrovascular reactivity associated with a history of sport concussion1Centre for Neuroscience Studies, Queen's University, Kingston, ON, Canada, 2Cardiff University Brain Research Imaging Center, Cardiff University, Cardiff, United Kingdom, 3Department of Surgery, Queen’s University, Kingston, ON, Canada
Synopsis
In this study, we identified robust differences in BOLD-CVR across the brain which were explained, in part, by hemodynamic parameters relating to CBF modulation, and resting metabolic and vascular physiology. These results emphasize that while BOLD-CVR offers promises as a surrogate biomarker for cerebrovascular health, following sport-concussion, multiple hemodynamic parameters can affect its relative measurements. Thus, multi-parametric approaches like the one proposed here should be considered, in order to better understand how head injuries can relate to changes in the vascular reactivity of the brain, post-injury, and avoid naïve interpretation of neuroimaging findings.
Introduction
The increasing rates of sport-related concussion (SRC)1–3 have raised concerns about the long-terms effects of head injuries on brain health. In recent years, neuroimaging research has shown observable changes in network connectivity4 and cerebral blood flow (CBF)5 associated with a history of concussion reported in active collegiate athletes. Despite these findings however, no study to date has explored the possible effects of SRC history on the neurovascular coupling processes responsible for regulation of flow and proper cerebral functions, which can be probed using cerebrovascular reactivity (CVR; reviewed here6–8) measurements.
Here, the effects of SRC history on vascular reactivity were explored using BOLD-CVR as a biomarker for vascular health. Additionally, complementary physiological modulators of the BOLD signal were studied in parallel to provide in-depth information about underlying parameters driving differences in BOLD-CVR between the groups.
Methods
A cohort of 63 collegiate football athletes with and without history of SRC were recruited to participate in this study. Of those, 32 (mean age=19±3years) reported a previous history of concussion (“HX”; range=[1,4]), and 31 age-matched athletes (mean age=19±2years) reported no history of head injury (“CTL”).
Subjects completed two 6 minutes boxcar respiratory breathing challenges (one hypercapnia, and one hyperoxia; Figure 1), induced using a feed-forward computerized gas delivery system (RespirActTM, Thornhill Research Inc., Toronto, ON). BOLD and CBF data were acquired simultaneously using a dual-echo pseudo-continuous arterial spin labeling sequence (pCASL)9: TR=4000ms, TE1/TE2=10/30ms, field of view=250x250mm, flip angle=90°, voxel size=3.9mm isotropic, post-labeling delay=1000ms, tagging duration=1.665s.10 Perfusion weighted images were extracted from the first echo (TE=10ms) using a linear surround subtraction between the control and tag images,11 and converted to physiological units (mL/100g/min) using the single-blood compartment model.12
BOLD- and ASL-based CVR maps were calculated as the percent change in signal from baseline, divided by the magnitude change in PETCO2 recorded during hypercapnia ($$$CVR={\triangle}Signal/{\triangle}P_{ET}CO_{2}$$$). Concurrent changes in BOLD and CBF were also used to model the voxelwise M parameter (representing the maximal percent change in BOLD from complete removal of deoxyhemoglobin), resting oxygen extraction fraction (OEF0), and cerebral blood volume (CBV0) maps (Figure 2), using the dual-calibration method13,14 and Blockley’s model.15
Subsequent to registration into standard MNI space,17 BOLD-CVR maps were compared between the groups using an ANCOVA in AFNI.18 Significant clusters (corrected for family-wise error from multiple comparisons based on Monte Carlo stimulations 10000 iterations)19,20 were then binarized into a region of interest (ROI), which served to extract several parameters of interest (Figure 3). M was broken down into its constituent parts,21 given that
$$M=A{\cdot}TE{\cdot}CBV_{0}{\cdot}B^{\beta}\cdot(1-\gamma_{v})^{\beta}$$
where A and B are constants, $$$\beta$$$ relates to vascular geometry, and $$$\gamma_{v}$$$ represents venous oxygenation. Here, we let OEF0 equal $$$(1-\gamma_{v})$$$ as an approximation for baseline metabolic effects on M (and BOLD). $$$\kappa$$$ was set to $$$M/(CBV_{0}{\cdot}OEF_{0}^{\beta})$$$ in order to represent a lumped parameter for the effects of [Hb], vessel morphology, and intra- and extra-vascular effects on the BOLD signal.22,23
Multiple linear and logistic regressions were then used to classify group differences in BOLD-CVR using the proposed parametrization, and identify dominant parameters driving differences in BOLD-based vascular reactivity.
Results & discussion
Voxelwise group analysis showed significantly higher BOLD-CVR (Figure 4; P<0.05 corrected) within the HX group, compared to CTLs. This may be interpreted as alterations in vascular reactivity in response to injury at the arteriolar levels.25
However, follow-up ROI analysis performed using the significant voxels highlighted above (P<0.00001; CTL=0.21±0.03%$$${\triangle}$$$BOLD/mmHg; HX=0.28±0.06%$$${\triangle}$$$BOLD/mmHg) showed significant group differences in ASL-CVR (P = 0.014), and M (P = 0.022), based on SRC history (Figure 5), suggesting that both vascular and hemodynamic factors may be underlying local differences in BOLD-CVR.
Thus, further parametrization of the M parameter is useful is making meaningful interpretation of these results from BOLD-CVR. Linear regressions showed that parameters from Figure 3, along with age,26 explained up to ~62% (P<0.00001) of the variance for BOLD-CVR, written as:
$$ CVR_{BOLD}=i\cdot0.5CVR_{ASL}\cdot0.9CBV_{0}\cdot1.3OEF_{0}\cdot1.0\kappa\cdot0.3age$$
,showing that metabolic effects (OEF0) may be driving the relationship between M and BOLD, in this sample.
Logistic regressions showed that regional BOLD-CVR alone could classify the groups based on SRC history at a success rate of 74%, while the multi-parametric approach using the proposed parameters in parallel improved the classification results up to 79%. More importantly, the same parameters driving the variance in BOLD-CVR were also driving the group differences identified in the ROI, based on standardized beta coefficients computed from the logistic regressions:
$$ log-odds=i\cdot0.4CVR_{ASL}\cdot0.6CBV_{0}\cdot0.8OEF_{0}\cdot0.7\kappa.$$
These findings provide novel evidence for the effectiveness of using a comprehensive model to study the effects of head injuries on CVR, while avoiding naïve interpretation of neuroimaging findings.
Acknowledgements
The authors would like to thank Mr. Don Brien and Mrs. Janet Mirtle-Stroman for their dedication and willingness to help with data collection.References
1. Marar M, McIlvain NM, Fields SK, et al. Epidemiology of concussions among United States high school athletes in 20 sports. Am J Sports Med2012; 40: 747–55.
2. Marshall SW, Guskiewicz KM, Shankar V, et al. Epidemiology of sports-related concussion in seven US high school and collegiate sports. Inj Epidemiol2015; 2: 13.
3. Daneshvar D, Nowinski C. The epidemiology of sport-related concussion. Clin Sport Med2011; 30: 1–17.
4. Churchill N, Hutchison MG, Leung G, et al. Changes in functional connectivity of the brain associated with a history of sport concussion: A preliminary investigation. Brain Inj2017; 31: 39–48.
5. Churchill N, Hutchison M, Richards D, et al. Brain structure and function associated with a history of sport concussion: a multi-modal MRI study. J Neurotrauma2016; 1–29.
6. Mandell DM, Han JS, Poublanc J, et al. Mapping cerebrovascular reactivity using blood oxygen level-dependent MRI in patients with arterial steno-occlusive disease: Comparison with arterial spin labeling MRI. Stroke2008; 39: 2021–2028.
7. Liu P, B. De Vis J, Lu H. Cerebrovascular reactivity (CVR) MRI with CO2 challenge: A technical review. Neuroimage2018; 1–12.
8. Fisher JA, Venkatraghavan L, Mikulis DJ. Magnetic Resonance Imaging–Based Cerebrovascular Reactivity and Hemodynamic Reserve. Stroke2018; STROKEAHA.118.021012.
9. Alsop DC, Detre JA, Golay X, et al. Recommended implementation of arterial spin-labeled Perfusion mri for clinical applications: A consensus of the ISMRM Perfusion Study group and the European consortium for ASL in dementia. Magn Reson Med2015; 73: 102–116.
10. Wu W, Buxton RB, Wong EC. Vascular space occupancy weighted imaging with control of residual blood signal and higher contrast-to-noise ratio. IEEE Trans Med Imaging2007; 26: 1319–27.
11. Germuska M, Merola A, Murphy K, et al. A forward modelling approach for the estimation of oxygen extraction fraction by calibrated fMRI. Neuroimage2016; 139: 313–323.
12. Wang J, Alsop DC, Song HK, et al. Arterial transit time imaging with flow encoding arterial spin tagging (FEAST). Magn Reson Med2003; 50: 599–607.
13. Gauthier CJ, Desjardins-Crépeau L, Madjar C, et al. Absolute quantification of resting oxygen metabolism and metabolic reactivity during functional activation using QUO2 MRI. Neuroimage2012; 63: 1353–1363.
14. Gauthier CJ, Hoge RD. Magnetic resonance imaging of resting OEF and CMRO2 using a generalized calibration model for hypercapnia and hyperoxia. Neuroimage2012; 60: 1212–1225.
15. Blockley NP, Griffeth VEM, Germuska MA, et al. An analysis of the use of hyperoxia for measuring venous cerebral blood volume: Comparison of the existing method with a new analysis approach. Neuroimage2013; 72: 33–40.
16. Zhang Y, Brady M, Smith S. Segmentation of Brain MR Images Through a Hidden Markov Random Field Model and the Expectation-Maximization Algorithm. 2001; 20: 45–57.
17. Jenkinson M, Beckmann CF, Behrens TEJ, et al. Fsl. Neuroimage2012; 62: 782–790.
18. Road WP, May R. AFNI : Software for Analysis and Visualization of Functional Magnetic Resonance Neuroimages. 1996; 173: 162–173.
19. Cox RW, Reynolds RC, Taylor PA. AFNI and Clustering: False Positive Rates Redux. bioRxiv. Epub ahead of print 2016. DOI: 10.1101/065862.
20. Cox RW, Chen G, Glen DR, et al. FMRI Clustering in AFNI: False-Positive Rates Redux. Brain Connect. Epub ahead of print 2017. DOI: 10.1089/brain.2016.0475.
21. Liu P, Hebrank AC, Rodrigue KM, et al. A comparison of physiologic modulators of fMRI signals.Hum Brain Mapp2013; 34: 2078–2088.
22. Boxerman JL, Bandettini PA, Kwong KK, et al. The Intravascular Contribution to fMRI Signal Change : Monte Carlo Modeling and Diffusion-Weighted Studies in Vivo.
23. Davis TL, Kwong KK, Weisskoff RM, et al. Calibrated functional MRI: mapping the dynamics of oxidative metabolism. Proc Natl Acad Sci U S A1998; 95: 1834–9.
24. Boxerman JL, Hamberg LM, Rosen BR, et al. Mr contrast due to intravascular magnetic susceptibility perturbations. Magn Reson Med1995; 34: 555–566.
25. Ellis MJ, Ryner LN, Sobczyk O, et al. Neuroimaging Assessment of Cerebrovascular Reactivity in Concussion: Current Concepts, Methodological Considerations, and Review of the Literature. Front Neurol2016; 7: 1–16.
26. De Vis JB, Hendrikse J, Bhogal A, et al. Age-related changes in brain hemodynamics; A calibrated MRI study. Hum Brain Mapp2015; 36: 3973–3987.
Figures

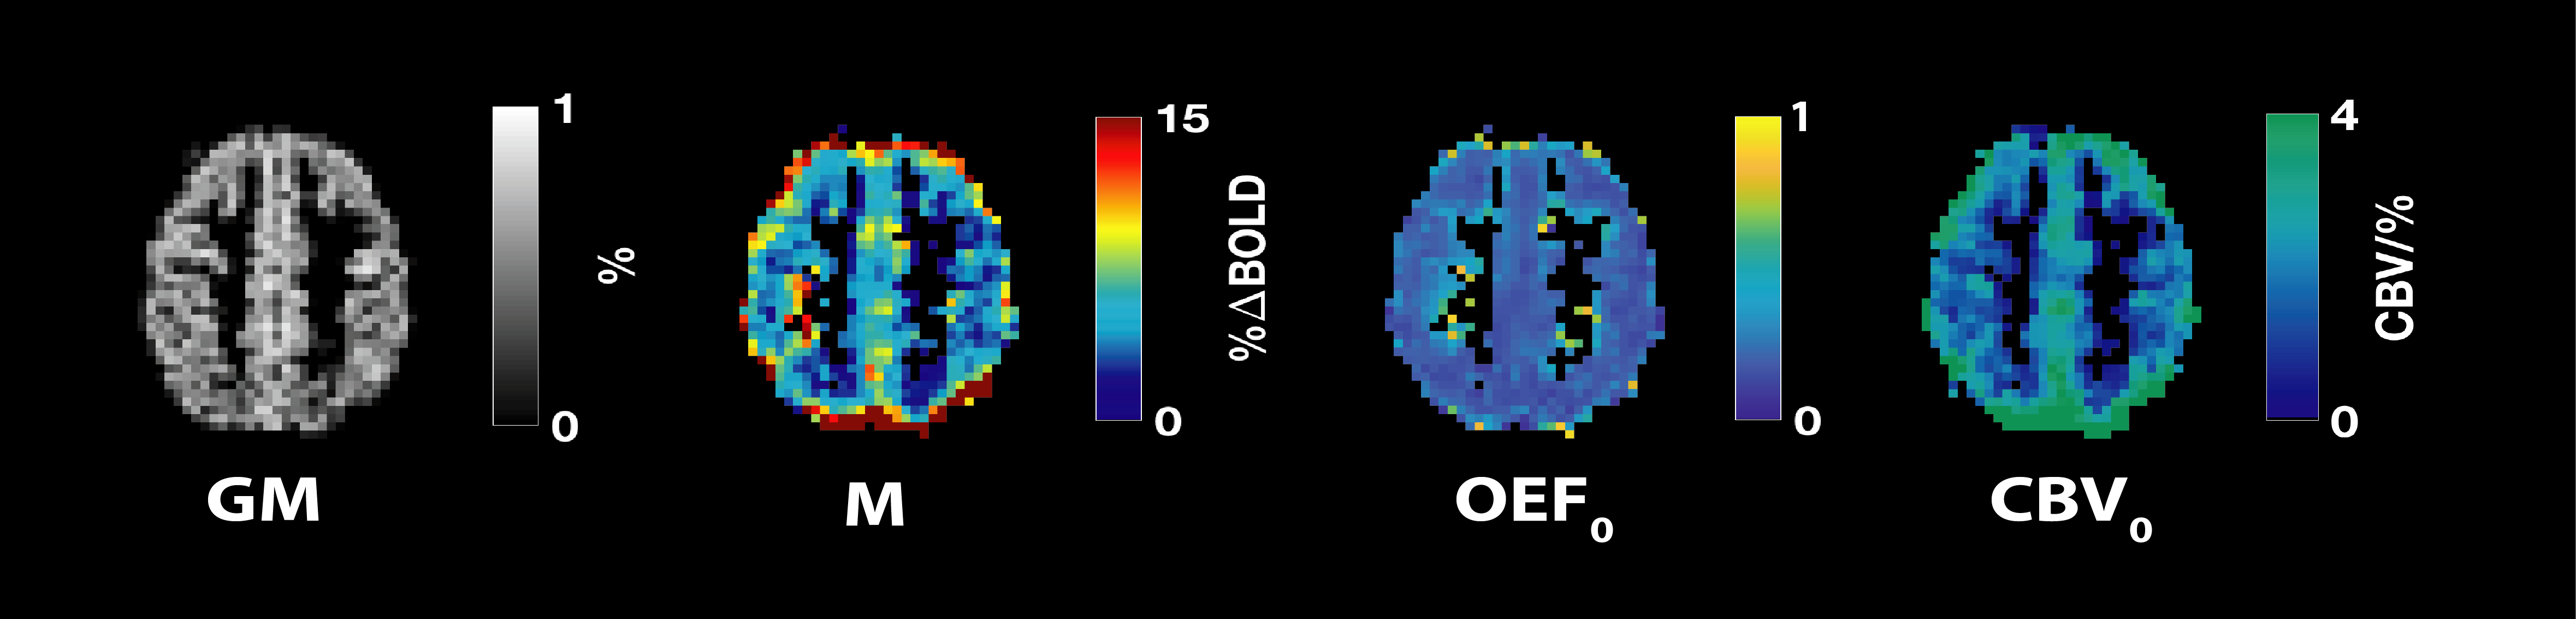
Figure 2. Sample maps computed using the dual-calibration method13,14 and Blockley’s model15 for M, OEF0 and CBV0
The voxelwise maps shown here are thresholded for grey-matter (GM) tissues only based on tissue segmentation of the high-resolution structural image using FAST.16
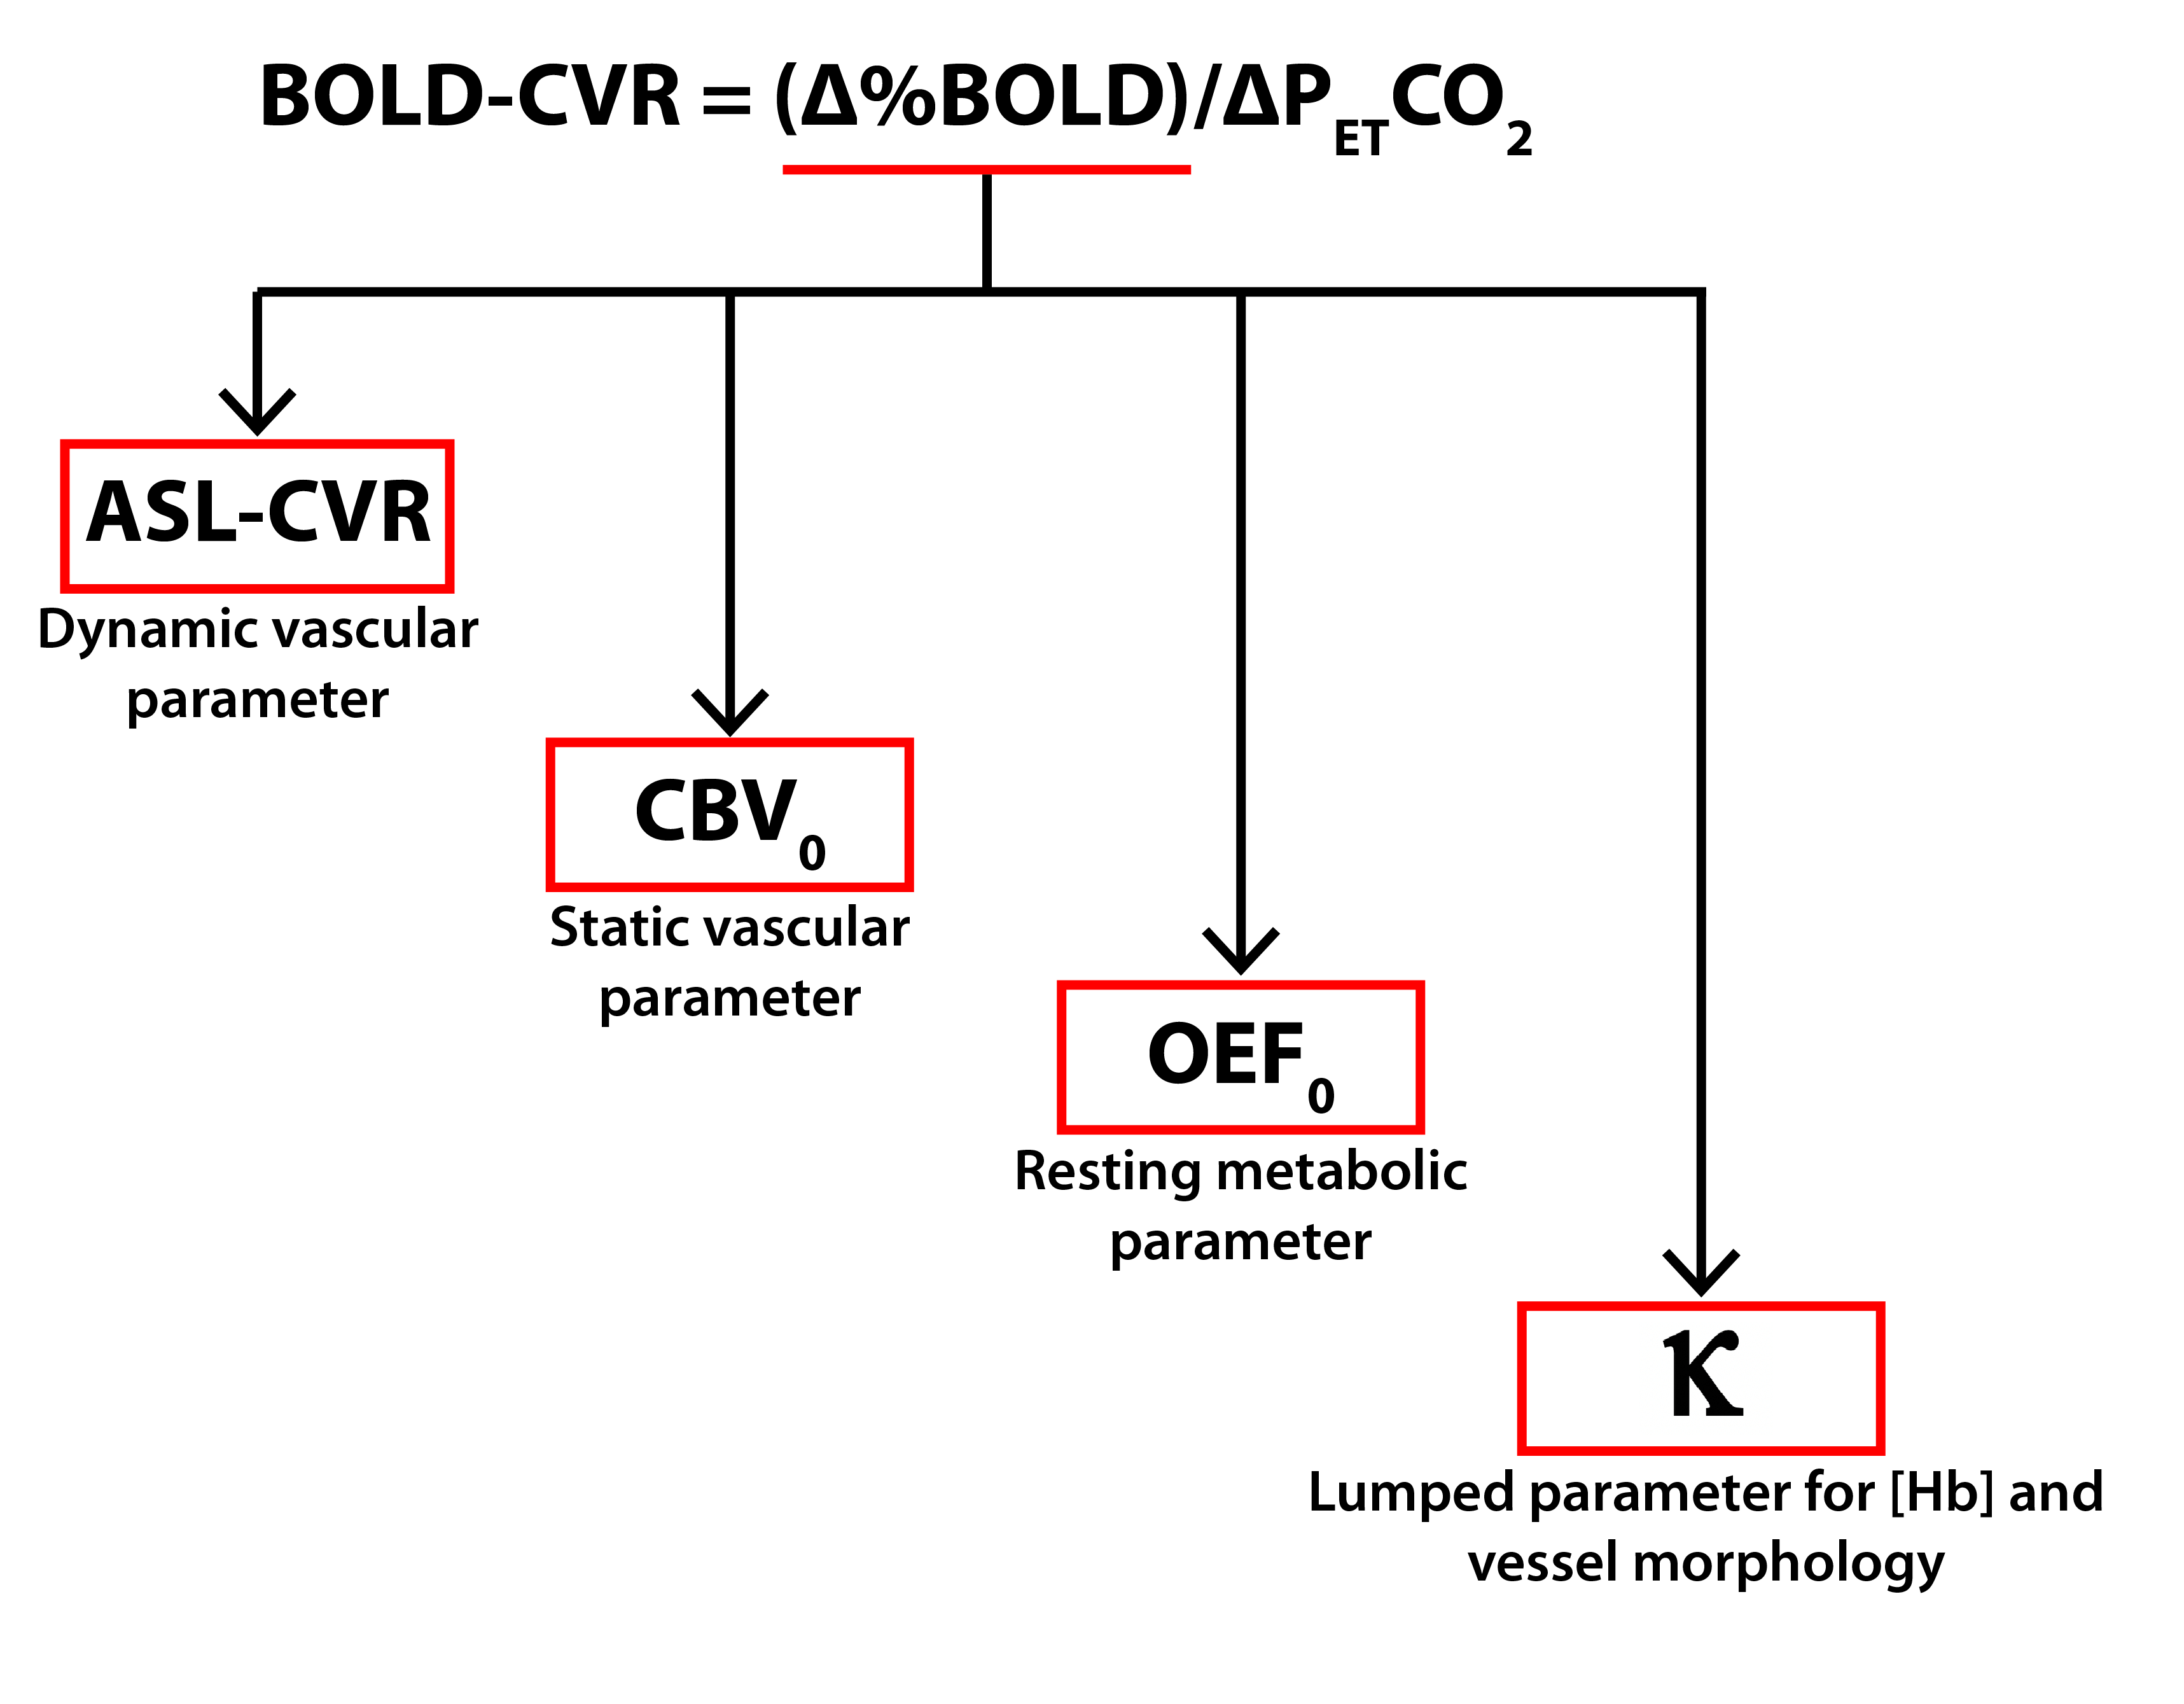
Figure 3. Proposed parametrization for the multi-parametric analysis of BOLD-CVR differences between the groups based on history of sport concussion
The following parameters were extracted from the region of interest highlighting group-differences in BOLD-CVR to explore the possible underlying vascular, metabolic and morphological effects driving the differences between the groups. Beta was set to 1.3, which is appropriate for a field strength of 3.0T.24
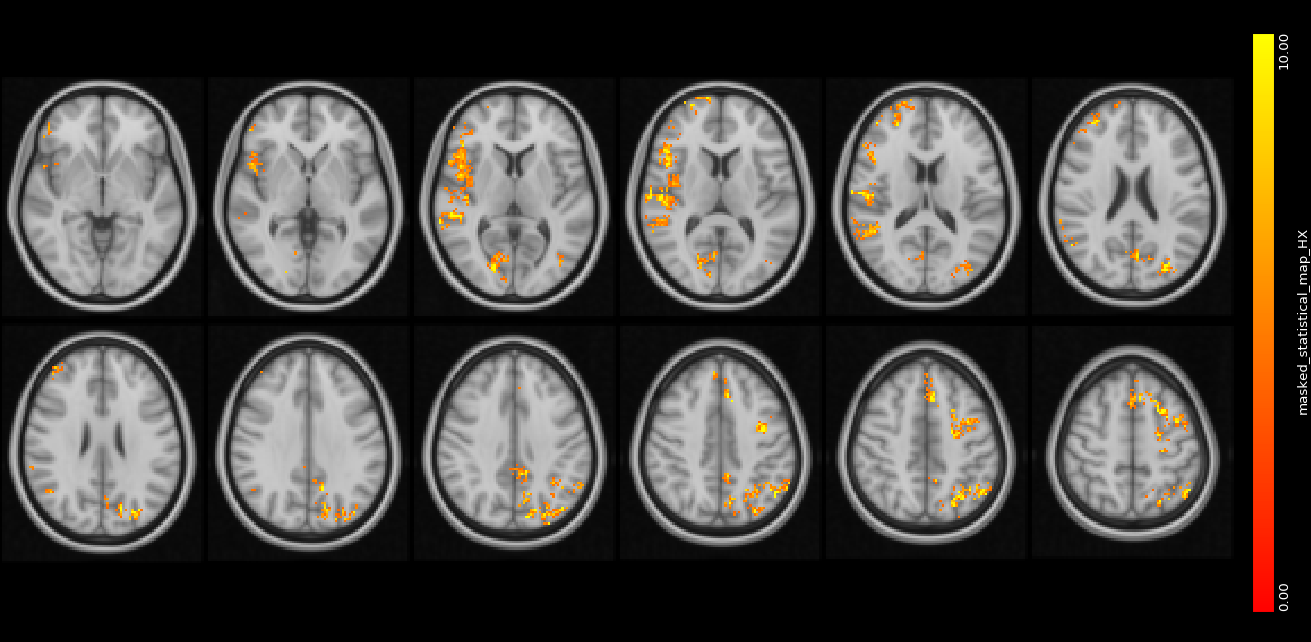
Figure 4. BOLD-CVR statistical results from the voxelwise group analysis between subjects with and without a history of concussion
Regions in yellow-orange show significantly increased BOLD-CVR in the HX group compared to the CTL subjects. The statistical image is corrected for multiple comparisons at P < 0.05 and overlaid onto the Montréal Neurological Institute template in 2-mm isotropic.

Figure 5. Bar plots of regional hemodynamic parameters tested post-hocbetween the groups
Values represent the mean ± standard deviation parameters extracted from the region of interest highlighted in Fig. 4. White bar plots represent the control group (CTL, no history of concussion), while black bars represent players with previous history of head injury (HX). Group parameters were tested using an ANCOVA with height, weight, age and resting end-tidal CO2 values as covariates.