2991
Progress towards direct in-vivo detection and mapping of neuronal activity1Biomedical Engineering, Sungkyunkwan University, Suwon, Korea, Republic of, 2Center for Neuroscience Imaging Research, Institute for Basic Science, Suwon, Korea, Republic of
Synopsis
Currently, despite much effort to probe the possibility of using MRI for directly detecting and mapping the neuronal activity, the results are inconclusive. Herein, to build upon our previous works, we present new results of using MRI to directly detect and map the neuronal activity with a high temporal resolution up to 4.5 ms. Using a low-flip angle gradient-echo line-scan method, we observed indications of propagating image intensity changes along an electrically stimulated live earthworm at 9.4 T.
Introduction
The direct detection of ultra-weak magnetic fields (≤1 nT) induced by the neuronal activity using MRI has been tried for many years 1,2. In vivo detection of such activities is challenging because of the low sensitivity and poor temporal resolution of MRI. With both successes 3–6 and failures 7–11 having been reported, the possibility to directly detect the neuronal activity is still controversial. To continue with our earlier work on direct detection of the neuronal signal from an in-vitro squid axon, here we present new results of using MRI to directly detect and map the neuronal activity from a live earthworm with high temporal resolution (4.5 ms).Methods
Line-scan-based FLASH Imaging Method:
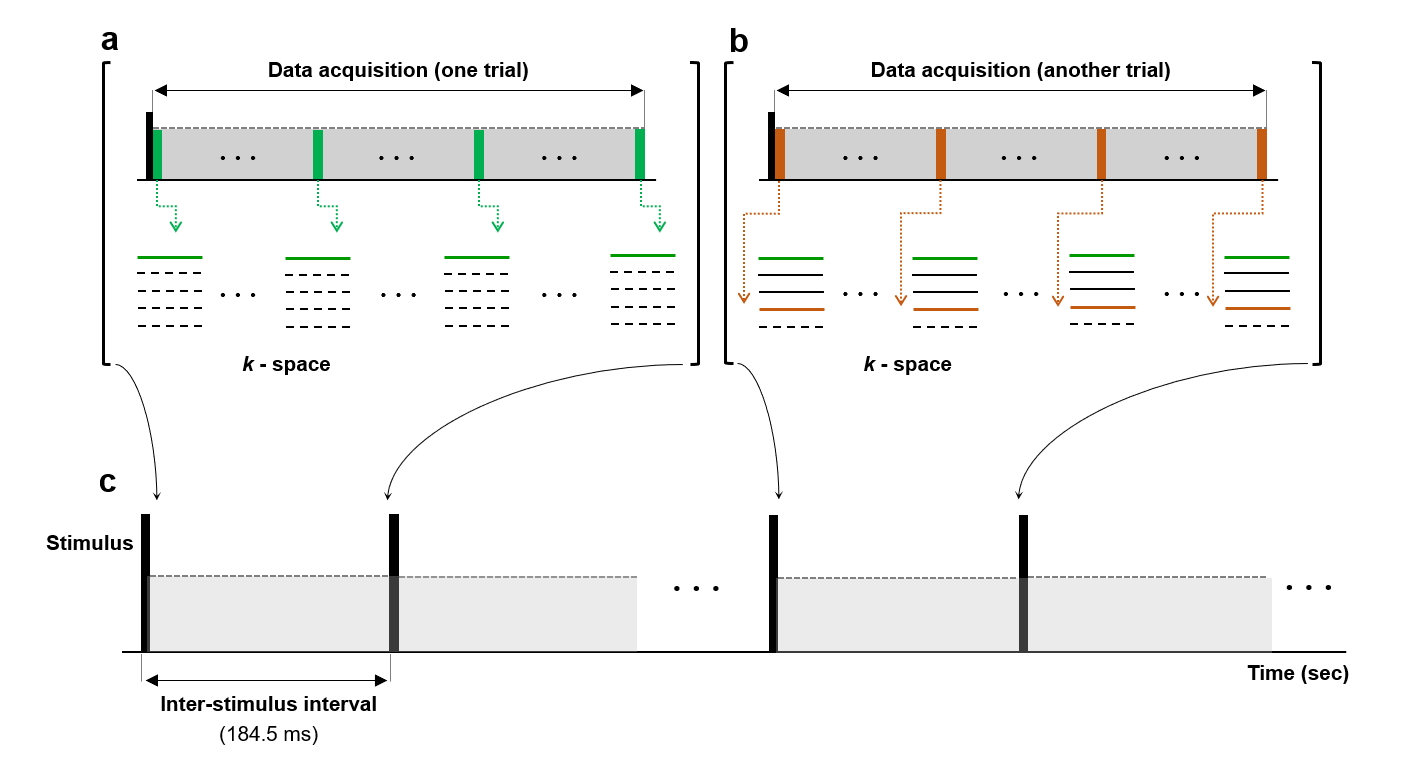
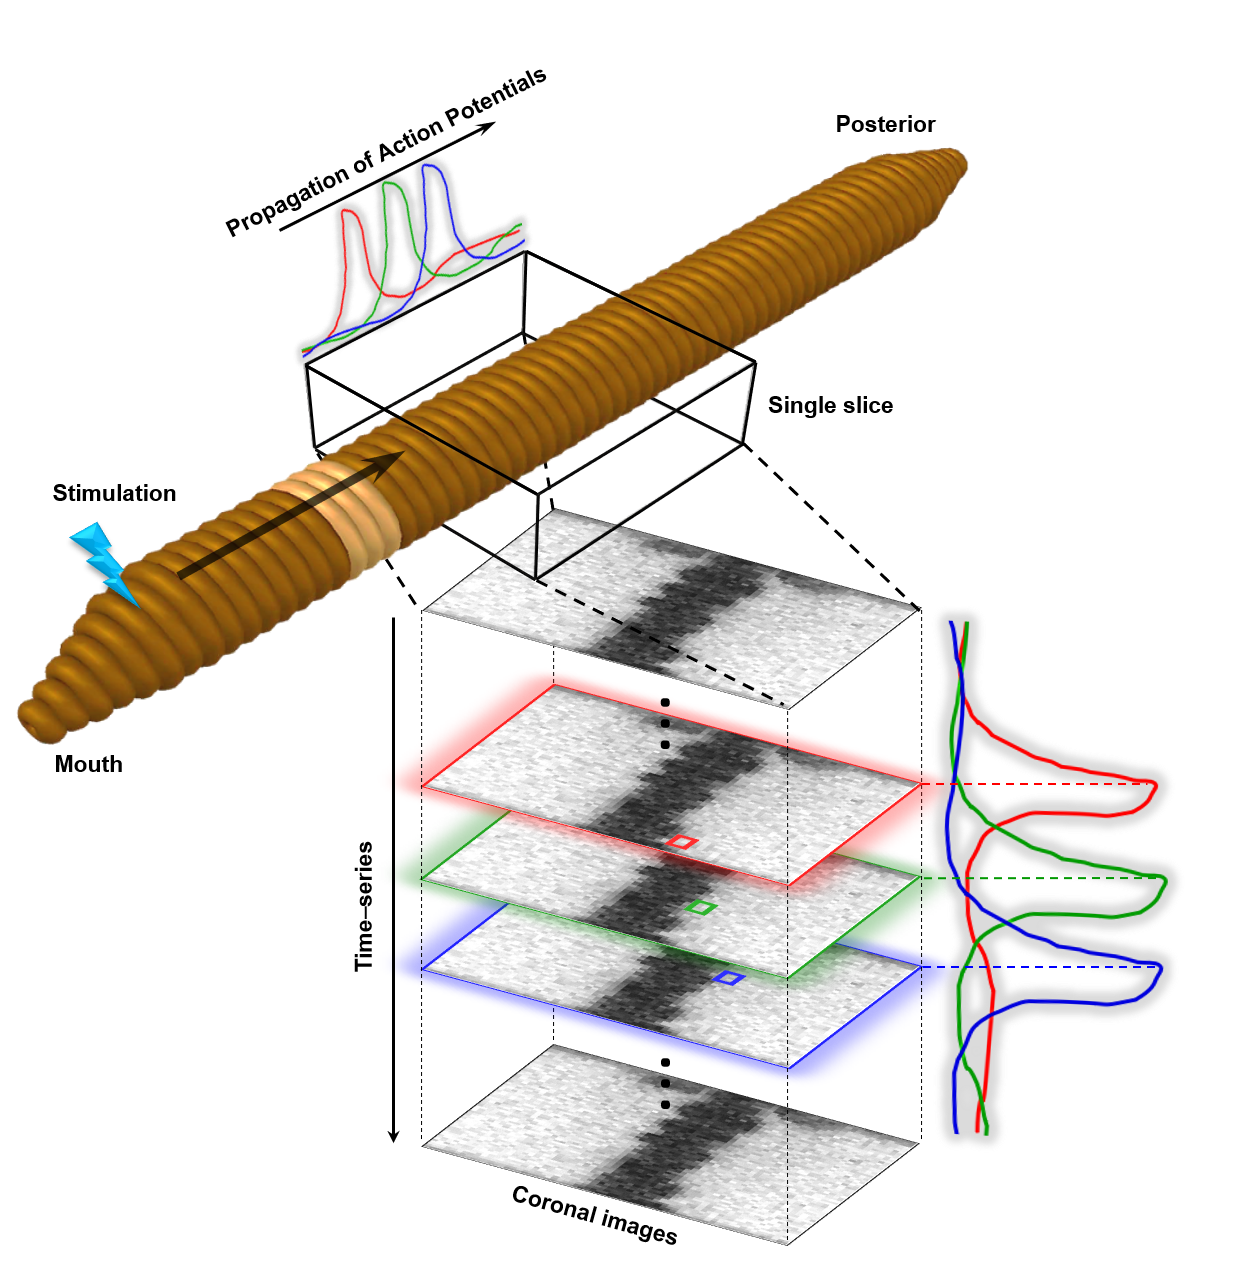
We rely on the idea that, if the MRI temporal resolution is increased up to the action potential duration in an event-related design, the transient effects of the action potentials can effectively be captured and coherently accumulated in repeated trials, thereby increasing the detection sensitivity and specificity. Following this principle, we combined the line-scanning method 12 and fast low-angle shot (FLASH) imaging to acquire the same k-space lines continuously during each of the repetitive trials. This led to a series of 2D images with the temporal resolution of 4.5 ms. The schematic drawing of this method is shown in Figure 1 and Figure 2.
Experiments:
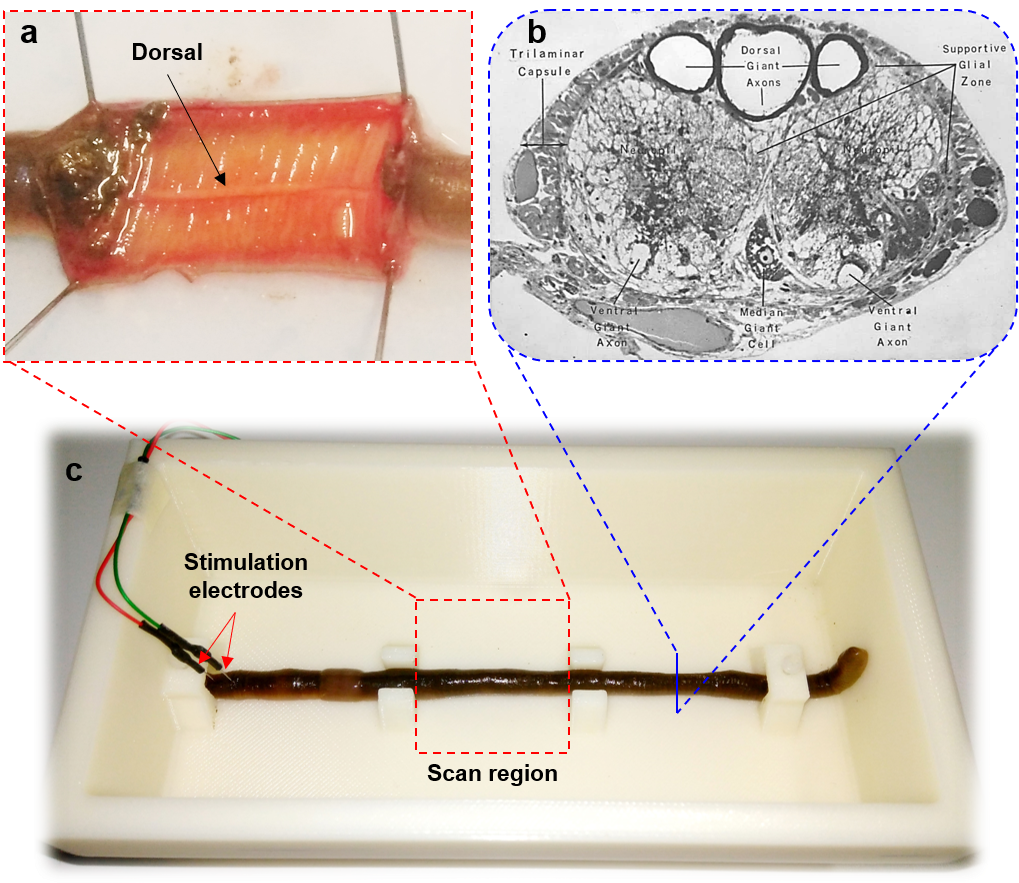
An earthworm which has a cross-sectional diameter of ~ 5 mm was placed in a 10% ethanol solution for 10 - 15 minutes to be fully anesthetized. The anesthetized earthworm was then fixed on a substrate of a 3D-printed phantom which contained 5% ethanol solution for maintaining the anesthesia during the experiments. The coronal images of the earthworm were taken on a 9.4-T Bruker scanner (BioSpec 94/30, Ettlingen, Germany). A pair of the needle electrodes were pinned through the head of the earthworm for electrical stimulation. The earthworm’s body was oriented parallel to the B0 field inside the scanner and the center of scan region had a distance of 6 cm from the negative electrode (Fig.3). To see the propagation effect of the action potential along the head-to-tail direction, a coronal slice was taken including the whole earthworm body in the scan region.
Scan parameters were: TR/TE = 4.5/2.0 ms, slice thickness = 6 mm, number of k-space repetitions = 41, flip angle = 3°.The temporal resolution was the same as TR. A time series of 41 2D-images were acquired with the spatial resolution = 0.22 mm2.
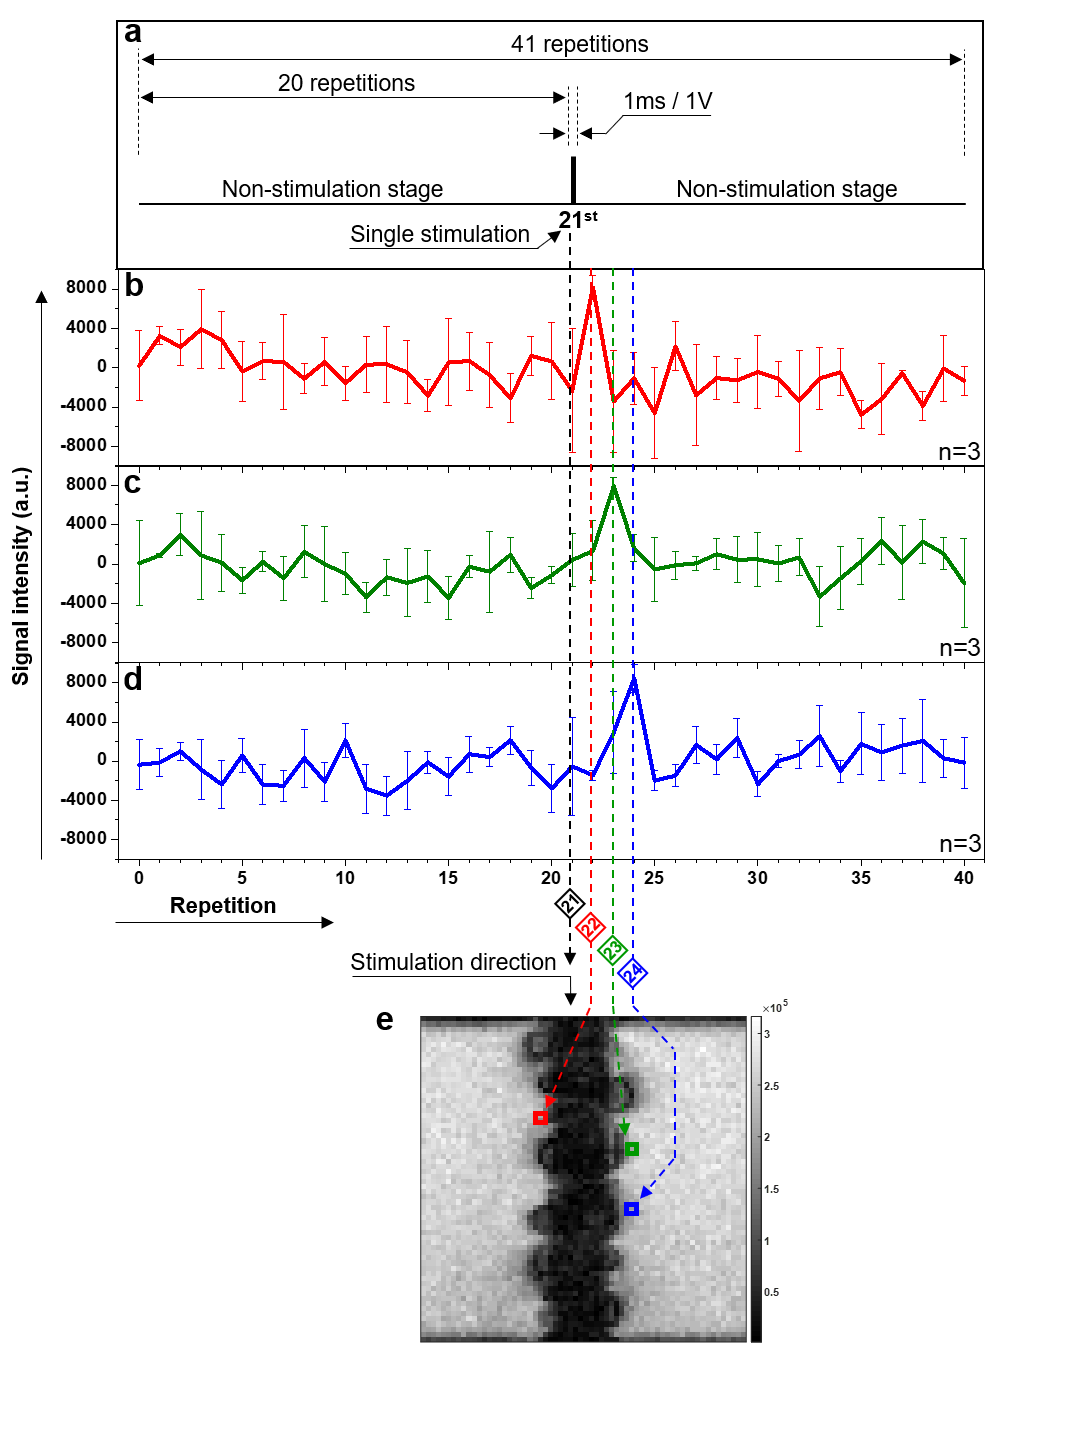
The stimulation design consisted of three consecutive periods including 90 ms (off) – 1 ms (on) – 93.5 ms (off) with an applied voltage of 1V. It corresponds to the segment order of 20 (off) – 1 (on) – 20 (off) in terms of repetitions. This means the stimulation was applied at beginning of the 21st repetition.
Data Processing and Analysis:
Images were reconstructed by a home-built MATLAB program (Ver.9.4.0, R2018a).
Results
Figure 4 shows the experimental results of neuronal response detection in the live earthworm. Results from three separate experiments were averaged (n=3). The region-of-interest (ROI) was extracted from both sides of the earthworm’s body area in the time-series images. These ROI data show the change of signal intensity over time or the repetition index. Signal increases of a factor of ~2 after stimulation appeared at the 22nd – 24th repetitions (Fig. 4b-d, respectively) in the three ROIs located progressively farther away from the stimulating electrodes (Fig. 4e).Discussion and Conclusion
We demonstrated sequential image intensity changes that appeared to correspond with the propagation of the action potential from the stimulation electrodes in a live worm. Our in vivo results suggest that efficient detection of neuronal activity might be possible by increasing the temporal resolution of MRI through the combination of the line-scanning method and FLASH imaging. The exact mechanism of MRI signal change and investigation of quantitative detection sensitivity remain as a subject of future work.Acknowledgements
This work was supported by IBS-R015-D1.References
1. Bodurka J, Bandettini PA. Toward direct mapping of neuronal activity: MRI detection of ultraweak, transient magnetic field changes. Magn Reson Med. 2002 Jun 7;47(6):1052–8.
2. Bianciardi M, Di Russo F, Aprile T, et al. Combination of BOLD-fMRI and VEP recordings for spin-echo MRI detection of primary magnetic effects caused by neuronal currents. Magn Reson Imaging. 2004 Dec 1;22(10):1429–40.
3. Kamei H, Iramina K, Yoshikawa K, et al. Neuronal current distribution imaging using magnetic resonance. IEEE Trans Magn. 1999 Sep;35(5):4109–11.
4. Chow LS, Cook GG, Whitby E, et al. Investigating direct detection of axon firing in the adult human optic nerve using MRI. NeuroImage. 2006 Apr 15;30(3):835–46.
5. Park TS, Lee SY, Park J-H, et al. Observation of the fast response of a magnetic resonance signal to neuronal activity: a snail ganglia study. Physiol Meas. 2006;27(2):181.
6. Petridou N, Plenz D, Silva AC, et al. Direct magnetic resonance detection of neuronal electrical activity. Proc Natl Acad Sci. 2006 Oct 24;103(43):16015–20.
7. Singh M. Sensitivity of MR phase shift to detect evoked neuromagnetic fields inside the head. In: IEEE Conference on Nuclear Science Symposium and Medical Imaging. 1992. (2) .1286–8.
8. Chu R, de Zwart JA, van Gelderen P, et al. Hunting for neuronal currents: absence of rapid MRI signal changes during visual-evoked response. NeuroImage. 2004 Nov 1;23(3):1059–67.
9. Parkes LM, Lange FP de, Fries P, et al. Inability to directly detect magnetic field changes associated with neuronal activity. Magn Reson Med. 2007 Feb 1;57(2):411–6.
10. Tang L, Avison MJ, Gatenby JC, et al. Failure to direct detect magnetic field dephasing corresponding to ERP generation. Magn Reson Imaging. 2008 May 1;26(4):484–9.
11. Luo Q, Lu H, Lu H, et al. Physiologically evoked neuronal current MRI in a bloodless turtle brain: Detectable or not? NeuroImage. 2009 Oct 1;47(4):1268–76.
12. Yu X, Qian C, Chen D, et al. Deciphering laminar-specific neural inputs with line-scanning fMRI. Nat Methods. 2014 Jan;11(1):55–8.
13. Coggeshall RE. A fine structural analysis of the ventral nerve cord and associated sheath of Lumbricus terrestris L. J Comp Neurol. 1965 Dec 1;125(3):393–437.
Figures