2988
Efficient Quantitative MT (qMT) imaging using 3D Segmented EPI readout Variable Flip angle Magnetization Transfer (EP-vfMT) methods1Department of Biomedical Engineering, Hankuk University of Foreign Studies, Yong-in, Korea, Republic of, 2Imaging Institute, Cleveland Clinic Foundation, Cleveland, OH, United States
Synopsis
In this study, newly proposed combined consecutive qMT acquisition scheme was compared with individual MT scan method. Proposed method provides a similar but slightly improved qMT map with slightly higher MT saturation in a clinically feasible scan time. The effect of varying NEX on signal variation of F-map was also investigated. These results suggest that NEX with 2 or 3 is appropriate for the patient scan when considering acquisition time. The EP-vfMT F-map shows high reproducibility (averaged voxel-wise correlation was 0.94 ± 0.03, n=5). These features make the proposed method appealing for clinical neuroimaging applications.
Introduction
Quantitative MT(qMT)method can quantify distinct tissue characteristics by using multiple sets of MT data. Several studies have found that, among the measured quantified tissue characteristics bound-pool fraction map (F-map) has a good sensitivity to measure changes in myelin concentration within the brain1-4. Because of the much longer acquisition time and much higher SAR, however, neurological disease patient studies using qMT are not well utilized yet. Recently, we have proposed Segmented EPI readout Variable Flip angle Magnetization Transfer (EP-vfMT) as a new qMT acquisition method and demonstrated the clinical feasibility5-6. The method utilizes a 3D segmented EPI readout and variable flip angle to reduce scan time and SAR efficiently.
In general, roughly ten individual MT scans with different combinations of MT RF flip angles and offset frequencies are conducted for qMT map calculation. In terms of workflow, repeating ten individual MT scan with different MT parameters is not easy to the operator particularly with patient scans. If the multiple qMT scans could be combined into one or two scan, the workflow would be easier.
For clinical use, reproducibility is an important feature. In qMT, tissue characteristics are estimated by fitting. In terms of reproducibility and accurate signal fitting, adequate SNR is essential. However, the effect of SNR on image quality of qMT has not been investigated yet.
In this work, we have 1) proposed a more efficient qMT acquisition scheme and 2) explored the image quality of qMT map as a function of a number of excitation (NEX) to gain some insight into the optimal average number. Additionally, 3) intra-session reproducibility was estimated using a scan-reposition-rescan protocol.
Methods
Data were collected from an ex-vivo, and 5 healthy controls (IRB approved) at 3T (Prisma, Siemens).
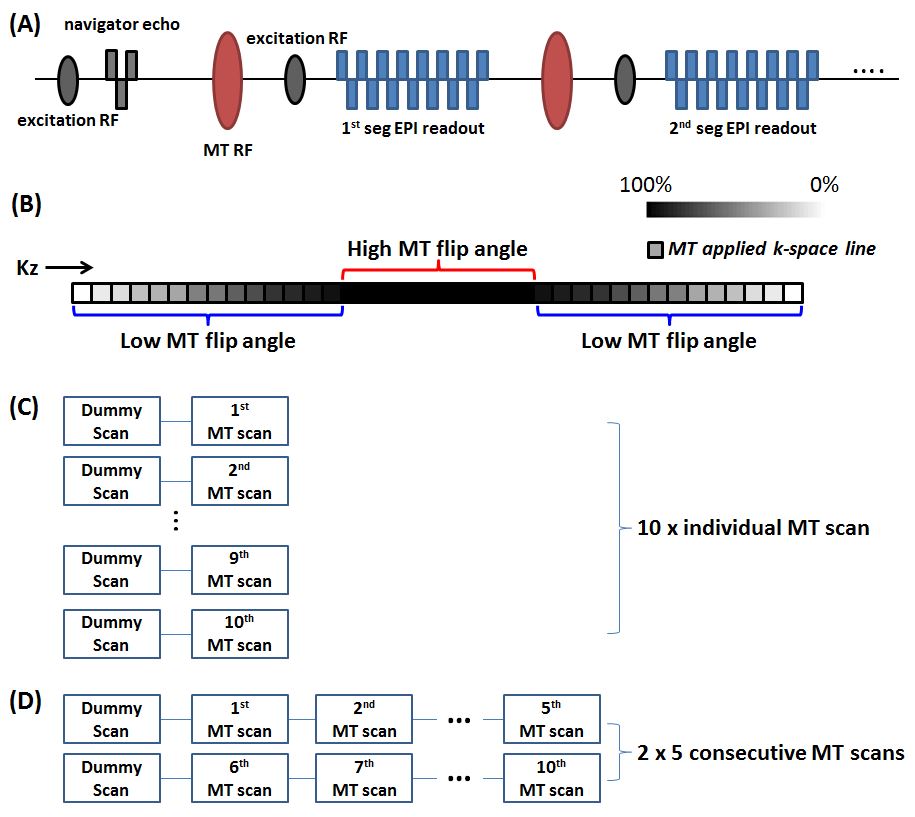
The EP-vfMT sequence diagrams are shown in Fig. 1(A). To cover a 3D volume rapidly and reduce EPI-associated artifacts, a 3D segmented EPI readout was utilized. In order to reduce SAR while maintaining similar MT saturation to conventional MT, the flip angle of the MT RF was varied as a function of the slice-encoding index (Fig. 1(B)).
MR scans: Two different qMT acquisition schemes shown in Figs. 1(C-D) were compared. Using EP-vfMT method data were acquired with 10 different combinations of MT RF flip angles (212, 434, 843°) and offset frequencies (1000, 2500, 3500, 5000, 7500, 15000 Hz). The scan parameters are: 1.5×1.5×4mm3, NEX = 1-8, 200 dummy scans, TR = 35 ms and TA = 2:59/NEX.
To generate the bound pool fraction map, the acquired data is fitted using a non-negative least-squares fitting method proposed by Cabana et al7. An MP2RAGE8 acquisition was acquired to provide T1 maps.
Data analysis: After generating F-maps from each method, ROI analysis was performed at manually defined ROIs (splenium of the corpus callosum and internal capsule). Means and standard deviations were estimated within ROIs.
Reproducibility: To test scan-reposition-rescan reproducibility, the EP-vfMT with proposed acquisition scheme (Fig. 1(D), NEX=2) was acquired twice (on different days) from five controls.
Results
A qualitative comparison of the proposed combined consecutive qMT acquisition scheme against individual acquisition is shown in Fig. 2. When compared, the two maps reveal qualitatively similar signal distributions across the slices but the image quality is slightly improved in the proposed acquisition.
Figure 3 shows the amount of MT saturation levels affected by the MT acquisition scheme. When compared to the proposed combined acquisition scheme it demonstrated similar but slightly higher MT saturation level. However, the difference was not significant (p=0.38 in in-vivo and 0.41 in ex-vivo).
Figure 4 shows the effect of NEX in the proposed qMT method. In all maps, higher bound pool fraction is observed in regions with high myelin density (genu, splenium, and internal capsule). As the NEX increased, the image quality of the F-map improved.
The measured standard deviations of F-map at each ROI are shown in Figure 5. As the NEX increased, the signal variation in the F-map decreased.
A result of the reproducibility test using the proposed method demonstrated high reproducibility (averaged voxel-wise correlation was 0.94±0.03, n=5).
Discussions and Conclusions
Compared to the individual acquisition scheme, the proposed combined consecutive qMT method provides a similar but slightly improved qMT map with slightly higher MT saturation in a clinically feasible scan time. The combined consecutive scan might make qMT workflow easier.
The effect of varying NEX on the signal variation of F-map was investigated. These results suggest that NEX with 2 or 3 is appropriate for the patient scan when considering acquisition time together.
The EP-vfMT shows high reproducibility. These features make the proposed method appealing for clinical neuroimaging applications.
Acknowledgements
This work was supported by Cleveland Clinic and National Research Foundation of Korea (NRF-2017R1C1B1008345). Author gratefully acknowledges technical support by Siemens Medical Solutions. We thank Tobias Kober and Bénédicte Maréchal of Siemens Medical Solutions for WIP900BReferences
[1] Henkelman, R.M., Huang, X., Xiang, Q.S., Stanisz, G.J., Swanson, S.D., Bronskill, M.J., 1993. Quantitative interpretation of magnetization transfer. Magn Reson Med 29, 759-766.
[2] Pike, G.B., 1996. Pulsed magnetization transfer contrast in gradient echo imaging: a two-pool analytic description of signal response. Magn Reson Med 36, 95-103.
[3] Sled, J.G., Pike, G.B., 2000. Quantitative interpretation of magnetization transfer in spoiled gradient echo MRI sequences. J Magn Reson 145, 24-36.
[4] Sled, J.G., Pike, G.B., 2001. Quantitative imaging of magnetization transfer exchange and relaxation properties in vivo using MRI. Magn Reson Med 46, 923-931.
[5] Se-Hong Oh and Mark J. Lowe, Segmented EPI readout Variable Flip-angle Magnetization Transfer (EP-vfMT) imaging for 7 T quantitative MT (qMT) Imaging, ISMRM 2017, #4738
[6] Se-Hong Oh, Dongmyung Shin, Ken Sakaie, Daniel Ontaneda and Mark J. Lowe, Quantitative MT (qMT) imaging of the Whole Brain: Conventional 3D MT vs. 3D EP-vfMT methods, ISMRM 2018, #5290
[7] Jean-François Cabana, Ye Gu, Mathieu Boudreau, Ives R Levesque, Yaaseen Atchia, John G. Sled, Sridar Narayanan, Douglas L. Arnold, G. Bruce Pike, Julien Cohen-Adad, Tanguy Duval, Manh-Tung Vuong and Nikola Stikov, 2016, Quantitative magnetization transfer imaging made easy with qMTLab: Software for data simulation, analysis, and visualization, Concepts in Magnetic resonance Part A, 44A, 263–277
[8] Marques, J. P., Kober, T., Krueger, G., van der Zwaag, W., Van de Moortele, P. F. & Gruetter, R. MP2RAGE, a self bias-field corrected sequence for improved segmentation and T1-mapping at high field. Neuroimage 2010; 49(2):1271-1281.
Figures