2986
Cellular correlates of multi-parametric magnetic resonance imaging in the human cerebral cortex1Institute of Medical Sciences, University of Toronto, Toronto, ON, Canada, 2Bloorview Research Institute, East York, ON, Canada, 3CUBRIC, School of Psychology, Cardiff University, Cardiff, United Kingdom, 4Department of Psychology and Psychiatry, University of Toronto, Toronto, ON, Canada
Synopsis
To investigate the neurobiological underpinnings of common parametric MRI maps, including T1, T2 relaxation, myelin water fraction (MWF), magnetization transfer ratio (MTR), and synthetic T1w/T2w ratio, using a virtual histology approach. Simply put, we relate inter-regional profiles of these MR measures to inter-regional profiles of cell- specific gene-expression profiles. We observe a relationship between oligodendrocyte- specific gene-expression with profiles of T2, MWF, synthetic T1w/T2w – interpreted as sensitive to intra-cortical myelination. Lastly, MTR was not correlated with oligodendrocyte specific profile, rather with profiles of dendritic arbour enriched gene sets (CA1 pyramidal, and ependymal cells).
INTRODUCTION
A key challenge in neuroimaging is bridging the gap between in vivo magnetic resonance imaging (MRI) and ex vivo histology. It is essential we understand the neurobiological origins of MRI-derived metrics, if we are to interpret variations within these metrics such as in aging or a clinical context. The human cerebral cortex has a complex cellular composition, both in terms of cell types (neurons & glia) and neuropil (dendrites, axons), the latter found in between cell bodies. Quantitative parametric magnetic resonance imaging (MRI) such as T1 relaxation, T2 relaxation, & myelin water fraction (MWF), and other measures such as magnetization transfer ratio (MTR) and T1w/T2w ratio have been shown to be sensitive to a variety of cellular characteristics, such myelin or iron content within the human cerebral cortex.1 There is still some controversy regarding the specificity of MR measures to cellular components such as myelin.2 Here, we explore the neurobiological underpinnings of inter-regional variations in several MRI measures (T1, T2, MWF, MTR, synthetic T1w/T2w) across the human cerebral cortex using a virtual histology approach.3METHODS
Demographics: Data from 437 male participants (mean age [sd] = 19.55 [0.84]) from the Avon Longitudinal Study of Parents and Children (ALSPAC) were analysed for this report (from a total of 507 participants scanned).4
Data acquisition: MRI in the form of Multicomponent driven equilibrium single pulse observation of T1 and T2 (mcDESPOT), MT imaging, and a T1w sequence (inversion-recovery sequence separate from mcDESPOT) were acquired on a GE 3T scanner.
Image processing: mcDESPOT scans were acquired using a 3D fast spoiled gradient recall (FSPGR) with a resolution of 1.72 x 1.72 x 1.7 mm3, and used to derive maps of quantitative T1, T2, MWF. MT ratio (MTR) was calculated by using a scan with (MT-on) and without an MT pulse (MT-off) at a frequency offset of 2 kHz and at a resolution of 1.9 mm3 isotopic. Synthetic T1w and synthetic T2w maps were derived from the quantitative single T1,T2 maps (from mcDESPOT). MR maps are then registered to T1w native space using affine, low deformation SyN ANTS registration5 following a rigid registration with FSL FLIRT.6
T1w scans were passed through the FreeSurfer (v6.0.0) recon cortical parcellation pipeline to obtain native maps of cortical regions in the Desikan Killiany (DK) atlas.7 MR-derived measures such as T1, T2, MWF, MTR, and synthetic T1w/T2w ratio are then extracted from the middle of the cortical region across the 34 regions of the DK atlas.
Analyses: A virtual histology approach (described in Shin et al. Cerebral Cortex, 2018)3 is used to relate inter-regional variation in MR measures with inter-regional variation in cell specific gene expression profiles across the cerebral cortex. Gene expression data were used from the Allen Human Brain Atlas, and cell-specific genes were identified from single cell RNA-sequencing data.8
RESULTS
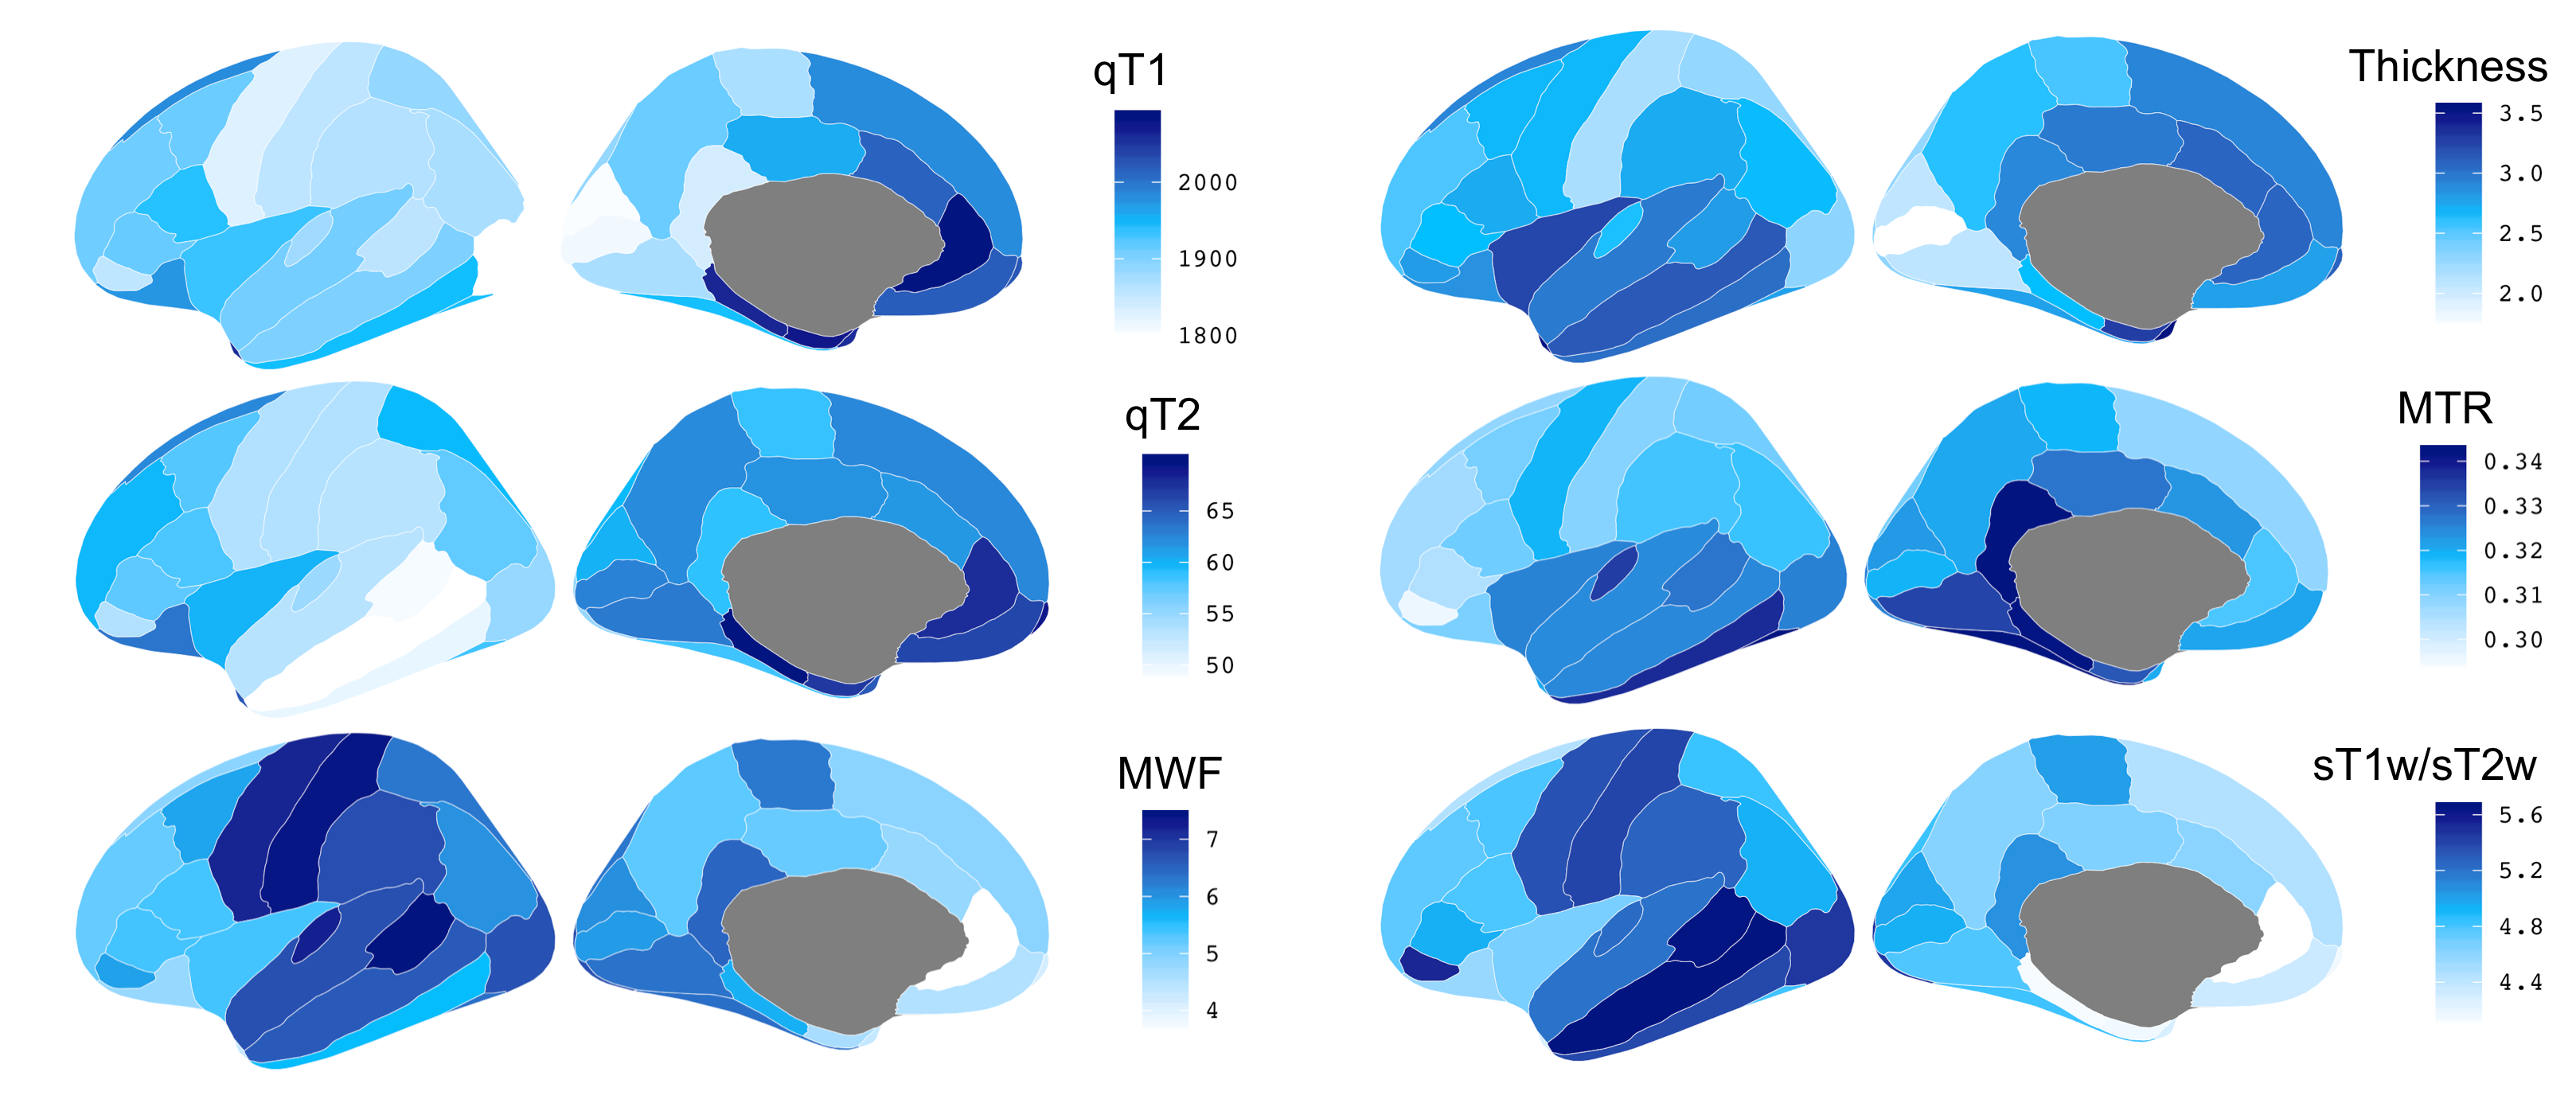
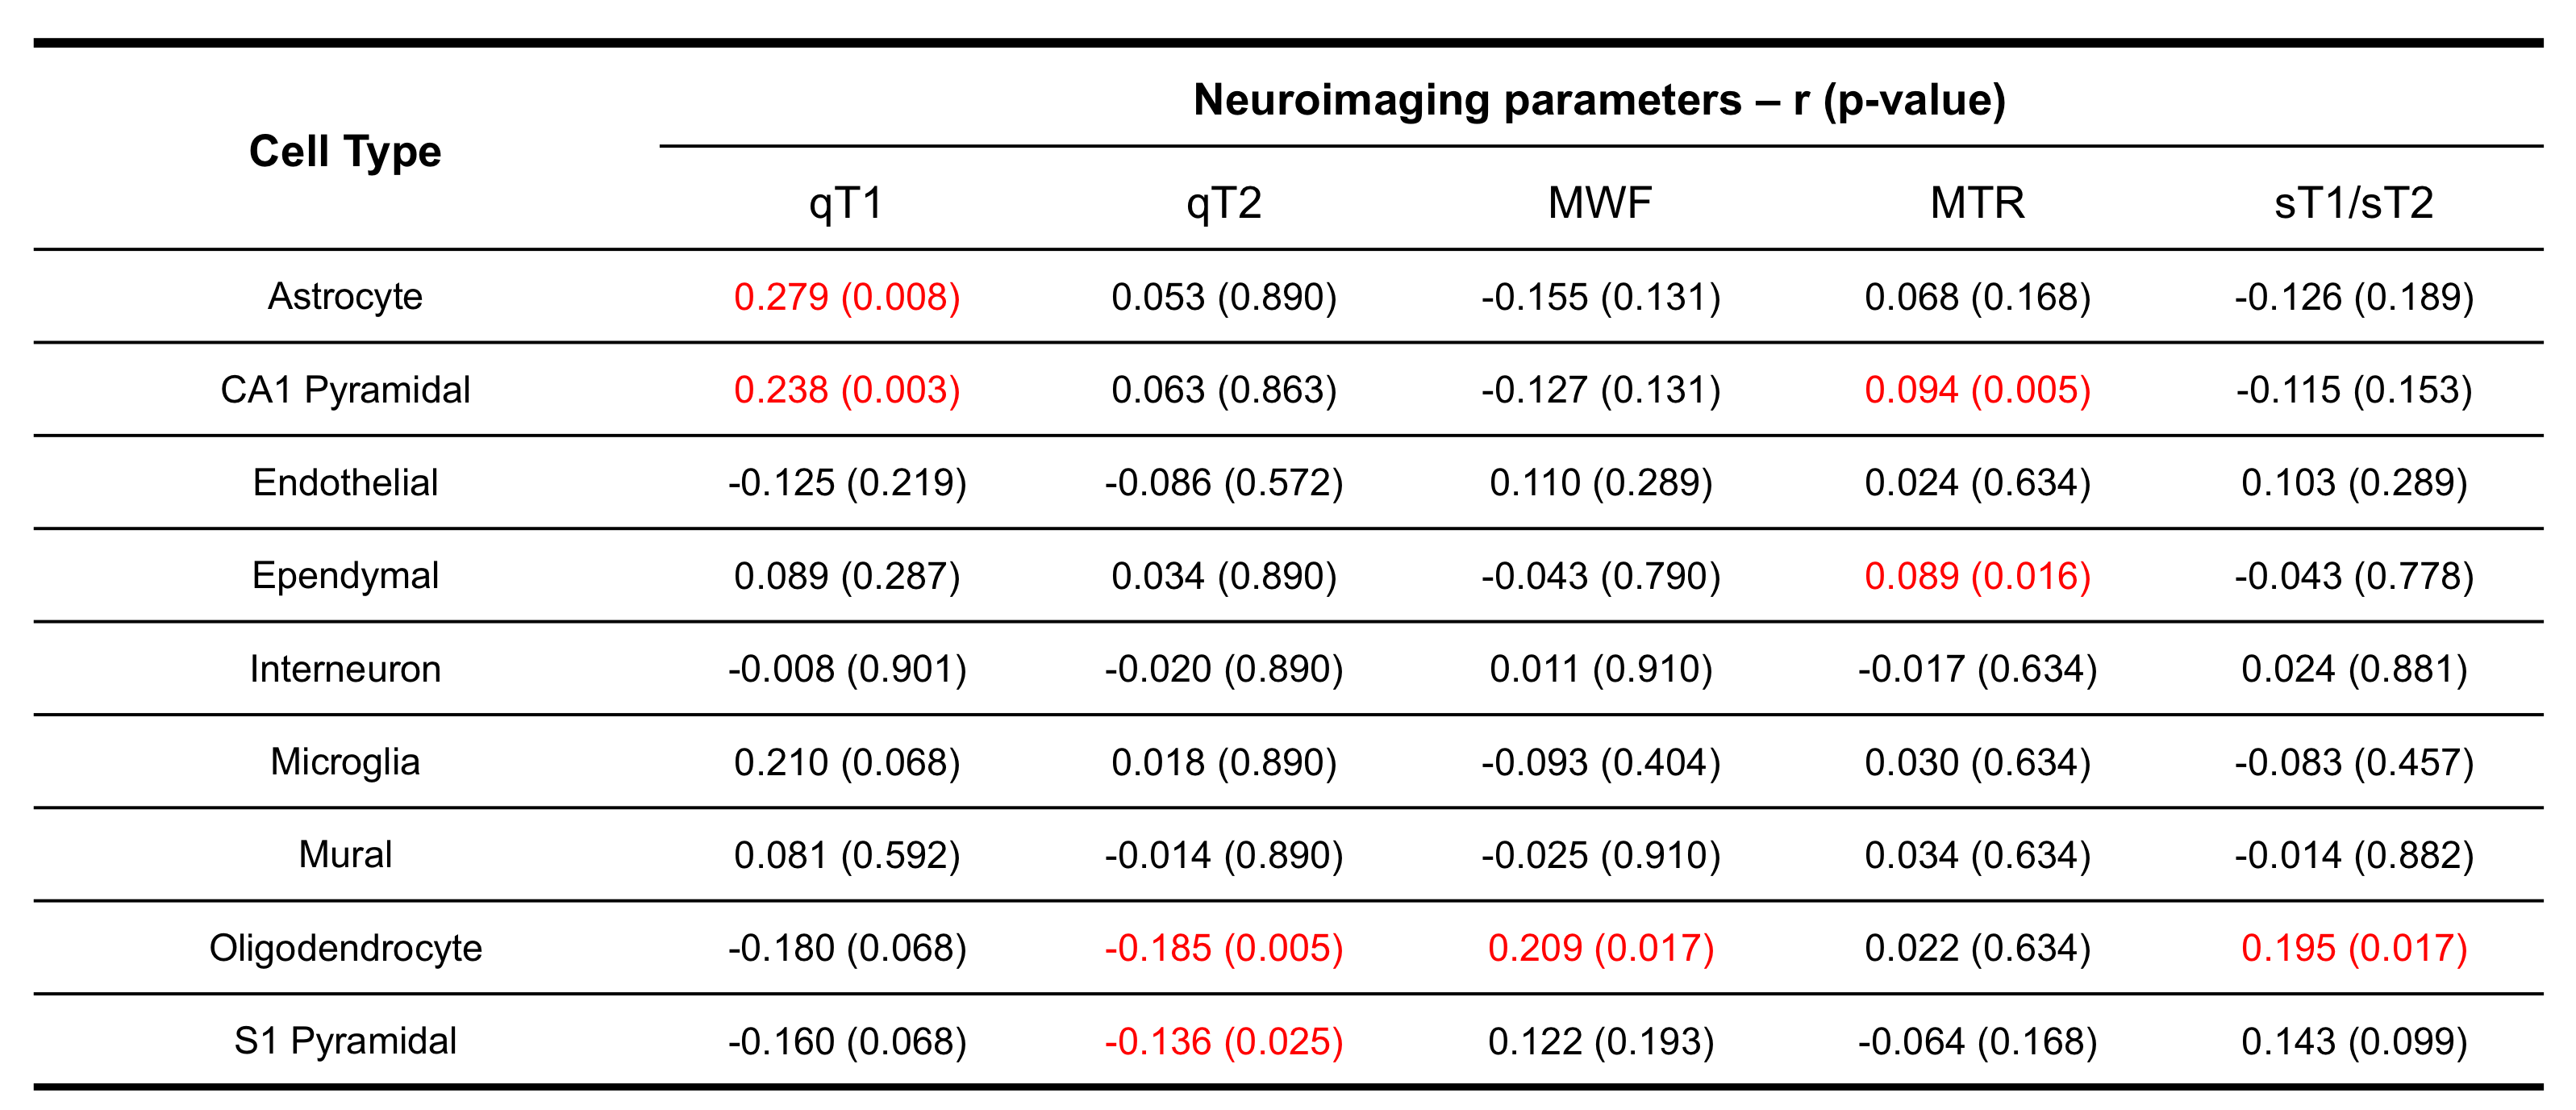
Inter-regional profiles of T1, T2, MWF, MTR, synthetic T1w/T2w across the cerebral cortex are illustrated in Figure 1. Average correlation coefficient of cell-specific gene expression profiles with MR profiles from virtual histology are reported in Table 1. T2, MWF and synthetic T1w/T2w ratio profiles were correlated with expression profiles of oligodendrocyte-specific genes. T1 was correlated with profiles of CA1 pyramidal cells, astrocytes and a weak trend towards oligodendrocyte-specific expression profiles. On the other hand, MTR was not related with oligodendrocytes, but with profiles of CA1 pyramidal and ependymal cells.DISCUSSION
We interpret the finding of oligodendrocyte-specific expression with inter-regional variation in T2 and MWF as indicating involvement of intra-cortical myelination in driving these signals. The relationship between T2/MWF and myelin is well established in the literature.1,2 Thus, regions with shorter T2 and higher MWF appear to have higher expression of oligodendrocyte-specific genes; this may indicate higher levels of intra-cortical myelination. Interestingly, mcDESPOT-derived T1w/T2w ratio (termed as synthetic T1w/T2w ratio) was also correlated with oligo-specific profiles, supporting the use of traditional T1w/T2w ratio as a marker for intra-cortical myelination. This needs to be verified. Lastly, MTR was not related to oligo-specific expression but rather to expression of genes specific to CA1 pyramidal and ependymal cells – gene-sets that are enriched with dendritic arbour-related biological processes.9CONCLUSION
This report supports the relationship between T2, MWF, T1w/T2w ratio, and T1 (weakly) with intra-cortical myelin using a virtual histology approach. We also observe the lack of a relationship between cortical MTR and intra-cortical myelin, arguing against rather common use of MTR as a “myelin map” within the literature. In conclusion, these results serve as foundational neurobiological correlates of common multi-parametric MRI maps, and may help with future interpretation in the variations of these metrics in health and disease.Acknowledgements
The UK Medical Research Council and Wellcome (Grant ref: 102215/2/13/2) and the University of Bristol provide core support for ALSPAC.References
- Laule C, Vavasour IM, Kolind SH, Li DK, Traboulsee TL, Moore GW, MacKay AL. Magnetic resonance imaging of myelin. Neurotherapeutics. 2007 Jul 1;4(3):460-84.
- Edwards LJ, Kirilina E, Mohammadi S, Weiskopf N. Microstructural imaging of human neocortex in vivo. NeuroImage. 2018 Nov 15;182:184-206.
- Shin J, French L, Xu T, Leonard G, Perron M, Pike GB, Richer L, Veillette S, Pausova Z, Paus T. Cell-specific gene-expression profiles and cortical thickness in the human brain. Cerebral Cortex. 2017 Aug 9:1-1.
- Boyd A, Golding J, Macleod J, Lawlor DA, Fraser A, Henderson J, Molloy L, Ness A, Ring S, Davey Smith G. Cohort profile: the ‘children of the 90s’—the index offspring of the Avon Longitudinal Study of Parents and Children. International journal of epidemiology. 2013 Feb 1;42(1):111-27.
- Avants BB, Tustison N, Song G. Advanced normalization tools (ANTS). Insight j. 2009 Jun 4;2:1-35.
- Jenkinson, M., Bannister, P., Brady, J. M. and Smith, S. M. Improved Optimisation for the Robust and Accurate Linear Registration and Motion Correction of Brain Images. NeuroImage, 17(2), 825-841, 2002.
- Fischl B. FreeSurfer. Neuroimage. 2012 Aug 15;62(2):774-81.
- Zeisel A, Muñoz-Manchado AB, Codeluppi S, Lönnerberg P, La Manno G, Juréus A, Marques S, Munguba H, He L, Betsholtz C, Rolny C. Cell types in the mouse cortex and hippocampus revealed by single-cell RNA-seq. Science. 2015 Mar 6;347(6226):1138-42.
- Patel Y, Shin J, Gowland PA, Pausova Z, Paus T. Maturation of the Human Cerebral Cortex During Adolescence: Myelin or Dendritic Arbor?. Cerebral Cortex. 2018 Aug 28.
Figures