2985
Whole brain myelin imaging using a Double Echo Sliding Inversion Recovery ultrashort echo time (DESIRE-UTE) magnetic resonance imaging1Radiology, University of California, San Diego, San Diego, CA, United States, 2VA San Diego Healthcare System, San Diego, CA, United States, 3Neurosciences, University of California, San Diego, San Diego, CA, United States
Synopsis
To image myelin in brain more robustly on clinical scanners, we propose a Double Echo Sliding Inversion Recovery ultrashort echo time (DESIRE-UTE) technique for volumetric myelin imaging in vivo. A series of images with different T1 contrasts can be generated by a single scan. The images with a best signal nulling of long T2 components can be easily found in the second echo image series with a minimum long T2 signals. Then myelin images were generated by dual-echo subtraction for both volunteer and multiple sclerosis (MS) patients. The myelin imaging show clearly signal loss in MS lesions in patient study.
Introduction
MRI has been used for the noninvasive evaluation of multiple sclerosis (MS) 1,2. However, direct myelin imaging is difficult due to the ultrashort T2 relaxations of both myelin lipids and proteins (around 0.3ms) 3-5. Recently, a 2D adiabatic inversion recovery prepared ultrashort echo time (IR-UTE) MRI sequence with TEs less than 100µs has been developed for direct detection of myelin proton in white matter 3,6-8. The IR preparation is used to suppress long T2 components in white matter (WML) and gray matter (GML) and is followed by a proper TI to null WML. This is critical for pure myelin imaging since the proton density of WML may be ten times greater than that of myelin. However, the best nulling point (TInull) may be different amongst patients, since different people (e.g. young or old, healthy or unhealthy) may have different T1 values 9,10. In this study, we developed a 3D UTE technique for volumetric myelin imaging using Double Echo Sliding Inversion Recovery (DESIRE) to characterize myelin contents.Methods
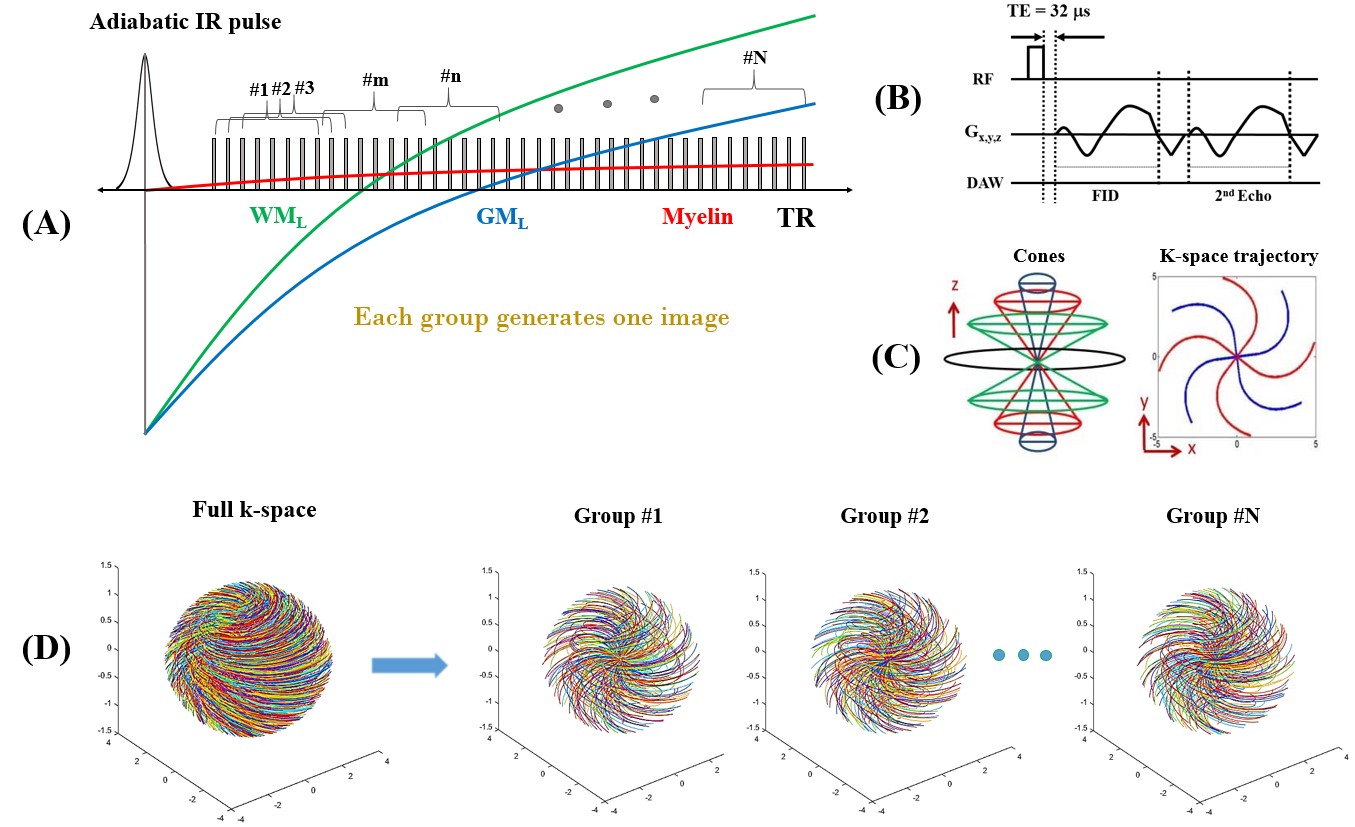
A 3D IR-UTE-Cones sequence was used in this study (Figure 1)11. The adiabatic IR pulse can uniformly invert the long T2 components as the pulse is insensitive to B1 inhomogeneity (Fig. 1A). The short T2 myelin with a T2* around 0.3 ms cannot be inverted and is mostly saturated by the much longer adiabatic IR pulse. Following IR pulse, a train of dual-echo UTE-Cones spokes (total number is Nsp) was used for data acquisition. When UTE acquisition reached the TInull of WML, the myelin signals in WM were highlighted by the echo subtraction used to reduce the residual GM signals. The TInull can be found when there are no signals in WM regions in the second echo images (the long T2 components are nulled and short T2 myelin signals are fully decayed). To find the TInull in this study, a series of images with different TIs was generated by the DESIRE technique. The train of acquisition spokes was grouped by a window with a fixed size of Nw which generated one image (Fig. 1A). The window started from the first Nw spokes of shortest TI, then slid one spoke at a time to generate a new image with a slightly longer TI. The total number (N) of the groups of images was equal to Nsp-Nw+1. With this sliding window technique, we were able to generate a series of images with different T1 contrasts. Both image contrast and SNR can be modified by changing group size Nw. We expected that one of these images provided good nulling of WML. Random view ordering with a bit-reversed algorism was employed for data sampling. Therefore, each group of spokes in the same window was randomly distributed in space (Fig. 1D), which can be effectively reconstructed by combined parallel imaging and compressed sensing (PI-CS) reconstruction technique 12,13.
The sequence parameters for both healthy volunteer (25-53 year-old, 5 males and 5 females) and MS patient (45-71 year-old, 2 males and 8 females) studies are shown as follows: FOV=22×22×15.1cm3, acquisition matrix=192×192×42, receiver bandwidth=250 kHz, TR/TI=1000/320 ms, TE=0.032ms/2.2ms, flip angle=10°, Nsp=71, τ=7.1ms, oversample factor=1.8, and scan time=10 min. Clinical T2 and T1-weighted sequences were also used for comparison. Written informed consent approved by the IRB was obtained prior to the participation of each subject.
Results and Discussion
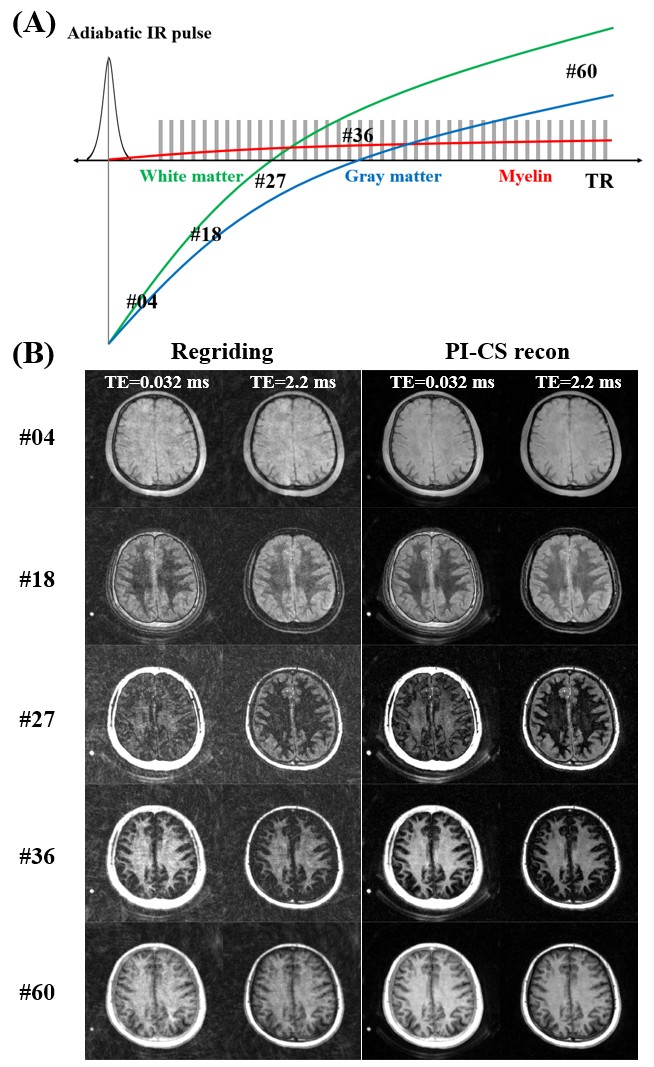
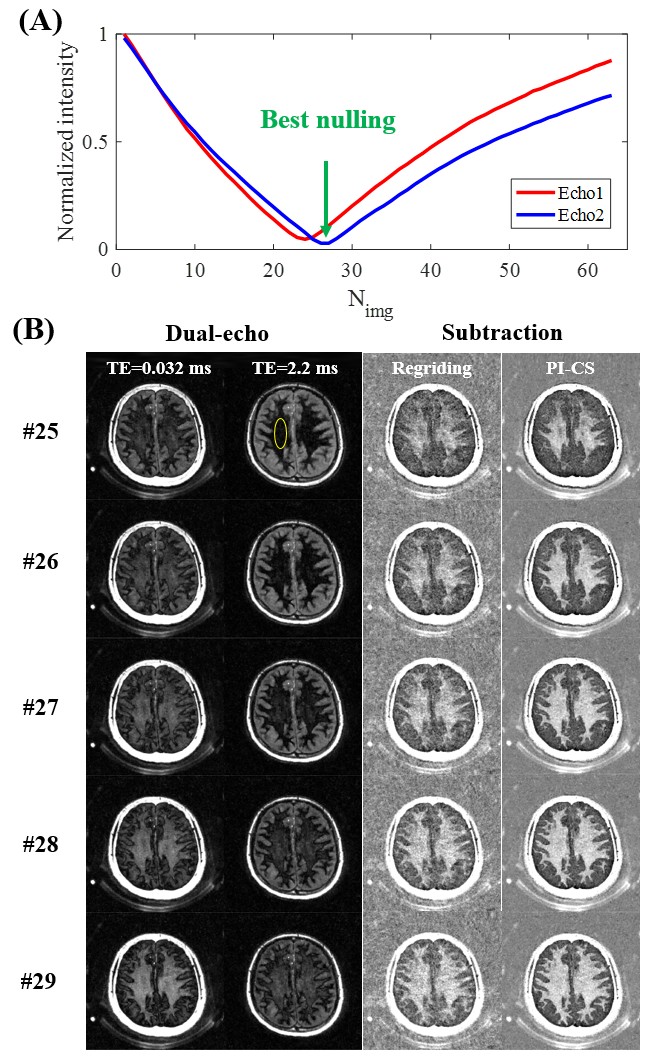
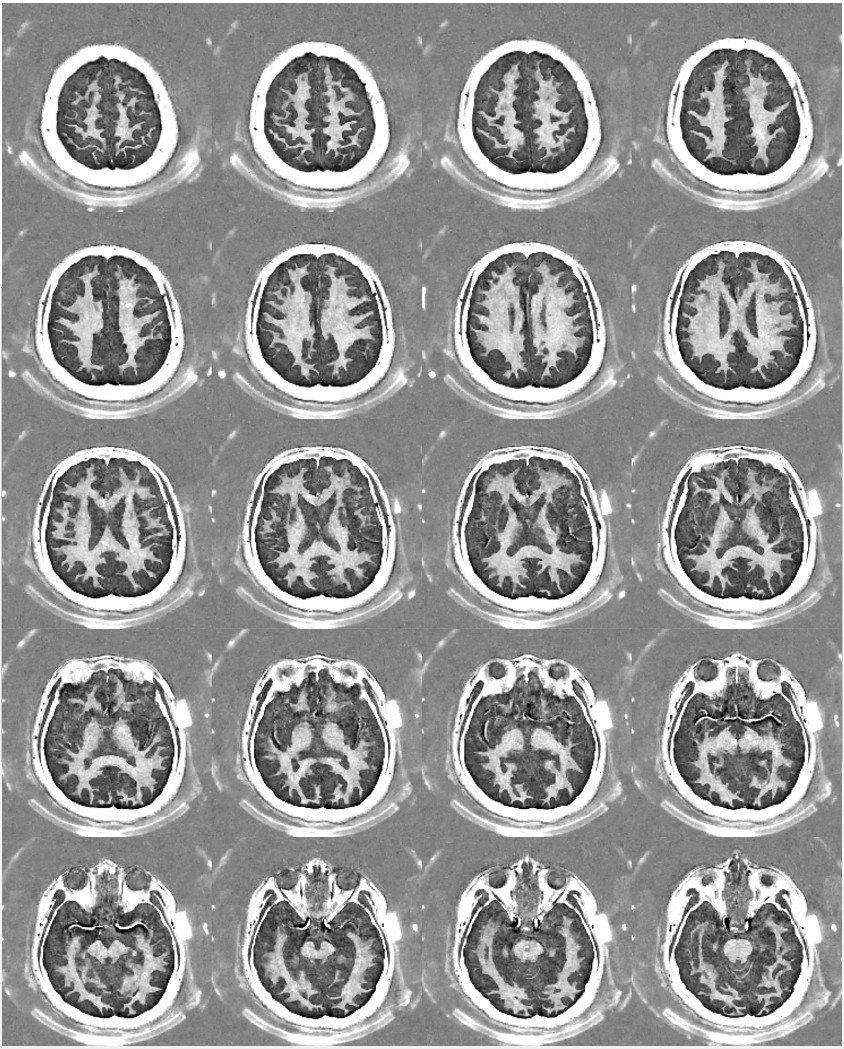
Fig. 2 shows the selected five different TIs (i.e. #4, #18, #27, #36, and #60) from a total of 62 time points to demonstrate the image contrast variations in brain imaging. The normalized signal curves in a WM region (yellow circle in Fig. 3B) for the dual-echo images are shown in Fig. 3A. The optimum WML signal nulling point among these 61 time points is located at the bottom of the second echo curve, indicated by an arrow. Fig. 3B shows the dual-echo images and corresponding subtractions close to the WML nulling point. The myelin images achieved by the subtraction of the dual-echo images reconstructed by PI-CS technique have a much better quality than those from regriding. Moreover, more myelin signals appear with a longer TI because of the less partial volume effect. The whole brain myelin images at the best nulling (i.e. #17) with a window size of 30 for the same volunteer are shown in Fig. 4.
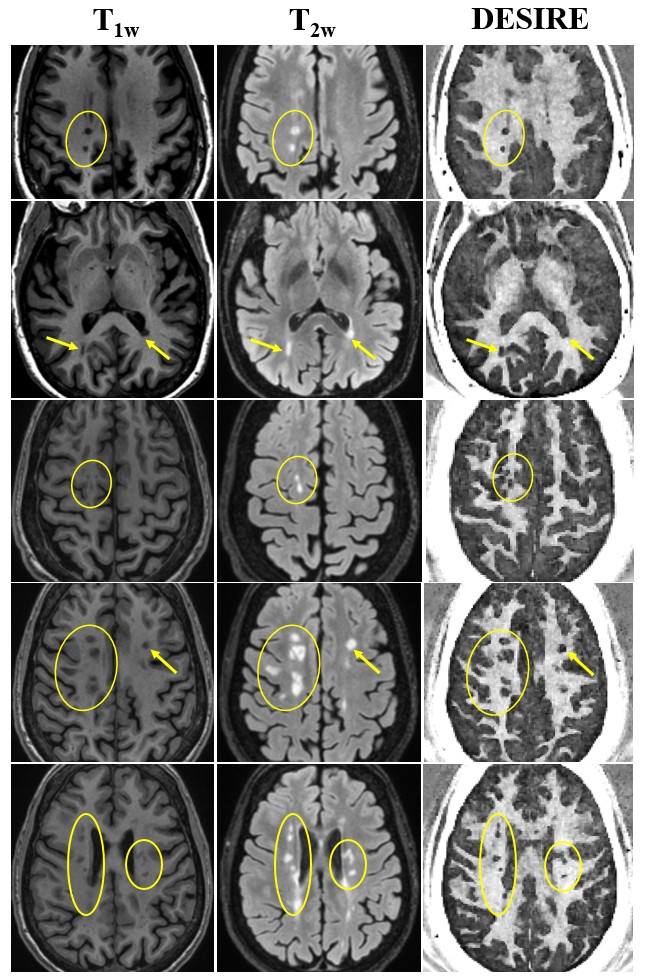
Fig. 5 shows five myelin imaging slices obtained from two MS patients, comparing the use of the DESIRE technique versus the use of clinical sequences. MS lesions identified by the clinical images clearly show signal loss in myelin imaging.
Conclusion
The 3D DESIRE-UTE provides a robust technique for the whole brain myelin imaging. Both healthy volunteer and MS patient studies demonstrate the potential of its clinical diagnosis of MS.Acknowledgements
The authors acknowledge grant support from GE Healthcare, NIH (R01NS092650), and the VA Clinical Science and Rehabilitation R&D Awards (I01CX001388 and I01RX002604)References
1. Filippi M, Rocca MA (2011) MR imaging of multiple sclerosis. Radiology 259: 659–681.
2. Laule C, Vavasour IM, Kolind SH, Li DK, Traboulsee TL, Moore GR, MacKay AL (2007) Magnetic resonance imaging of myelin. Neurotherapeutics 4:460–484.
3. Waldman A, Rees JH, Brock CS, Robson MD, Gatehouse PD, Bydder GM (2003) MRI of the brain with ultra-short echo-time pulse sequences. Neuroradiology 45:887–892.
4. Horch AR, Gore JC, Does MD (2011) Origins of the ultrashort-T2 1H NMR signals in myelinated nerve: a direct measure of myelin content? Magn Reson Med 66:24–31.
5. Wilhelm MJ, Ong HH, Wehrli SL, Li C, Tsai PH, Hackney DB, Wehrli FW (2012) Direct magnetic resonance detection of myelin and prospects for quantitative imaging of myelin density. Proc Natl Acad Sci USA 109:9605–9610
6. Du J, Ma G, Li S, Carl M, Szeverenyi NM, VandenBerg S, Corey-Bloom J, Bydder GM (2014). Ultrashort echo time (UTE) magnetic resonance imaging of the short T2 components in white matter of the brain using a clinical 3T scanner. Neuroimage 15;87:32-41.
7. Sheth V, Shao H , Chen J, Vandenberg S, Corey-Bloom J. Bydder GM, Du J (2016) Magnetic resonance imaging of myelin using ultrashort Echo time (UTE) pulse sequences: phantom, specimen, volunteer and multiple sclerosis patient studies. Neuroimage 136, 37–44.
8. Seifert AC, Li C, Wilhelm MJ, Wehrli SL, Wehrli FW (2017) Towards quantification of myelin by solid-state MRI of the lipid matrix protons. NeuroImage 163:358-67.
9. Suzuki S, Sakai O, Jara H. Combined volumetric T1, T2 and secular-T2 quantitative MRI of the brain: age-related global changes (preliminary results) (2006) Magn Reson Imaging 24(7):877-87.
10. Cheng HL, Stikov N, Ghugre NR, Wright GA (2012) Practical medical applications of quantitative MR relaxometry. J Magn Reson Imaging 36:805–824.
11. Carl M, Bydder GM, Du J. UTE imaging with simultaneous water and fat signal suppression using a time-efficient multispoke inversion recovery pulse sequence. Magn Reson Med 2016;76:577–582.
12. Lustig M, Donoho DL, Pauly JM (2007) Sparse MRI: the application of compressed sensing for rapid MR imaging. Magn Reson Med 58:1182–1195.
13. Liang D, Liu B, Wang J, Ying L (2009) Accelerating SENSE using compressed sensing. Magn Reson Med 62(6):1574-84.
Figures