2980
Short- and long-term reliability of BOLD signal change induced by breath holding: Comparison and validation at 1.5T and 3T1Department of Biomedical Imaging and Radiological Science, China Medical University, Taichung, Taiwan, 2Department of Radiology, China Medical University Hospital, Taichung, Taiwan
Synopsis
cerebrovascular reactivity (CVR) plays important role in the normalization and/or correction of functional magnetic resonance imaging (fMRI) data. But its reliability at the relatively lower field strengths such as 1.5T, to our knowledge, no study has systematically been conducted to date. By performing the systemic evaluations to compare the short- and long-term reliability of BH-induced CVR at 1.5T and 3T, we found reliable measurements of hemodynamic lag of the BOLD response, t-statistics, and activated cortical gray matter at both field strengths, suggesting that CVR measurement can be performed equally well at 1.5T and 3T.
Introduction:
Blood-oxygenation-level-dependent (BOLD) signal patterns are affected by many of baseline physiological parameters, and vasodilatory capacity, namely cerebrovascular reactivity (CVR), is one of them1. There are many evidences on the normalization and/or correction of functional magnetic resonance imaging (fMRI) data by using CVR from the breath hold (BH) task2, 3. Moreover, CVR is a powerful tool to investigate several neurological conditions such as stroke and dementia.4 Therefore, the reliability of BH-induced CVR is essential to determine before potential translation of this technology to clinical practice. Only one existing study has examined the reproducibility of BH-induced CVR at 3T5, but at the relatively lower field strengths such as 1.5T, to our knowledge, no study has systematically been conducted to date. Since 1.5T MRI is more widely available, the central goal of this study was to perform the systemic evaluations to compare the short- and long-term reliability of BH-induced CVR at 1.5T and 3T.Methods:
Study design: A total of 9 healthy subjects (6 females, 23.4 ± 2.4 years old) were recruited in this study. Informed consent was obtained using IRB-approved protocol. All volunteers were scanned in both a 1.5T (GE, Signa, Excite HDx, Wisconsin, USA) and 3T (GE, Signa, Excite HDxt, Wisconsin, USA) scanners on the same day. The order of 1.5T or 3T scanning was randomized. For each field strength, every subject underwent three MRI sessions: session 1, session 2 (30 min after session1, with changing the position, short-term), and session 3 (32-68 days after session 2, long-term). MRI measurement: Subjects were asked to breath normally for 40 s followed by 20 s BH, repeated four times with additional 40 s self-paced breathing at the end. BOLD MR images were acquired during this period. The BOLD imaging parameters at both strengths were TR = 2000 ms, TE= 30 ms, flip angle = 90°, matrix size = 64 x 64, FOV = 240 x 240 mm, slice thickness = 4.4 mm. High resolution T1-weighted fast spoiled gradient echo (FSPGR) sequence was acquired for co-registration and extraction of the cortical grey matter (GM) with the following parameters: TR/TE/FA=6.22 msec/1.99 msec/12°, and time of inversion (TI)=450 msec, spatial resolution=1x1x1mm3, and number of slices=170. Data analysis: The shift at which the hemodynamic response function (HRF) from SPM provided the maximal cross-correlation coefficient with the BOLD time course was defined as the time delay. The shifted HRF was used as the regressor in the voxel-wise activation detection using the general linear model. The signal changes of voxels with significant signal variation in the GM were computed. The short-term and long-term inter-session reproducibility was estimated by computing the coefficient of variation (CoV). Two-way ANOVA with repeated measures were performed to test the field strength effect.Results and Discussion:
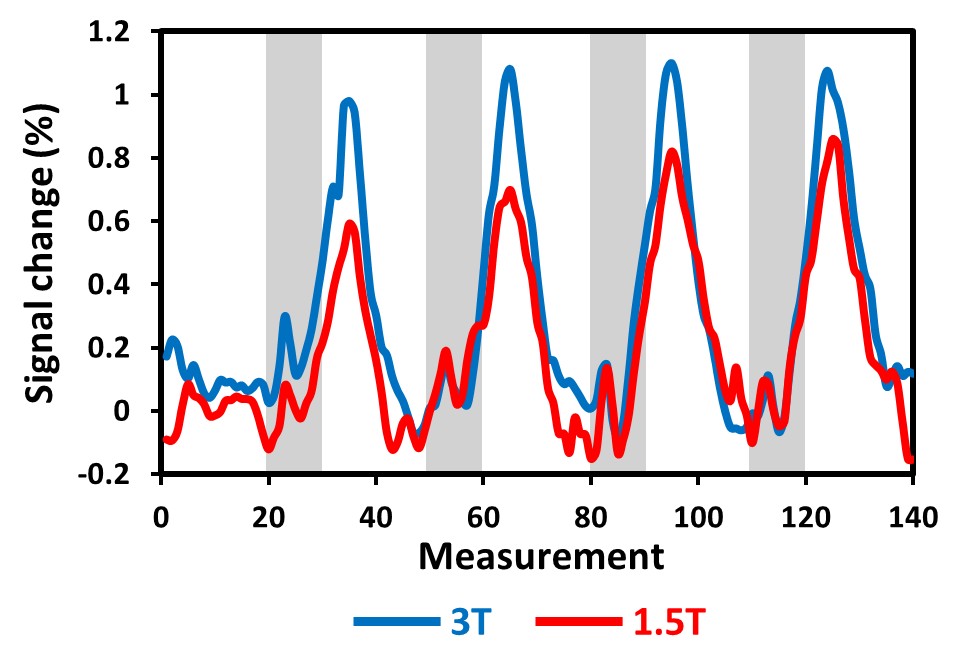
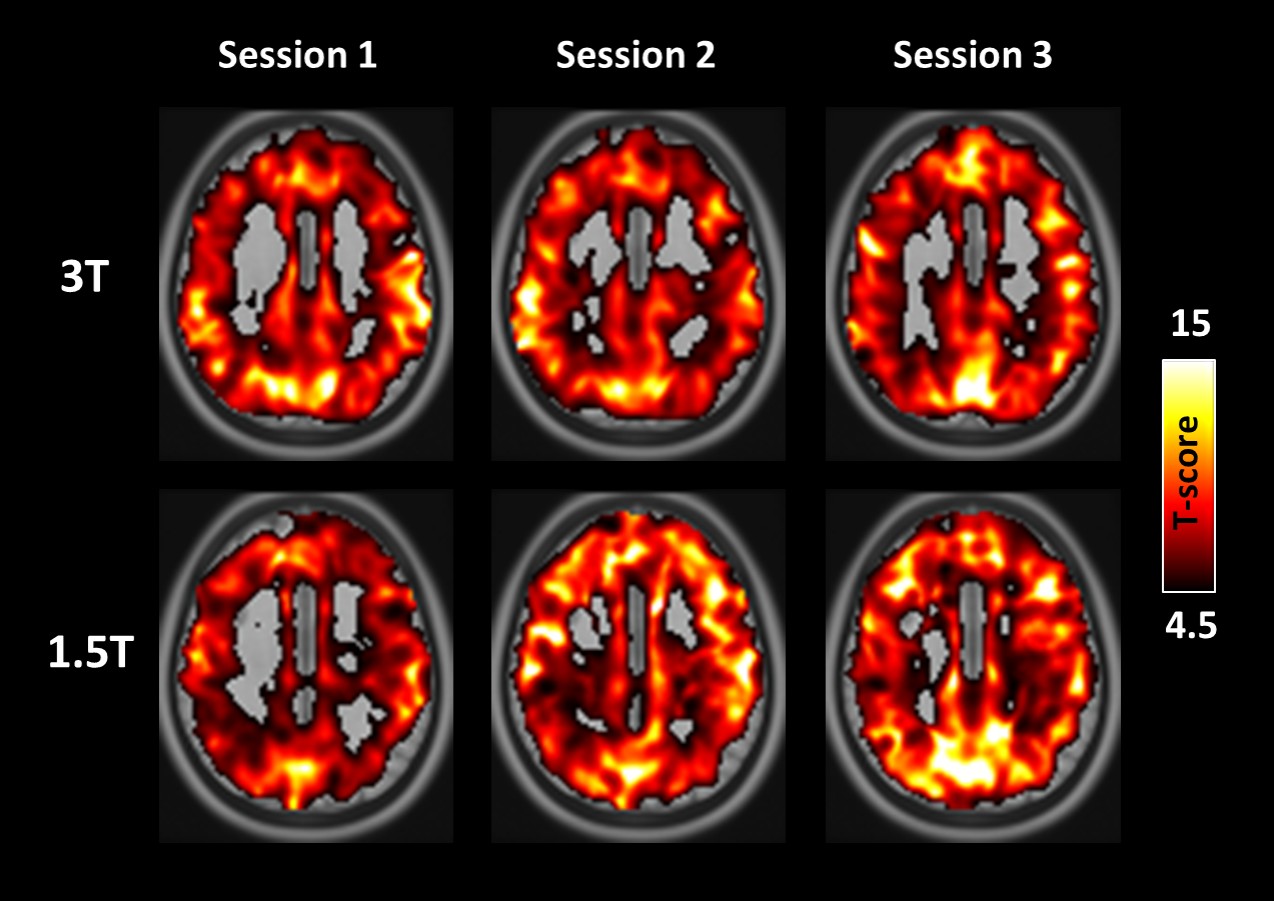
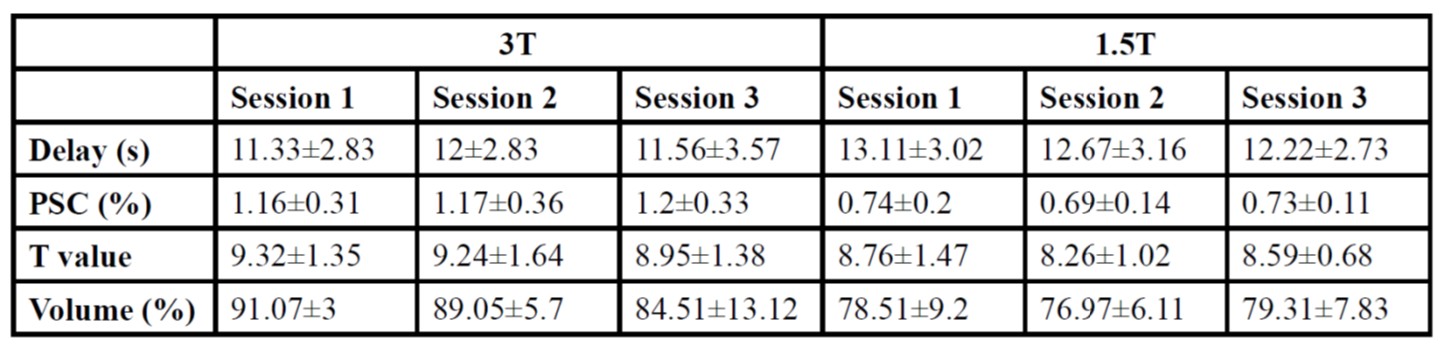
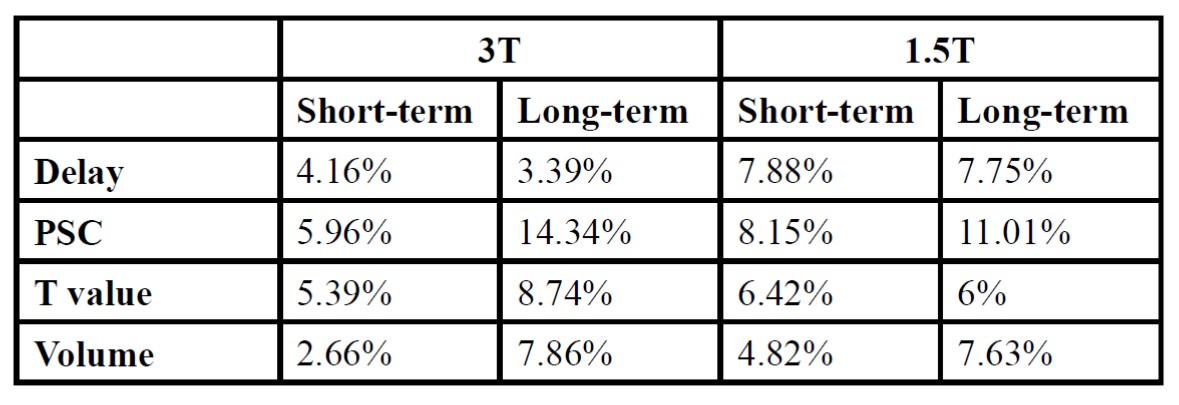
Effects of field strengths on CVR measurements: The averaged time course of BOLD signal changes from 9 subjects is displayed in Fig. 1. The gray bars indicate the periods of 20s breath hold, and it reflects that there exists a clear hemodynamic lag of the BOLD response with respect to the breath hold period at both field strengths. The group CVR maps and the corresponding parameters estimated from the breath hold challenges at different field strengths are exhibited in Fig.2 and Fig.3, respectively. As the higher field strength improves the sensitivity, the BOLD percent signal changes (PSC) at 3T are significantly enhanced when compared to those at 1.5T (P<0.05), but the comparisons of other parameters showed insignificant differences between field strengths. Short-term and long-term reproducibility: Figure 4 reports the CoV at different field strengths for each parameter. Notably, expect for CoVs of long-term PSC at both field strengths, all CoVs fall under 10%, indicating a very low variability of breath hold challenges across sessions at both 3T and 1.5T. The reproducibility of CVR measurement is directly dependent on the duration of the BH, being improved for longer BH durations5. We used the BH of 20 s had the favorable effects on improving the reliability as demonstrated by the small CoVs even at the relatively lower field strength of 1.5T.Conclusion:
Analyzing the short- and long-term reliability of CVR measurement using BH challenge, we found reliable measurements of hemodynamic lag of the BOLD response, t-statistics, and activated cortical GM at both field strengths, suggesting that CVR measurement can be performed equally well at 1.5T and 3T. The findings of this study may encourage the CVR measurement performed on 1.5T systems for clinical applications.Acknowledgements
No acknowledgement found.References
1. Liu P, Hebrank AC, Rodrigue KM, Kennedy KM, Section J, Park DC et al. Age-related differences in memory-encoding fMRI responses after accounting for decline in vascular reactivity. NeuroImage 2013; 78: 415-25.
2. Handwerker DA, Gazzaley A, Inglis BA, D'Esposito M. Reducing vascular variability of fMRI data across aging populations using a breathholding task. Human brain mapping 2007; 28(9): 846-59.
3. Gonzales MM, Tarumi T, Mumford JA, Ellis RC, Hungate JR, Pyron M et al. Greater BOLD response to working memory in endurance-trained adults revealed by breath-hold calibration. Human brain mapping 2014; 35(7): 2898-910.
4. Lu H, Liu P, Yezhuvath U, Cheng Y, Marshall O, Ge Y. MRI mapping of cerebrovascular reactivity via gas inhalation challenges. Journal of visualized experiments : JoVE 2014; (94).
5. Magon S, Basso G, Farace P, Ricciardi GK, Beltramello A, Sbarbati A. Reproducibility of BOLD signal change induced by breath holding. NeuroImage 2009; 45(3): 702-12.
Figures