2979
MR Inversion Recovery Simulation and Scanning of Subjects with Focus on White Matter Lesion Contrast Optimization1Diagnostic Physics, Oslo University Hospital, Oslo, Norway, 2Radiography Ullevål/Aker, Oslo University Hospital, Oslo, Norway, 3Radiology Ullevål/Aker, Oslo University Hospital, Oslo, Norway
Synopsis
A MatLab-based inversion recovery sequence simulator/calculator was developed with the purpose of determining and testing optimal parameters for 3D IR acquisitions with the purpose of detecting Multiple Sclerosis lesions in brains. Single inversion FLAIR and dual inversion DIR sequences were studied including a “T1-nulled” DIR sequence removing the undesired T1 weighting inherent in IR sequences to improve lesion-WM contrast. A T2 preparation phase further helps facilitate T1 suppression.
Optimized IR sequences were tested on healthy volunteers and some MS patients, on 1.5 T and 3.0 T MR scanners. Good lesion contrast efficiency with high SNR was found for T1-nulled DIR.
Introduction
A simulation tool for inversion recovery MR sequences was developed and used to improve brain lesion detection in test persons including MS patients. These sequences were tested on MR scanners with promising results.Methods
A Matlab-based inversion recovery (IR) sequence simulator was developed to determine sequence parameters optimizing signal-to-noise (SNR) and contrast-to-noise (CNR) efficiency (SNR/t and CNR/t, resp.) for white matter lesions (WML) versus background signal. 3D TSE fluid attenuated IR (FLAIR) and double inversion (DIR) sequences (Siemens SPACE, GE CUBE readout) were optimized with CNR/t as the main target. Optimized sequences were tested on 1.5 T and 3 T MRI scanners on 2 healthy volunteers with visible WML commonly associated with normal aging and on 5 multiple sclerosis (MS) patients.
DIR is traditionally used for simultaneous suppression of cerebrospinal fluid (CSF) and WM. IR produces T1 weighting that counteracts the desired T2 contrast. In this study we used the idea described by Madhuranthakam et al1 to suppress the T1 contrast between WML and WM instead of WM, improving T2 lesion contrast. This sequence is denoted “T1-nulled” instead of the standard WM-nulled DIR. The influence of a T2 preparation method reducing tissue T1 weighting was also studied2.
Results
The Matlab application calculates inversion and effective echo times given sequence parameter settings including TR, inversion efficiency, readout time and T2 preparation time along with relaxation times based on literature values at desired field strengths. These calculations are illustrated and corroborated by longitudinal magnetization evolution simulation. Actual sequence settings on different scanners may differ somewhat from the simulated values due to different vendor implementations; this was taken into account in the scanner tests.
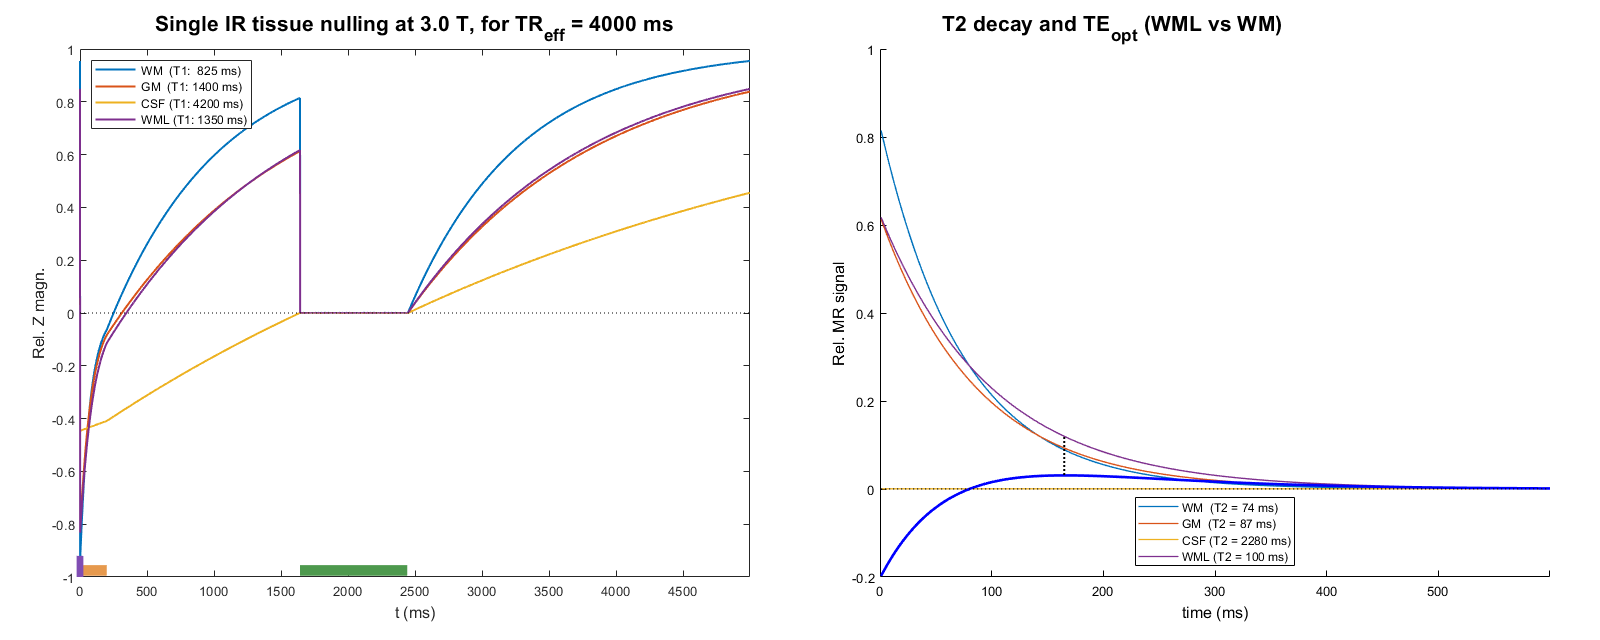
Figure 1 shows a simulated FLAIR sequence using settings typical of vendor implementations optimized for efficient scanning at the cost of some image quality. The negative impact of short TR on the resulting T2 contrast (fig. 1b) is somewhat offset by the use of T2 preparation, effectively making the inversion recovery of the tissue signals more of a saturation recovery. Nevertheless, T1 weighting between WM and WML leads to the need for a long TE to achieve optimal lesion contrast, impacting both SNR and CNR negatively.
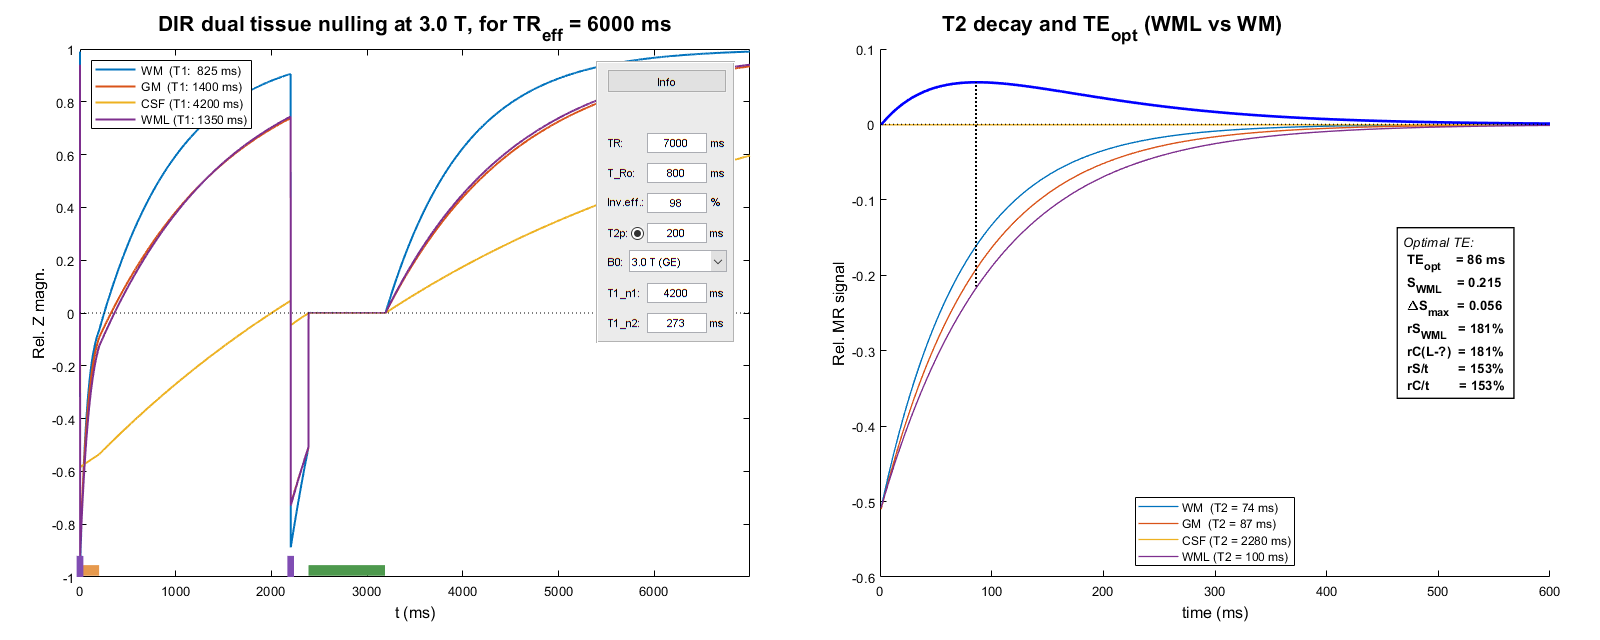
In figure 2 a simulated T1-nulled DIR sequence is shown. Even though double inversion inherently leads to less signal intensity at readout, the removal of WM-WML T1 weighting in this sequence enables a shorter optimal TE of 86 ms, resulting in at least as good SNR and CNR as a FLAIR sequence with the same acquisition time. Note that the TR in this simulation is longer than in the previous one, which is also beneficial for the image quality even accounting for total acquisition time. In the simulations, this is reflected by an increase in contrast efficiency (CNR/t) as well as the CNR itself.
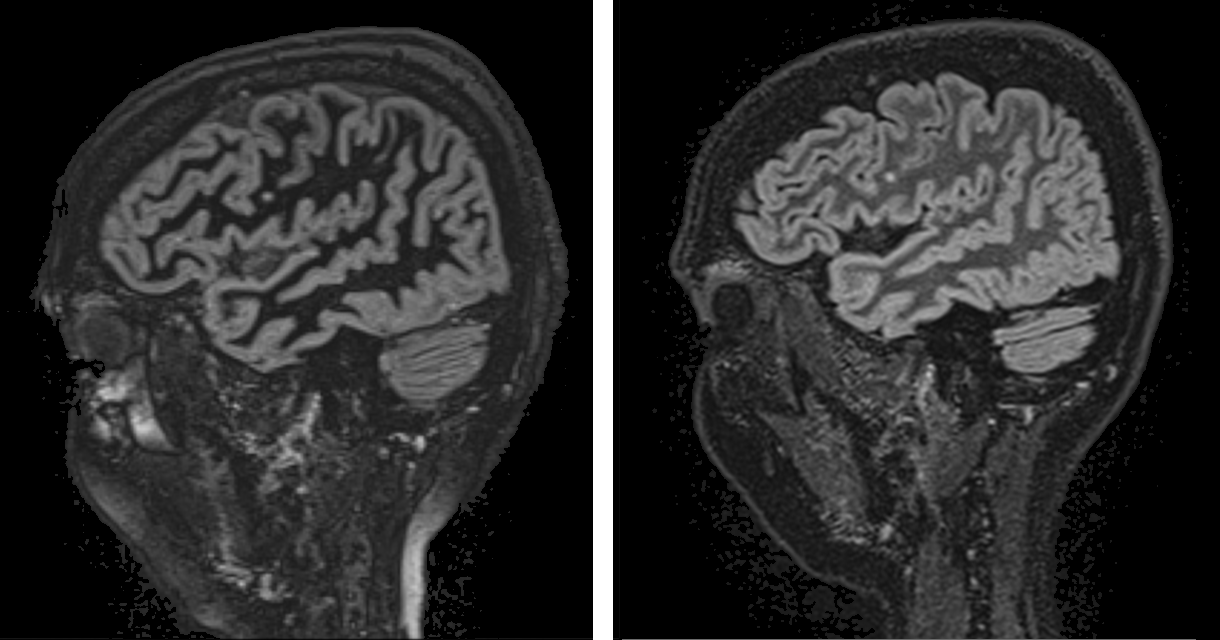
Figure 3 shows DIR images acquired on a 1.5 T MR scanner of a healthy volunteer displaying non-pathological WM lesions. The need for moderate/short TE in the SNR starved standard WM-nulled sequence leads to nearly no lesion-to-GM contrast particularly at 1.5 T. The T1-nulled image shows high contrast between lesion and all other tissues.
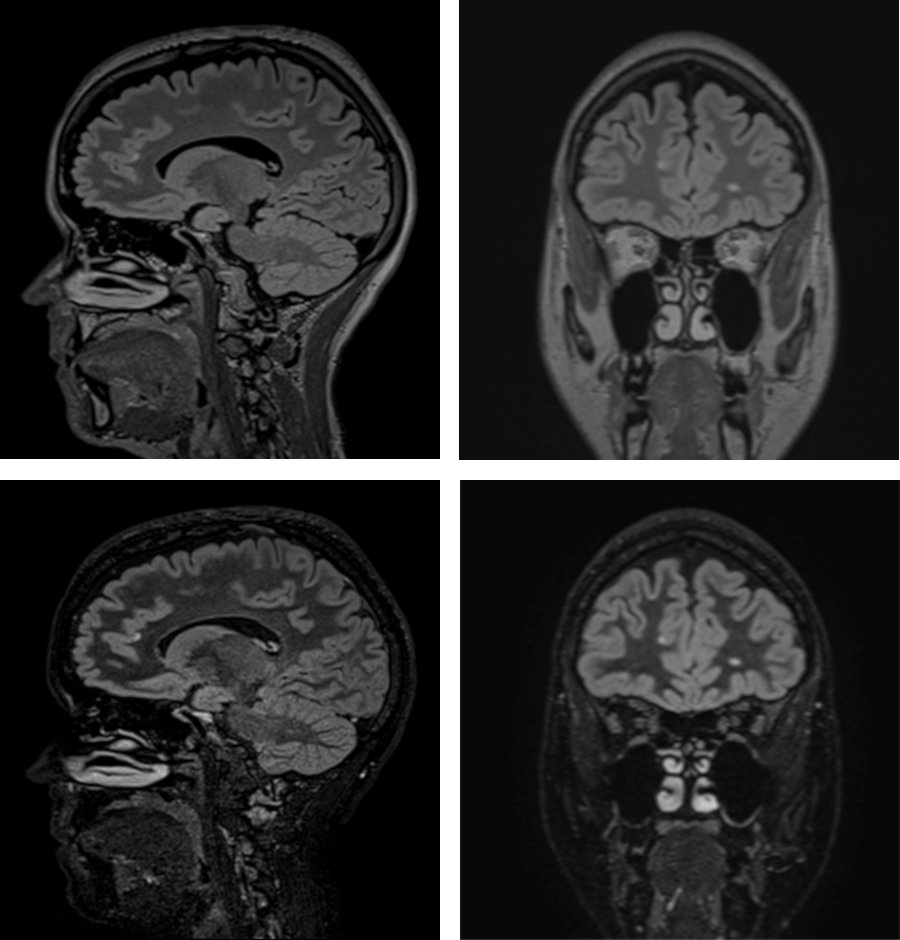
Figure 4 shows MS patient images acquired on a 1.5 T MR scanner. The FLAIR images display good SNR and lesion contrast, but the T1-nulled DIR images have superior contrast particularly vs GM. The WM signal in the latter images looks noisier but this is likely due to the partial WM suppression accentuating low-contrast anatomical differences.
Discussion
Lesions in WM appear more conspicuous in WM-nulled than in FLAIR images due to the suppressed WM signal. However, due to poor SNR and CNR at 1.5 T, WM-nulled DIR adds no significant information compared to FLAIR. In T1-nulled DIR images, however, lesions are better contrasted both to WM and GM, and are thus more detectable in juxtacortical/GM lesions than in FLAIR images. SNR is also much improved from standard DIR and comparable to FLAIR SNR. At 1.5 T, GM-associated lesions are often poorly detectable in both FLAIR and WM-nulled images; these lesions are somewhat better delineated by WM-nulled DIR at 3 T. With T1-nulled and T2-preparated DIR however, SNR/CNR efficiency both in WM and GM-associated lesions are superior compared to the other IR sequences although optimized FLAIR with T2 preparation at 3 T also performs well in this respect.Conclusion
In conclusion, using T1-nulled DIR sequences with T2 preparation and not too short TR wherever available looks like a promising approach to MS lesion detection.Acknowledgements
No acknowledgement found.References
- Madhuranthakam AJ et al. Optimized Double Inversion Recovery for Reduction of T1 Weighting in Fluid-Attenuated Inversion Recovery. Mag Res Med 2012; 67(1):81–88.
- Visser F et al. High-Resolution Magnetization-Prepared 3D-FLAIR Imaging at 7.0 Tesla. Mag Res Med 2010; 64:194–202.
Figures