2974
Continuously visualizing slow flow using SSFPKoichi Oshio1, Masao Yui2, Seiko Shimizu3, and Shinya Yamada4
1Department of Diagnostic Radiology, Keio University School of Medicine, Tokyo, Japan, 2Research and Development Center, Canon Medical Systems Corporation, Ohtawara, Tochigi, Japan, 3National Sales Division, Canon Medical Systems Corporation, Tokyo, Japan, 4Toshiba Rinkan Hospital, Sagamihara, Kanagawa, Japan
Synopsis
A novel technique that can visualize relatively slow flow continously. It is based on SSFP sequence, and gradient pulses are added to introduce spatially linear field gradient. When the steady state is reached, dark bands appear due to the large linear field gradient. When the spins move, these dark band moves following the spin motion, and the flow can be visualized as the motion of the dark bands. Numerical simulation was performed to verify the response to flow, and volunteer images were also taken. It can be a powerful tool to investigate CSF flow.
Introduction
Cerebrospinal fluid (CSF) flow is known to be complex in both space and time. Currently available techniques include phase contrast method1 and time-SLIP2. The phase contrast method utilizes phase shift of the moving spins, and can be used to visualize pixelwise average flow velocity. This may become significant limitation when measuring CSF flow in small space, like the aqueduct, where large velocity difference exists even within a single voxel. The time-SLIP method, on the other hand, can visualize the net movement of water molecules between sampling periods, which is not averaged over the pixel. However, based on spin-labeling technique, the observation time is essentially limited by T1 of the tissue.Here we present a novel technique to continuously visualize slow flow, like that of CSF. It is based on SSFP sequence, and positively utilizes its dark band artifacts. When a linear gradient is added to increase field inhomogeneity along one direction, paralell dark bands appear. When the spins move, these dark bands follow the motion of the spins, and it is possible to visualize the flow or motion clearly. The response to the flow was investigated through numerical simulation. Also, the method was tested on healthy volunteers.Methods
The sequence is shown in fig 1. It is based on balanced SSFP, with gradient pulses added to generate linear field gradients. Although it is possible to introduce the linear gradient by use of the shimming system, it is easier to control the position and direction of the dark bands when the functionarity is implemented through gradient pulses. The sequence was implemented on a 3T clinical scanner (Vantage Galan 3T, Canon Medical Systems). Numerical simulation was carried out to verify the relation between the flow and the motion of the dark bands. One-D array of voxels were considered, and SSFP response was created by solving the Bloch equation for each voxel. When the steady state was reached, the spins were moved in one direction at a constant speed. The resulting transverse magnetizaion was displayed as a 2D image, with horizontal direction as space, and the vertical direction as time. Healthy volunteers were imaged using the sequence. Images were taken continuously for about 30 seconds, at 9 frames per second. The matrix size was 96 × 192, and the FOV was 22 × 28.4cm, resulting in 2.3 × 1.5 mm in-plane resolution. Paralell imaging was used to achieve the 9 frames per second imaging rate.Results and discussion
Results of numerical simulation is shown on fig 2. It reproduces closely what is seen in the real sequence. When the flow is slow and constant, a new steady state is reached and the position of the dark band is shifted with flow. When the flow is faster than certain limit, the dark band will follow the moving spins, just like spin labeling. Also, for slow and oscillating flow, it behaves like spin labeling again. Its behavior is a mixture of spin labeling type and phase contrast type. Fig 3 shows the results of volunteer scans. Although the motion cannot be shown on the static figure, the flow can be seen as shifts of dark bands. These bands moves following the motion of the CSF. Both slow flow and fast flow were visualized over the entire slice. Jet flow at aqueduct is also visualized, even though the intra-pixel flow velocity differences. Since the response to the flow is somewhat complex, it is difficult to measure the flow quantitatively from the image. However, it is suitable to grasp the flow pattern over a large area. The sequence is simple with just a small modification to the SSFP sequence, and requires no special resonstruction process. Also, imaging process is real time, and there is no theoretical limit to the maximum extent of imaging duration.Conclusion
A novel technique that can visualize relatively sflow flow continously. It can be a powerful tool to investigate CSF flow.Acknowledgements
No acknowledgement found.References
1. Alperin N et al, Magn Reson Med 1996; 35:741-754.
2. Yamada S et al, Radiology 2008; 249:644 - 652.
Figures
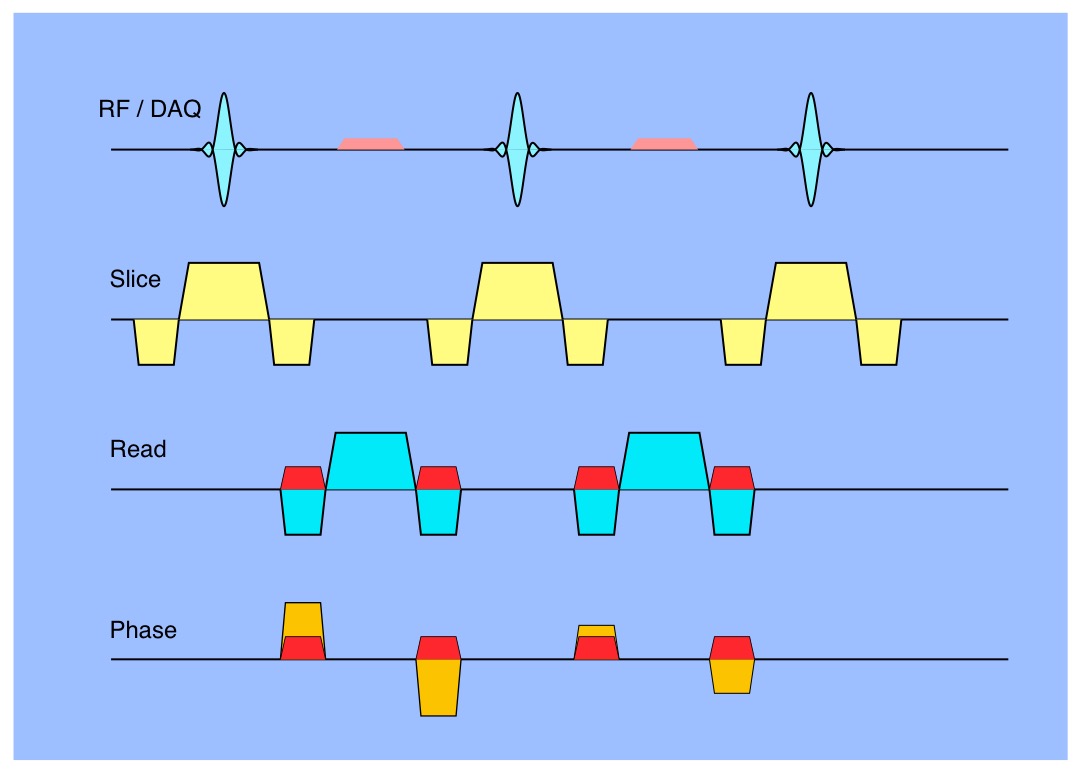
SSFP pulse sequence. It is based
on balanced SSFP, with gradient pulses
added to generate linear field gradient (red).
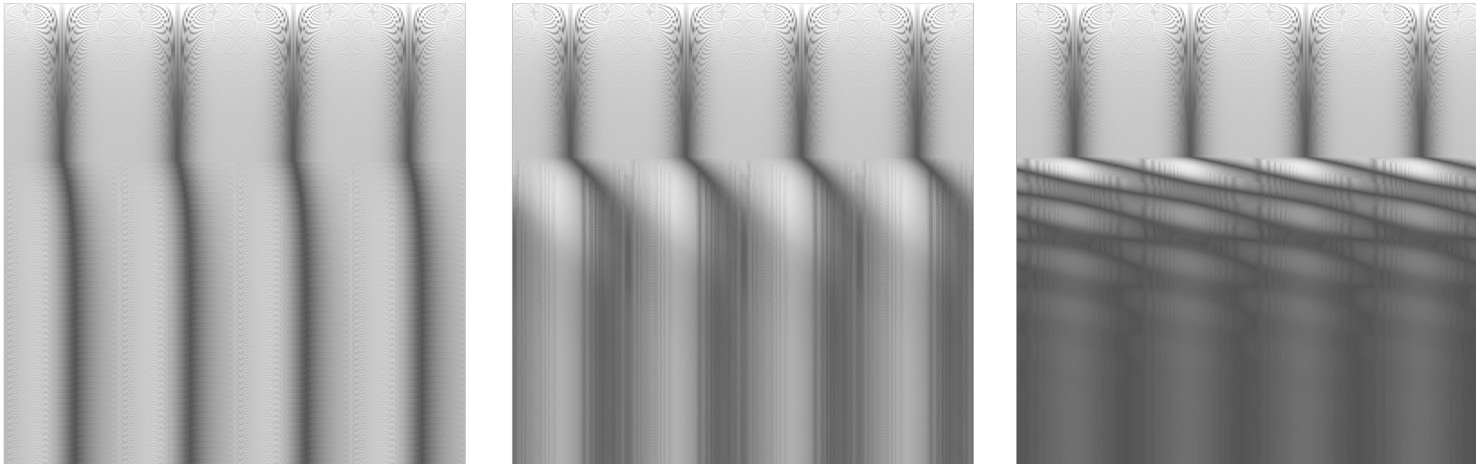
Results of numerical simulation. The horizontal axis replerents space
(1D), and the vertical axis represents time (from top to bottom). The SSFP
pulses are started at the top of the figure, and the spins are moved toward
right at a constant speed when steady-state is reached, at about 1/3 from the
top of the figure. The flow speed is increased from left figure to right
figure.
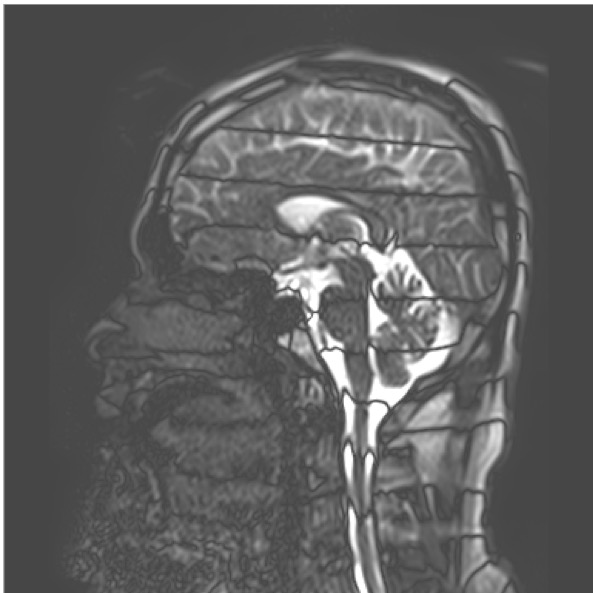
Volunteer scan. Multiple dark bands are visible. Usually, these bands
replesents the field inhomogeneity, it also shows the flow in this case. The
images were acquired at 910 images
per seconds, the cardiac pulsation can be seen as smooth motion. Also, the
images were acquired for 30 seconds continuously, much slower changes are also
recognized.
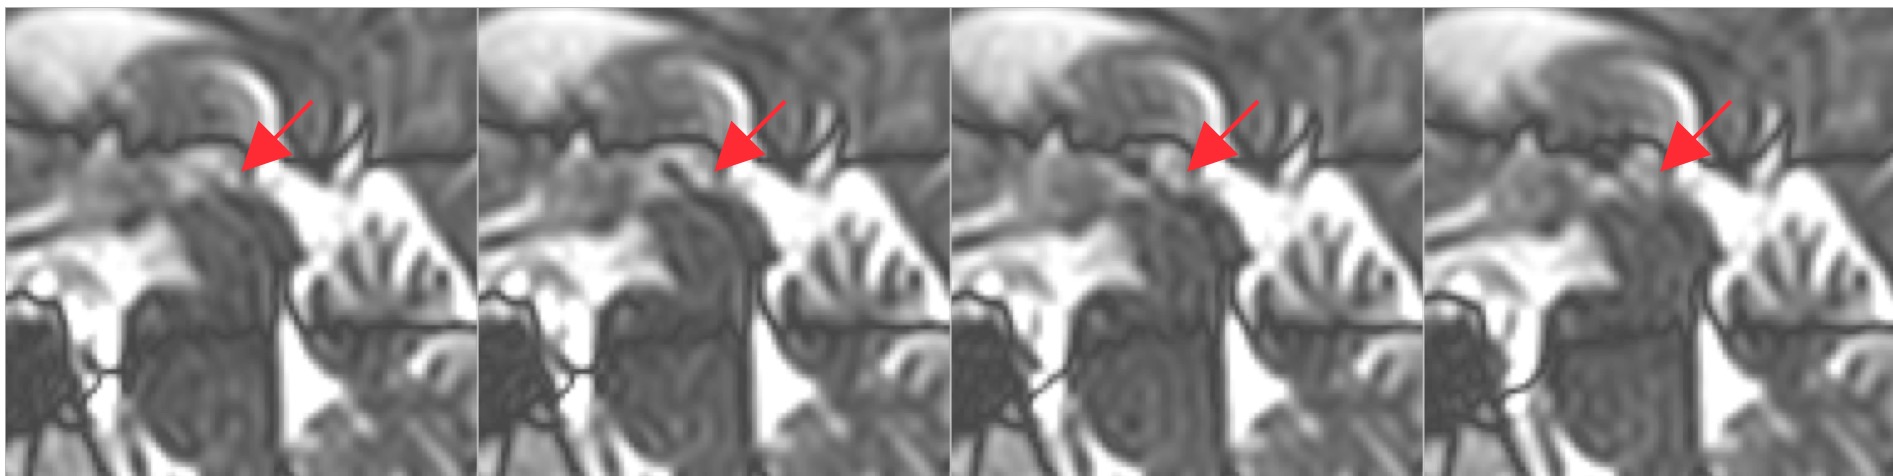
Jet flow at the aqueduct is seen (arrows). These frames were taken 1090msec
apart each other, from left to right.