2971
A Single-Compartment Perfusion Phantom for ASL-MRI1Neurology, Perelman School of Medicine, University of Pennsylvania, Philadelphia, PA, United States, 2Mechanical Engineering and Applied Mechanics, Chemical and Biomolecular Engineering, University of Pennsilvania, Philadelphia, PA, United States, 3Radiology, Perelman School of Medicine, University of Pennsylvania, Philadelphia, PA, United States
Synopsis
ASL MRI uses arterial blood water as a diffusible tracer for noninvasive quantification of CBF in physiological units. To produce reliable results across platforms and across subjects, ASL MRI protocols need to be calibrated against a sample with known properties, but it is challenging to simulate tissue perfusion in a mechanical phantom. In this study we present a 3D printed ASL perfusion phantom based on a fluid dynamics model.
Introduction
Arterial spin labeled (ASL) perfusion MRI1 uses magnetically labeled arterial blood water as a tracer for quantifying perfusion in absolute physiological units of ml/g/min. To achieve multi-site, cross-subject, and longitudinal reliability, ASL sequences should ideally be calibrated. A mechanical phantom capable of producing calibrated perfusion signals will help achieve this goal. A fundamental difference between perfusion quantification and flow quantification is that perfusion quantification relies on a freely diffusible tracer and a well-mixed compartment. However, simulating biological mixing through tissue vasculature and microvasculature in a mechanical phantom is challenging. We present a novel 3D-printed perfusion phantom based on fluid dynamics modeling, in which mixing is achieved by the collision of inflowing fluid jets.Methods
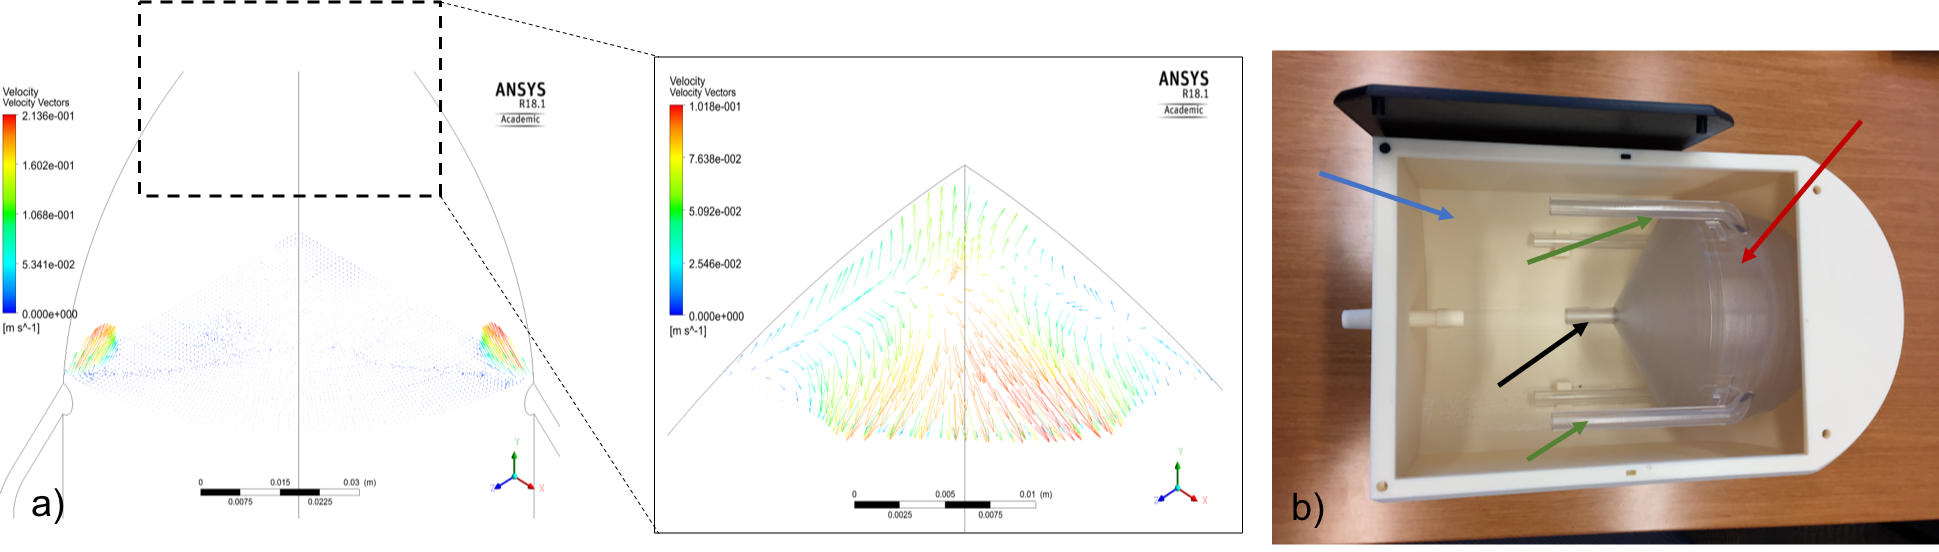
A fluid dynamics model was used to simulate mixing through bulk inflowing water and the resulting design was 3D printed (Fig 1a). Both fluid flow and particle tracking simulations were used to validate real-time MRI imaging of the labeled fluid. Simulations, conducted with respect to the symmetry of the phantom, predict the fluid impinges at the center of the sphere and travels towards the exposed spherical edge. Additionally, the fluid is expected to decelerate as it disperses radially along the spherical edge of the phantom.
A Masterflex L/S programmable peristaltic pump (Cole-Parmer) was used to circulate water through the phantom with continuous flow. The phantom included a surrounding water reservoir (Fig. 1b,) designed to act as a bubble trap. Water is pulled out of the phantom through a single outflow channel and circulated back into the reservoir before re-entering phantom, allowing Mz to reach equilibrium and bubbles to escape. Inflow tube diameters of 5 mm were designed to produce a flow velocity of 20 cm/s at a perfusion rate of 50 ml/100g/min.
To validate the phantom, 10 label-control image pairs were acquired with pseudocontinuous ASL and 3D stack of spirals readout2. Data were acquired with labeling duration (LD) 1500 ms and pump rates 500, 600 mL/min with PLDs ranging from 100 to 3500 ms. The following imaging parameters were used in this study: TR = 6 s, resolution = 3.75 x 3.75 x 3.75 mm3, matrix = 64 x 64 x 34, partial Fourier = 6/8, echo train length = 26, spiral interleaves per partition = 2, water T1 = 1500 ms. The labeling location was across the four inflow tubes (green arrows in Fig 1b).
Buxton’s general kinetic model for continuous ASL3 was used to test our prediction, based on the fluid dynamics modeling, of perfusion-like signal near the top of the phantom. Comparing theoretical predictions with experimental results allows qualitative assessment of the perfusion signals inside the phantom.
Results
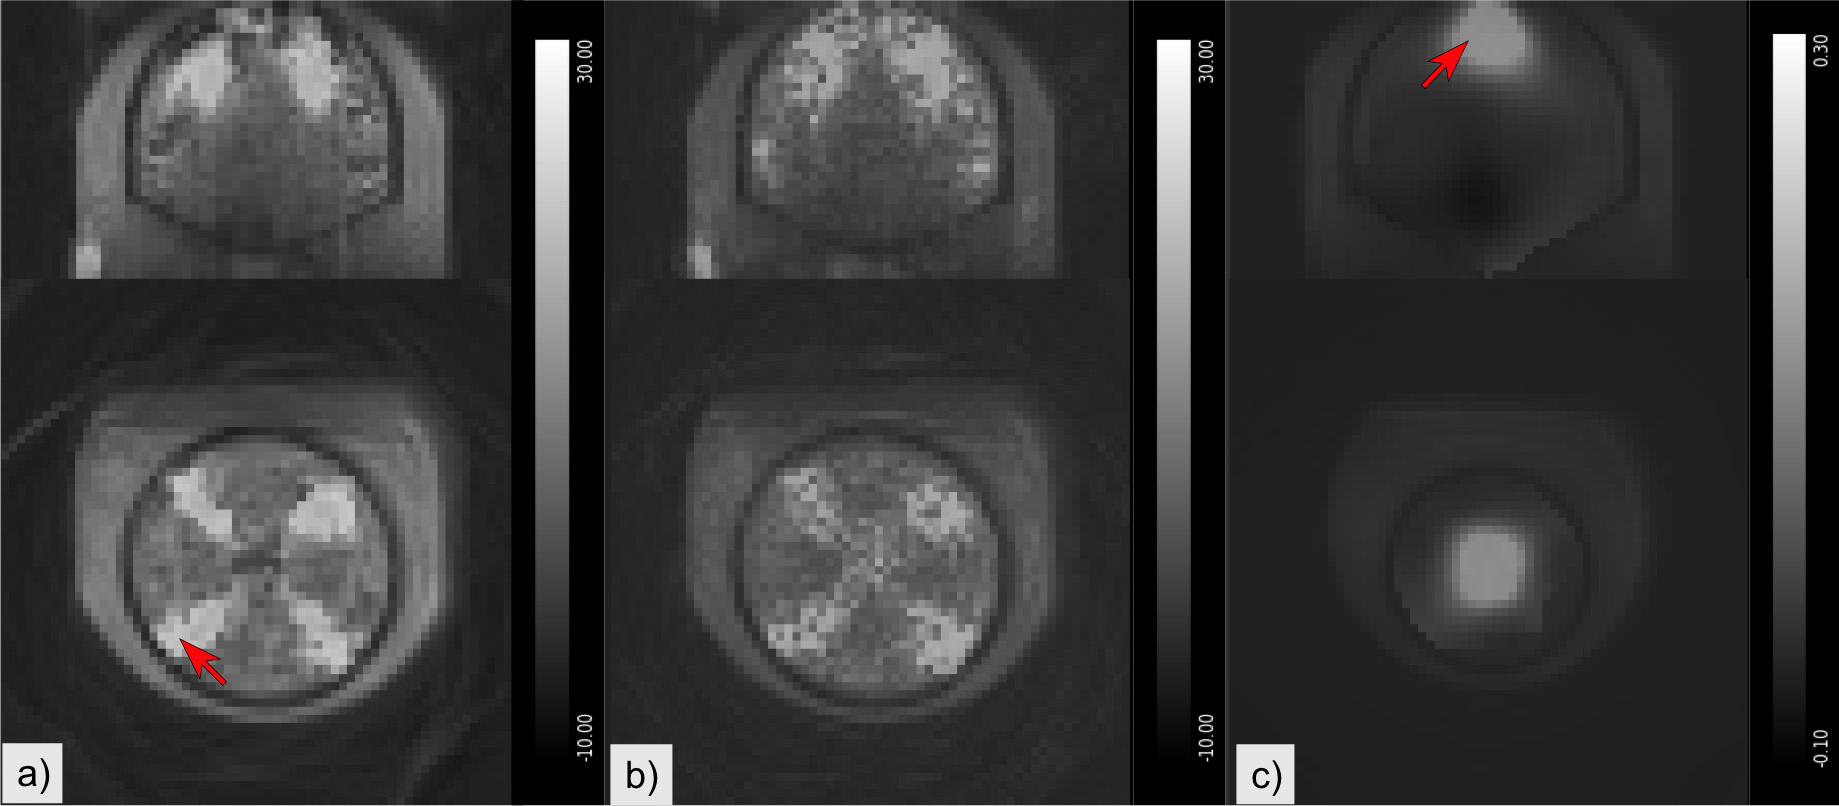
Representative ASL MRI control-label images from the phantom are shown in Fig. 2s. Maps of the standard deviation over the 10 label-control repetitions show chaotic effects of turbulent flow on imaging signal intensities near the top of the phantom (Fig 2b). Although the phantom was designed to replicate human gray matter perfusion excessive turbulent flow was found to impede imaging at flow rates found in the human brain, requiring the use of reduced flow rates. To address the spatially varying flow-related image degradation, we performed variance-weighted smoothing of the M0-normalized mean label-control difference using a 3D Gaussian kernel with standard deviation of 3 voxels. This produced a map with contributions primarily from voxels that have stable values in a homogeneous region (Fig 2c). The location of this reliably detectable signal coincided with the predicted location of maximal fluid deceleration and mixing.
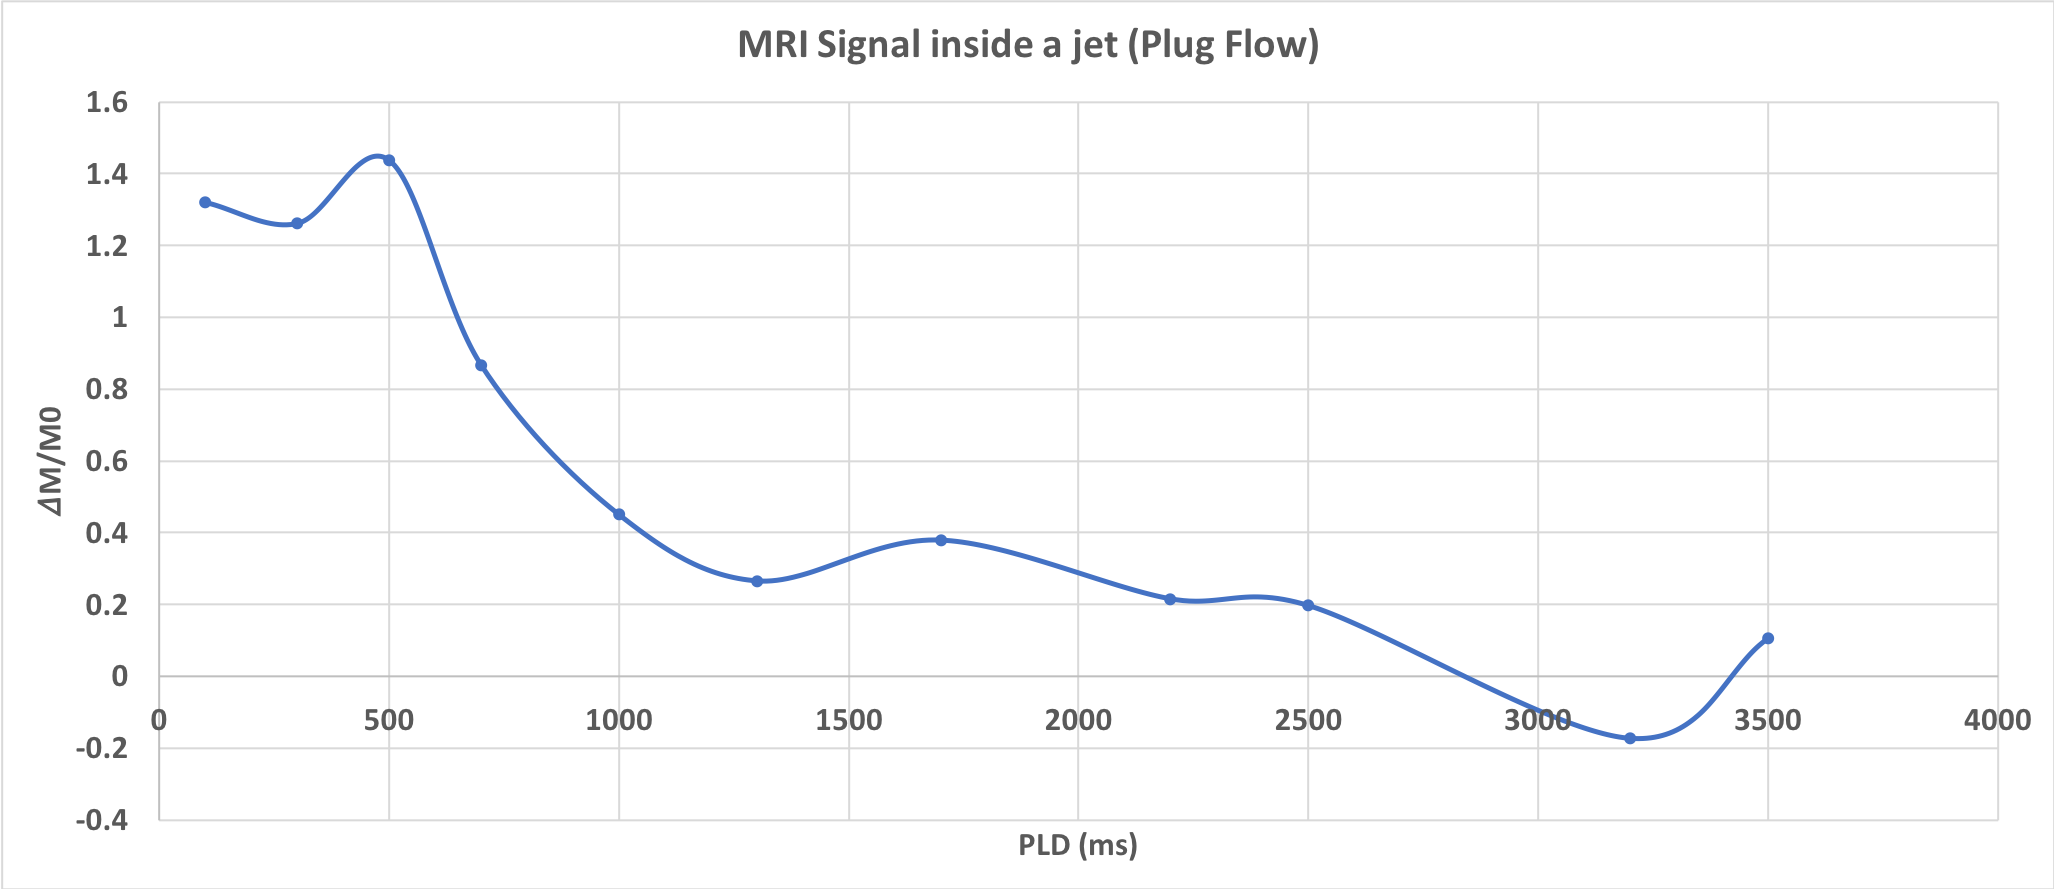
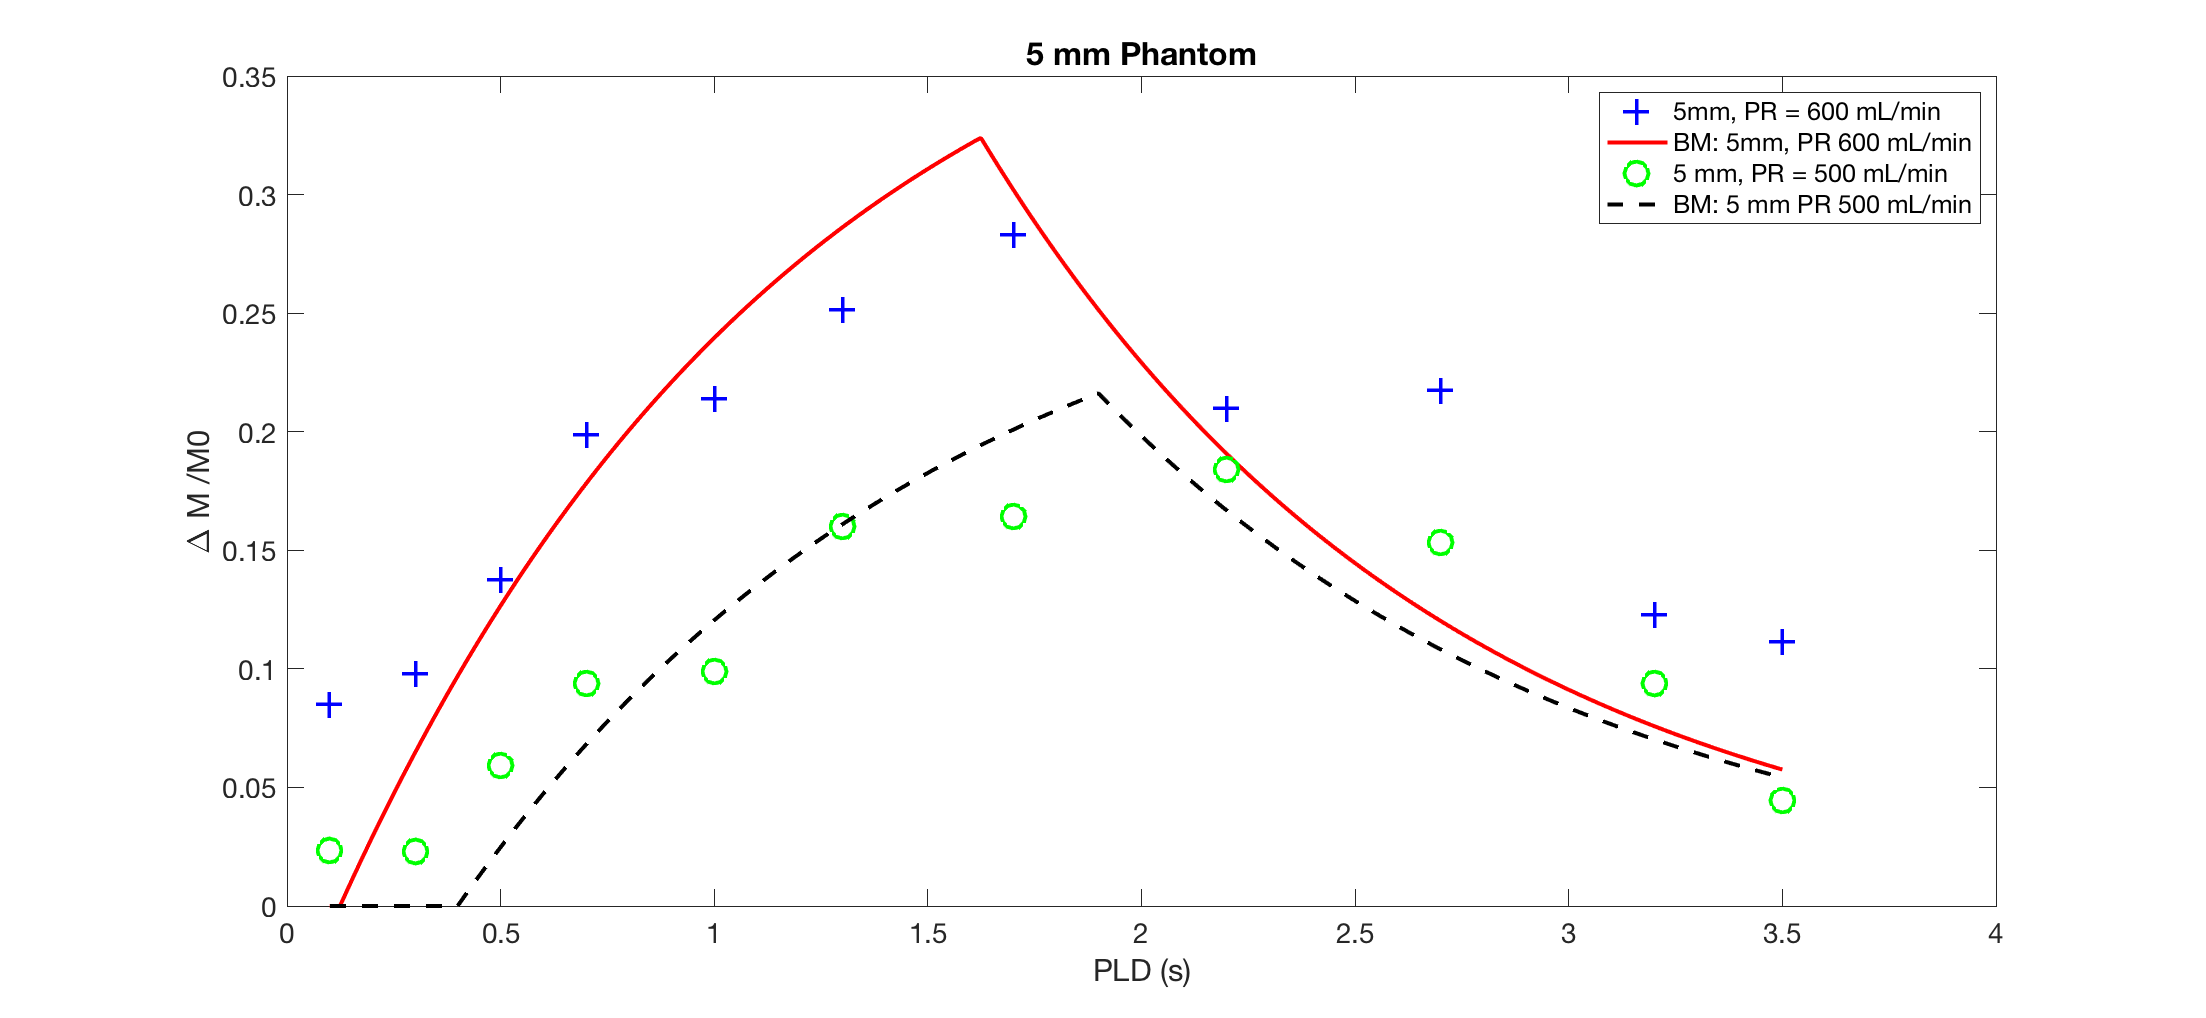
Fig. 3 shows the mean label-control difference over the range of measured PLDs for a voxel inside the fluid jet region within the phantom (see Fig 2a). The resulting time course is roughly consistent with plug flow of the label in this region. Figure 4 shows measurement from the perfused region at flow rates of 500 ml/min and 600 ml/min (see Fig 2c). Increasing the pump rate resulted in increased perfusion and reduced transit times. Model fits showed that 600 ml/min produces a 25% increase in perfusion and a ~0.3s reduction in transit time as compared to 500 mL/min. The perfusion rate is likely overestimated due to concomitant labeling efficiency changes since at these flow rates the flow velocity in the inflow tubes was in the 10-15 cm/sec range, where pCASL labeling efficiency becomes velocity dependent4.
Conclusions
Perfusion-like signals can be obtained using a single compartment phantom wherein mixing is achieved through impinging flow patterns, though further adjustments in total flow and inflow velocities are needed to allow reliable imaging using ASL sequences designed for human brain perfusion imaging. The programmable pump will also allow the effects of pulsatile flow on labeling efficiency to be evaluated.
Acknowledgements
This work was funded by NIH grants R00HD074649, MH080729, EB015893, and T32MH106442.References
- Detre JA, Leigh JS, Williams DS, Koretsky AP. Perfusion imaging. Magn Reson Med 1992;23(1):37–45.
- Vidorreta M, Wang Z, Chang YV, Wolk DA, Fernández-Seara MA, Detre JA. Whole-brain background-suppressed pCASL MRI with 1D-accelerated 3D RARE Stack-Of-Spirals readout. PLoS One. 2017 Aug 24;12(8):e0183762. doi: 10.1371/journal.pone.0183762. eCollection 2017
- Buxton RB, Frank LR, Wong EC, Siewert B, Warach S, Edelman RR. A general kinetic model for quantitative perfusion imaging with arterial spin labeling. Magn Reson Med 1998;40(3):383–96.
- Dai W, Garcia DM, de Bazelaire C, Alsop DC. Continuous flow-driven inversion for arterial spin labeling using pulsed radio frequency and gradient fields. Magn Reson Med. 2008; 60: 1488–1497. https://doi. org/10.1002/mrm.21790 PMID: 19025913
Figures