2969
Automatic Brain Tissue Detection using Rapid 3D Quantification of R1 and R2 Rates and Proton Density1CMIV, Linköping, Sweden, 2SyntheticMR AB, Linköping, Sweden, 3Department of Medical and Health Sciences, Radiology, Linköping, Sweden, 4Radiation Physics, Linköping, Sweden
Synopsis
Absolute quantification of R1 and R2 relaxation rates and proton density PD has been gaining considerable attention in recent years. Quantification provides an absolute scaling of patient properties that is independent of MR scanner settings or imperfections. Simultaneous quantification of R1, R2 and PD has mostly been restricted to 2D acquisitions methods, with relatively thick slices. A novel rapid 3D quantification method provides the maps at 1.2 mm isotropic resolution in 6 minutes scan time. The method was validated against a more established 2D method to measure white matter, grey matter, CSF and myelin volumes in the brain
Purpose
Absolute quantification of MRI properties such as R1 and R2 relaxation and proton density PD can provide objective measures in MRI [1]. The properties are patient specific and therefore independent of MRI scanner settings or scanner brand. Most methods, however, are restricted to 2D acquisitions, with a reasonable in-plane resolution but with relatively thick slices. Recently, a cardiac 3D quantification method was published to measure R1, R2 and PD of the entire myocardium in a single breath-hold [2,3]. This method, called QALAS, is generally applicable and the aim of this work was to apply QALAS on the brain, providing an isotropic resolution of 1.2 mm, allowing reformats in all orientations. Based on the maps brain tissue volumes can be automatically segmented into white matter, grey matter and cerebrospinal fluid [4], as well as myelin [5]. The automatic brain volume segmentation results based on R1, R2 and PD maps provided by QALAS were compared with the maps provided by the existing 2D MDME method [6].Methods
QALAS is a segmented 3D spoiled gradient echo sequence with 5 parallel acquisitions, interleaved with a T2 preparation and inversion pulse. MDME is a saturation recovery multi-slice TSE sequence with multi-echo read-out. Both sequences generate multiple (5 and 8, respectively) images in 6 minutes scan time with different effects of R1 and R2 relaxation, allowing the calculation of the R1 and R2 relaxation rates and proton density PD. Based on these maps, brain tissue volumes can be segmented. A group of 12 volunteers was acquired with the two quantification methods, twice and at 1.5T and 3T. The automatically segmented brain volumes of WM, GM, CSF and myelin were correlated using the Pearson correlation coefficient. The mean difference and standard deviation of the differences were analyzed between measurement 1 and 2, between methods and between field strengths. All post-processing was performed by SyMRI v18Q3 (SyntheticMR, Sweden). Both scanners were patched Ingenia systems at R5.3 of Philips Healthcare (Best, the Netherlands).Results
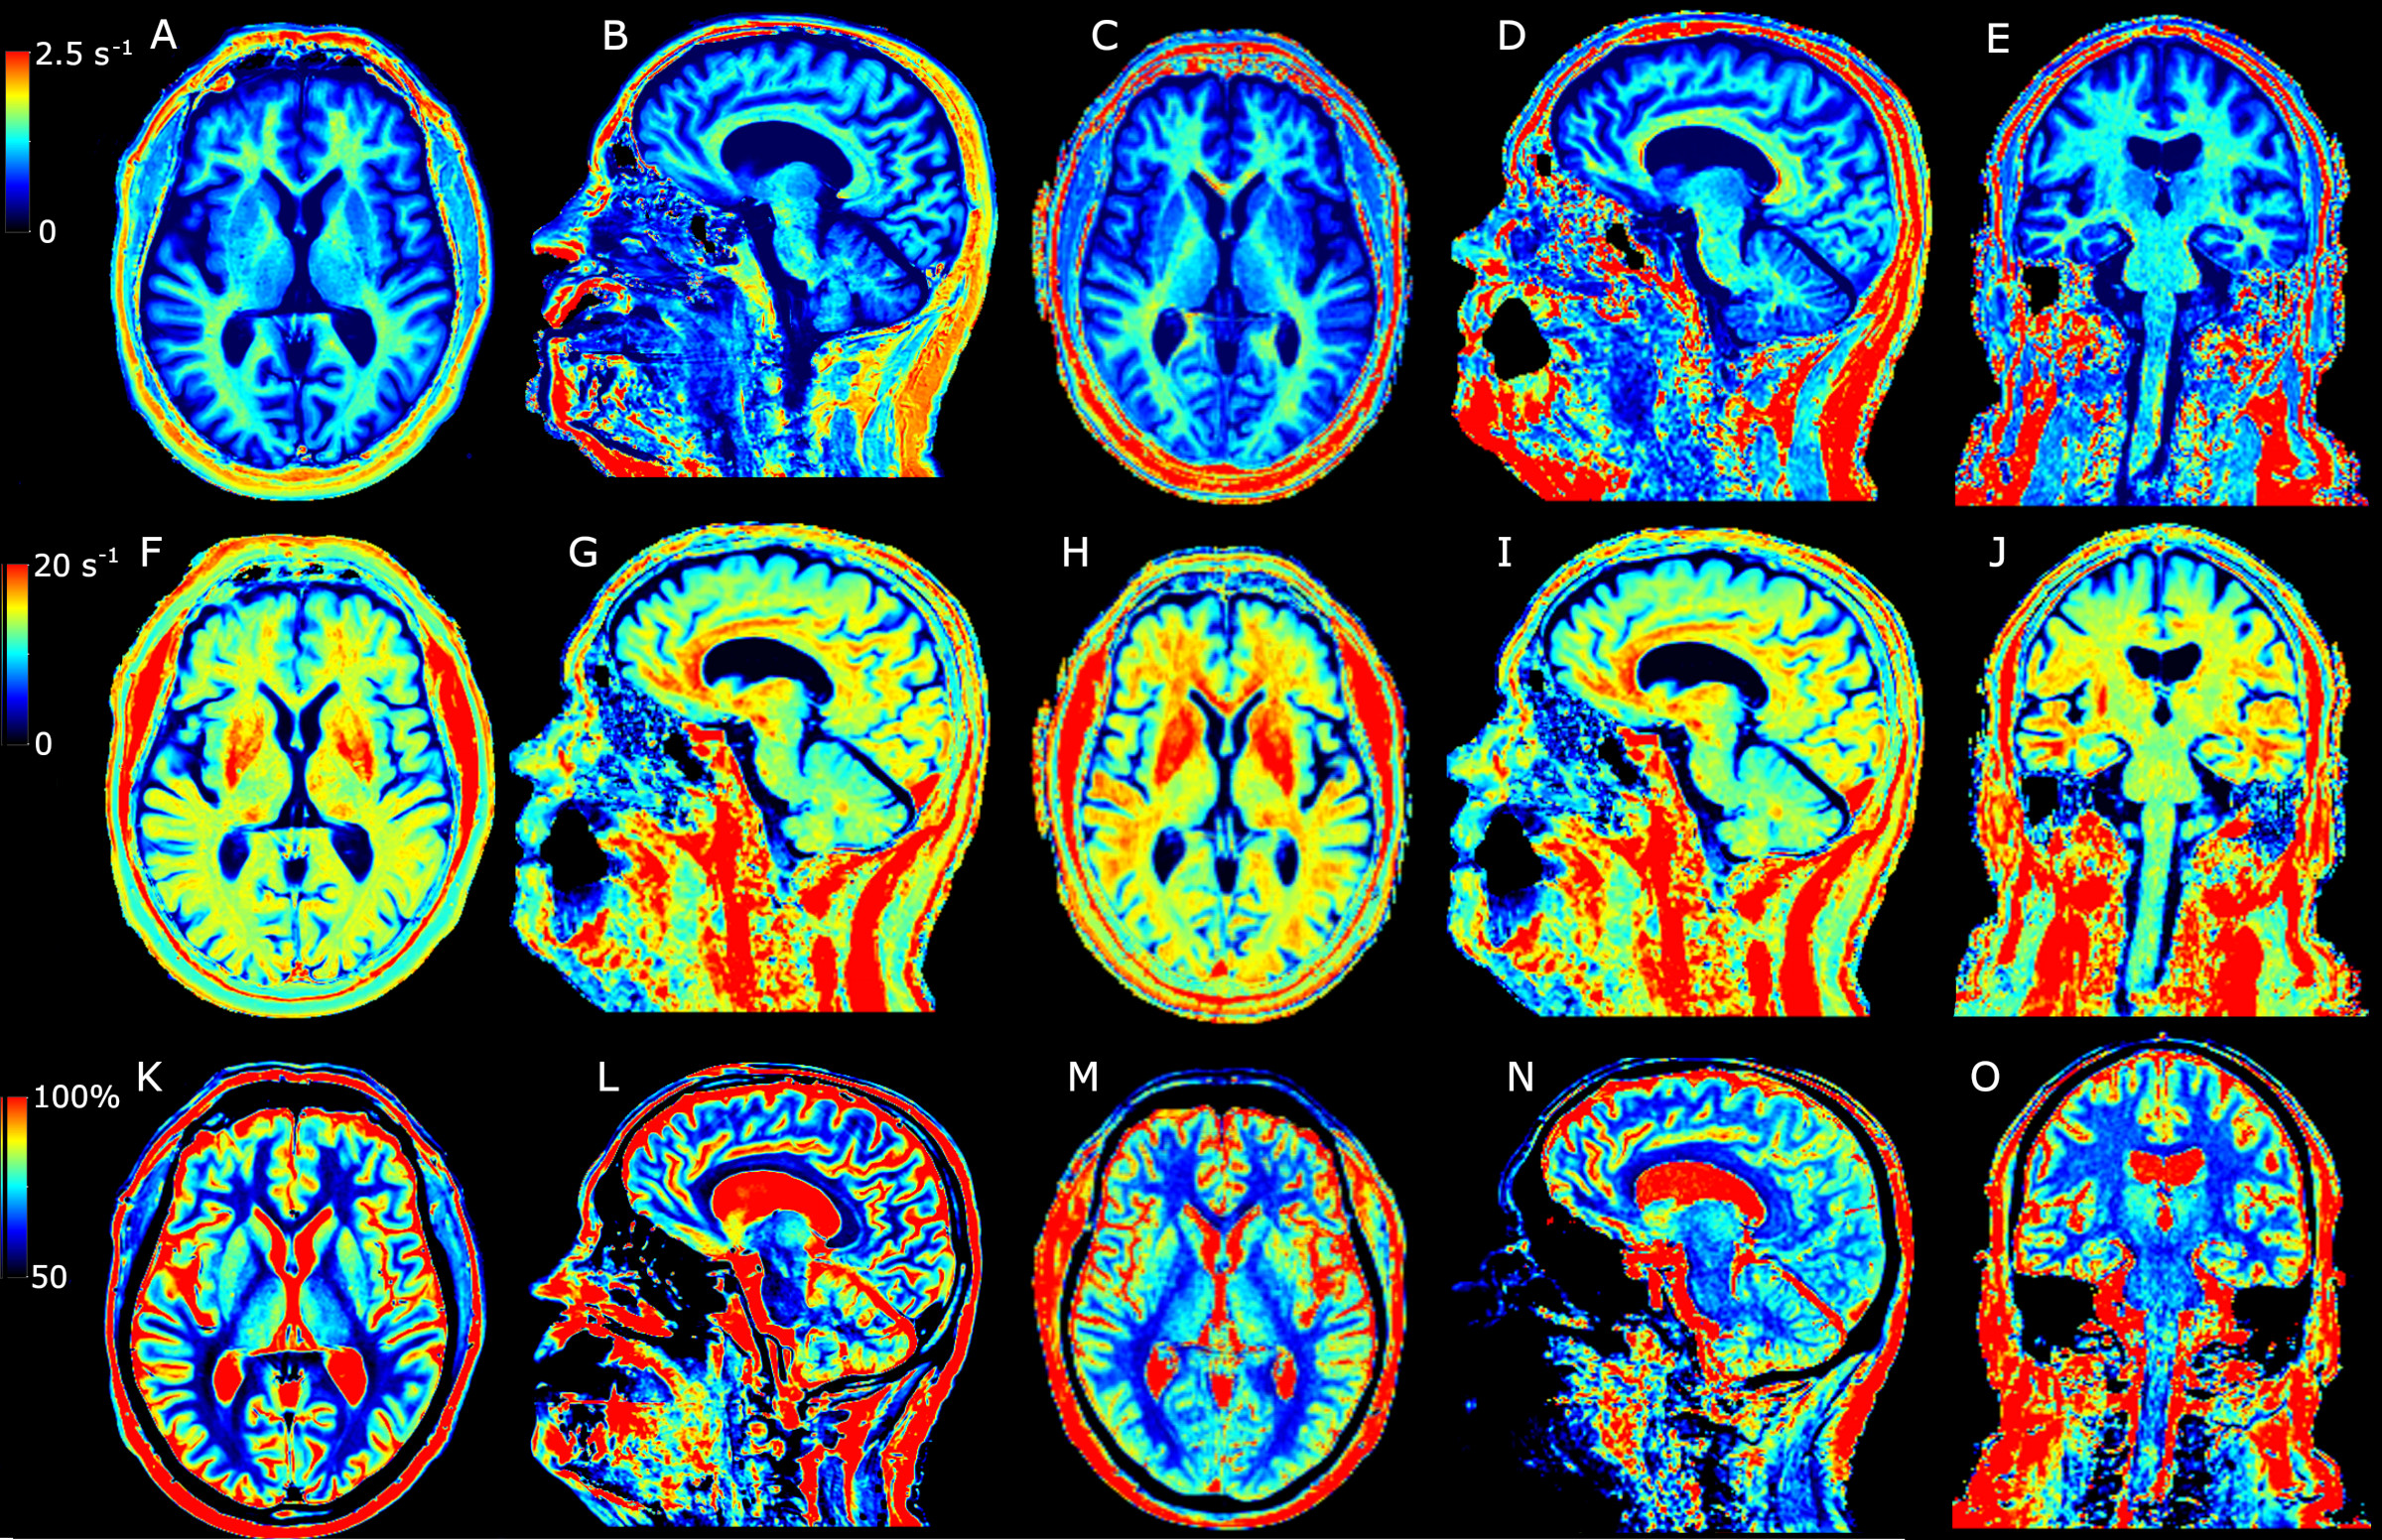
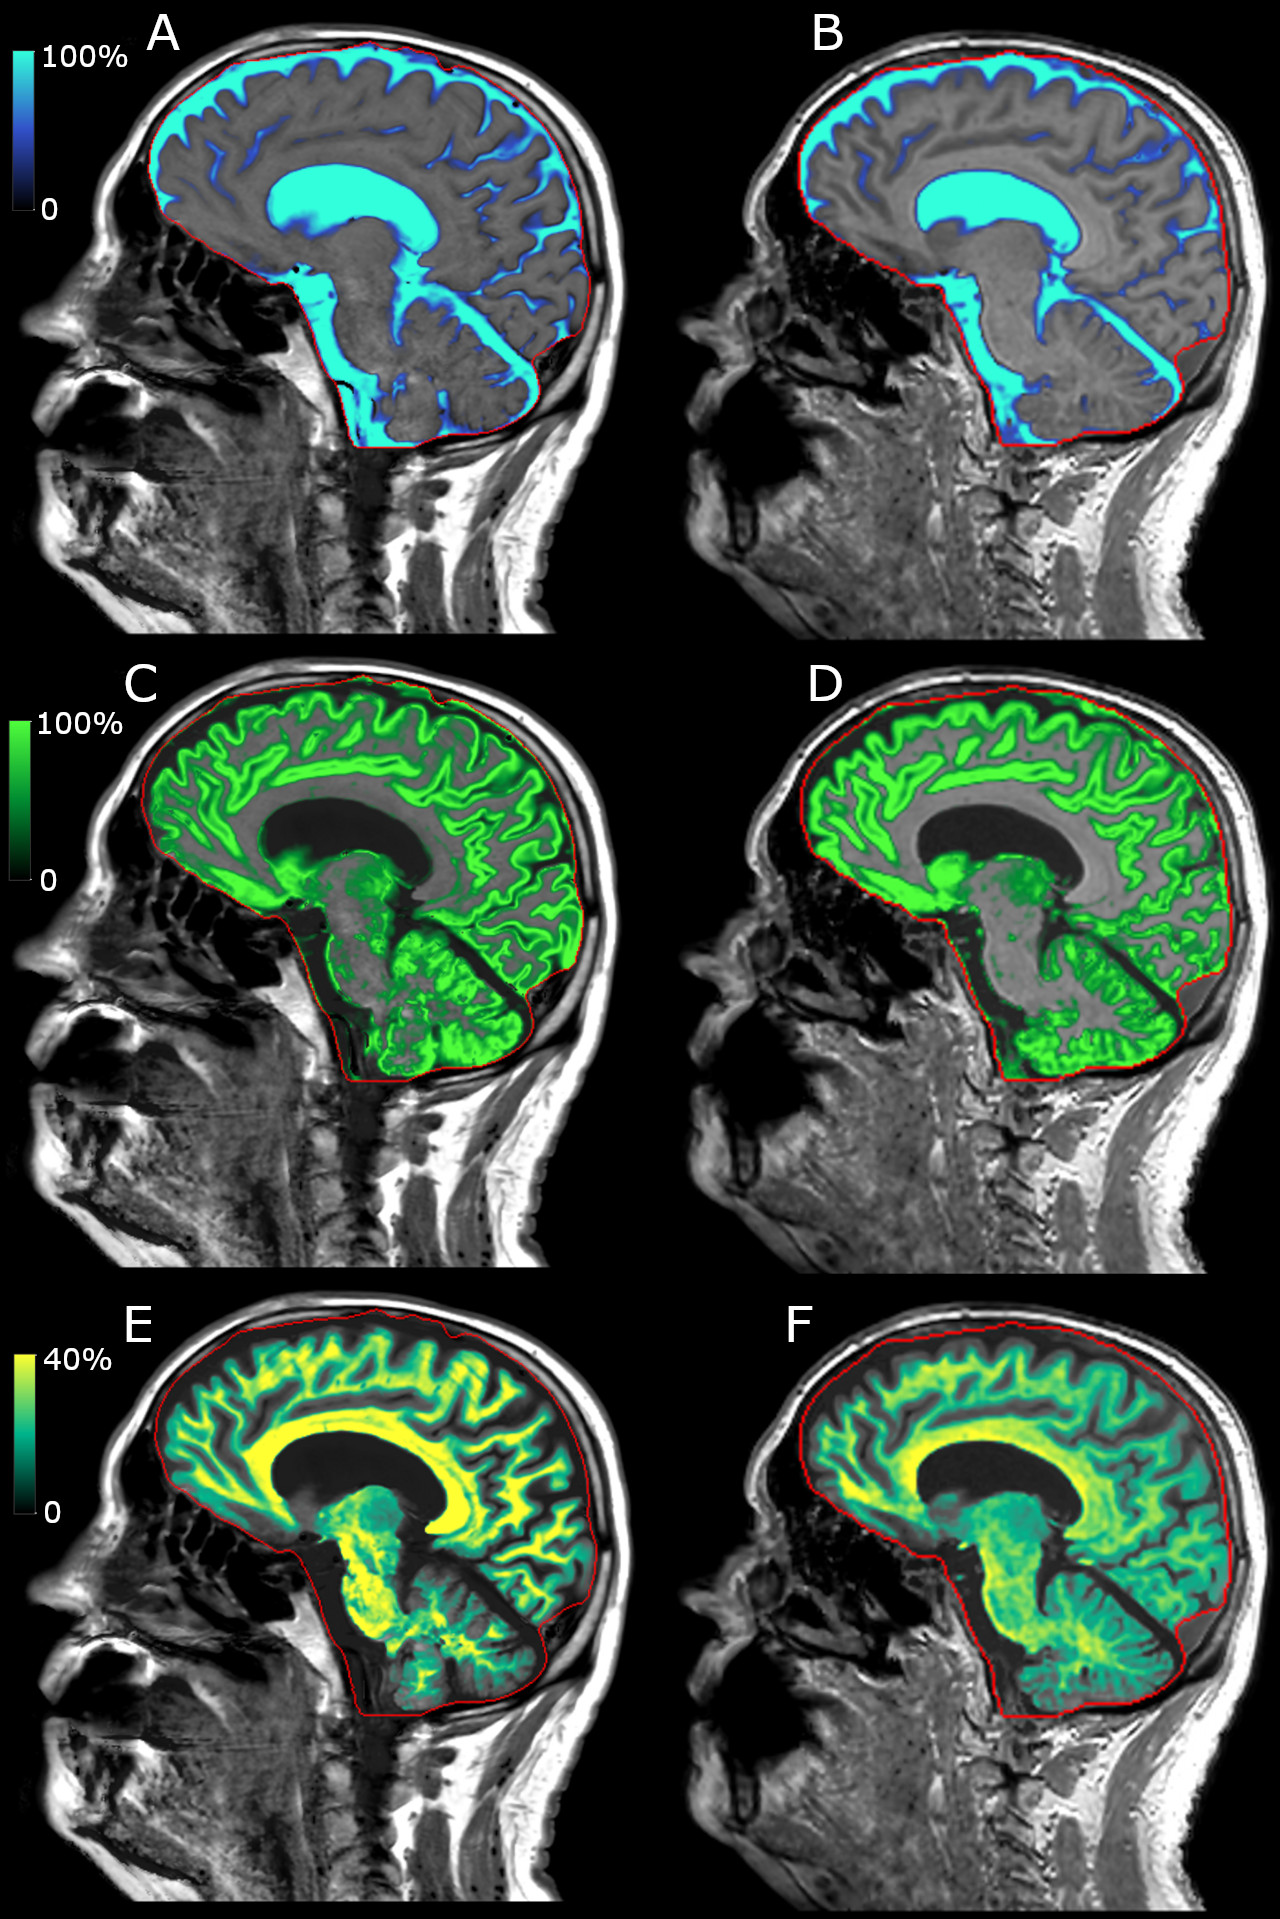
The Pearson correlation coefficients of measurement 1 and 2 were larger than 0.95 for WM, GM, CSF, myelin, total brain and intracranial volumes for both methods at 1.5T and 3T. The mean difference (2-1) was -1±10 ml for brain and -1±9 ml for ICV using MDME at 1.5T. At 3T this was -5±14 ml and -7±17 ml, respectively. Using QALAS this was -7±28 ml and -11±33 ml at 1.5T and 6±21 ml and 7±17 ml at 3T. The standard deviation of the differences was hence better than 0.4% of the ICV for MDME and better than 0.6% of the ICV for QALAS. Small but significant differences were observed between MDME and QALAS for CSF (-24±15 ml) and BPV (+31±28 ml). No significant differences were found for WM, GM or myelin between the two methods. In the first figure, R1, R2 and PD maps of one subject are shown who, scanned with MDME in axial and sagittal orientation and with a single QALAS acquisition with reformats in axial, sagittal and coronal orientation. In the second figure representative segmentation maps of CSF, GM and myelin are shown using the MDME and QALAS acquisitions.Conclusions
Absolute quantification of R1, R2 and PD in 3D isotropic resolution provides very similar values compared to the more established 2D MDME method. Automatic Brain tissue volume estimations based on the quantitative maps were very similar. Quantitative MRI may provide more objective decision support and abundant information in a very short scan time.Acknowledgements
No acknowledgement found.References
1. Hagiwara et al. SyMRI of the Brain: Rapid Quantification of Relaxation Rates and Proton Density, With Synthetic MRI, Automatic Brain Segmentation, and Myelin Measurement. Invest Radiol. 2017;52:647-65.
2. Kvernby et al. Simultaneous three-dimensional myocardial T1 and T2 mapping in one breath hold with 3D-QALAS. J Cardiovasc Magn Reson 2014;16:102-105.
3. Kvernby et al. Clinical feasibility of 3D-QALAS - Single breath-hold 3D myocardial T1- and T2-mapping. Magn Reson Imaging 2017;38:13-2.
4. West et al. Novel whole brain segmentation and volume estimation using quantitative MRI. Eur Radiol. 2012;22:998-1007.
5. Warntjes et al. Myelin Detection Using Rapid Quantitative MR Imaging Correlated to Macroscopically Registered Luxol Fast Blue-Stained Brain Specimens. AJNR Am J Neuroradiol. 2017;38:1096-1102.
6. Warntjes et al. Rapid magnetic resonance quantification on the brain: Optimization for clinical usage. Magn Reson Med 2008;60:320-329.
Figures