2957
QUANTIFICATION OF HETEROGENEITY TO CLASSIFY BENIGN PAROTID TUMORS1Postgraduation School of Radiodiagnostic of Milan, Università degli Studi di Milano, Milan, Italy, 2Department of Electrical Engineering and Information Technologies, University "Federico II" of Naples, Napoli, Italy, 3Ospedale San Paolo, Milano, Lombardia, Italia, Italy, 4Roberta Fusco, Istituto Nazionale Tumori - IRCCS - Fondazione G. Pascale, Napoli, Italy
Synopsis
Warthin tumors (WT) and pleomorphic adenomas (PA) are the most frequent parotid lesions. Despite they are both benign tumors, they are associated with different risk of recurrence and malignant degeneration, which entails diverse management.Benign parotid surgery is challenging since it requires isolation and preservation of the facial nerve, whilst completely removing the tumor.A correct preoperative planning including differential diagnosis, is therefore needed to avoid unnecessary or inadequate surgery.
In this study we use functional perfusion and diffusion MR biomarkers and we quantify their heterogeneity by a histogram analysis in order to classify WT and PA.
INTRODUCTION
Warthin tumors (WT) and pleomorphic adenomas (PA) are the most frequent salivary gland nodules, representing almost 90% of all parotid tumors 1–4. Multi-Parametric Magnetic Resonance Imaging (MP-MRI) is a widely recognized technique for the differential diagnosis of parotid tumors, providing functional radiological biomarkers with Dynamic-Contrast-Enhanced-MRI (DCE-MRI) and Diffusion-Weighted–MRI (DW-MRI) sequences 5–8. Histogram descriptors of imaging data have been successfully employed to describe tumor heterogeneity in a variety of neoplasms, showing a good correlation with histopathology and underlying genotype 9–11. However, despite a number of pathological studies highlighting the potential clinical relevance of tumor heterogeneity assessment in salivary gland neoplasms 12, few imaging reports have explored this field and no study adopted histogram analysis to quantify heterogeneity on MR functional imaging. Notably, imaging evaluation of heterogeneity could enhance the accuracy of salivary gland tumor differential diagnosis, capturing the entire tumor volume and thus overcoming the sampling error, which is one of the main limits of fine needle biopsy 13. The purpose of this study is to explore the potential role of intra- and inter-tumor heterogeneity in discriminating WT and PA. Furthermore, we seek to verify the employment of functional imaging parameters, namely IVIM and DCE- MR features, in the differential diagnosis of WT and PA.MATERIALS AND METHODS
A total of 36 pathologically proven parotid tumors (18 WT and 18 PA) in 25 consecutive enrolled patients (12 women and 13 men) were included in this study.
A 1,5T MR scanner was employed. DCE-MR protocol included consecutive scans acquired every 17 s for a total of about 4 minutes. DW-MR images were obtained using 11 different b values (0, 10, 20, 30, 50, 80, 100, 200, 300, 400, e 800 s/mm2) according to IVIM requirements.
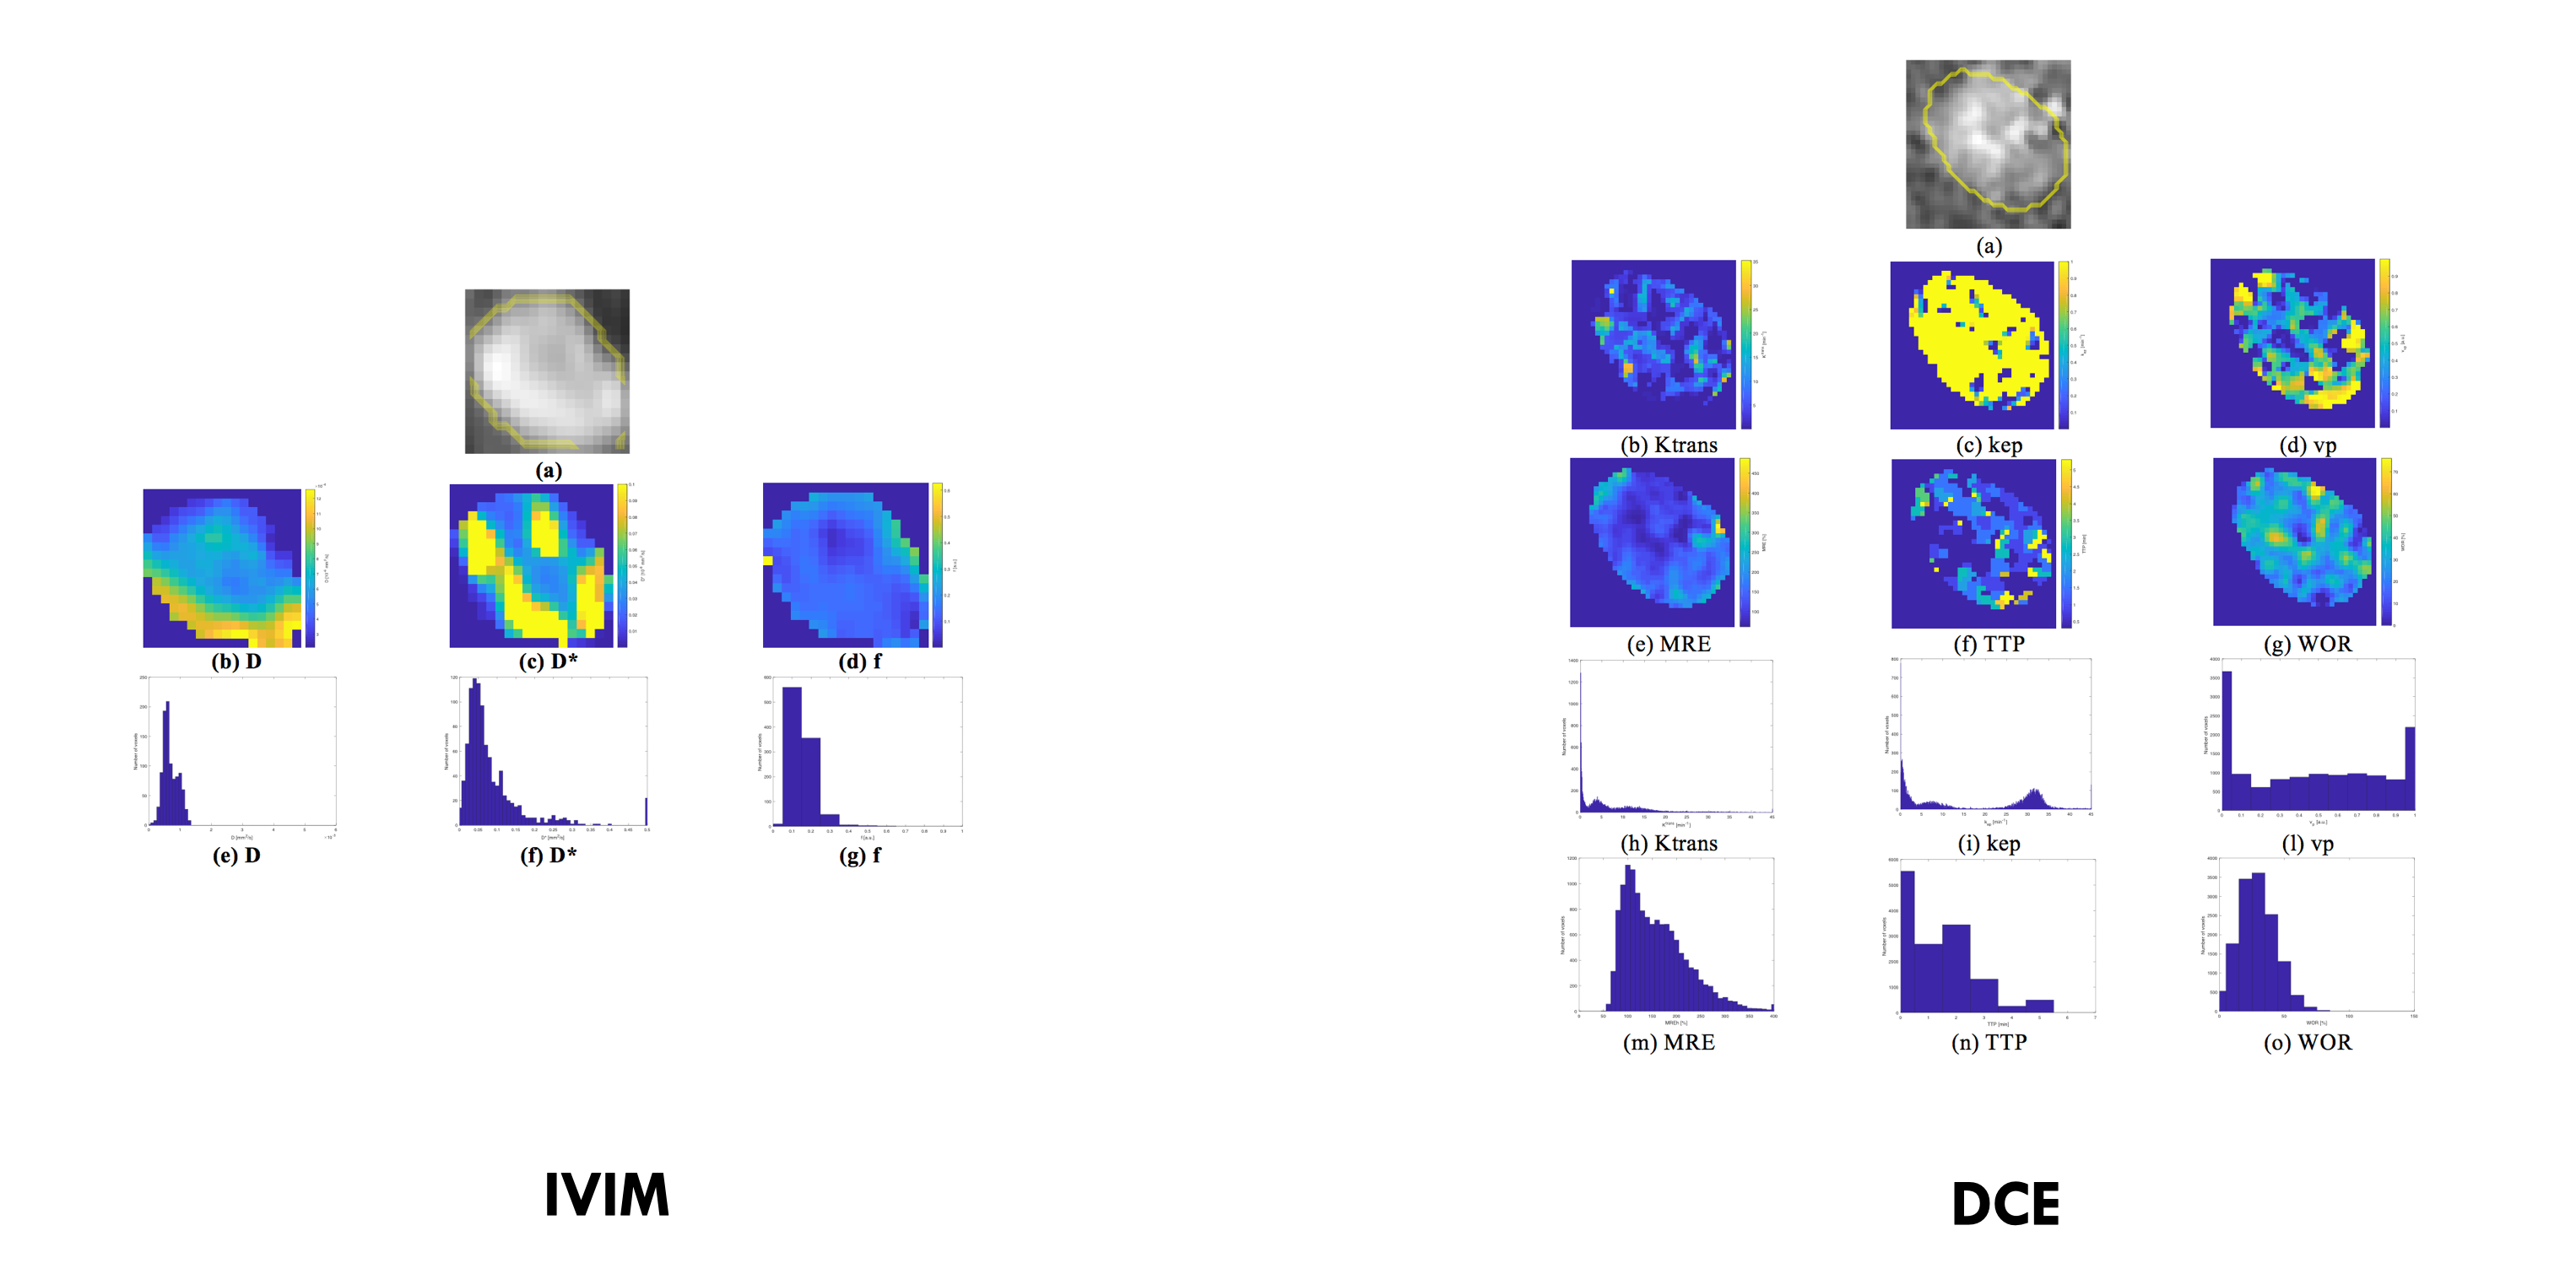
For both DCE-MRI and DW-MRI, model-free and model-based parameters were computed voxel-by-voxel on manually segmented volumes of interest (VOIs). For each lesion, the following functional biomarkers were considered: Ktrans, kep, vp, MRE, TTP, WIS, WOS, WOR, MRE, f, D, D*. A histogram analysis was performed, identifying for each MRI biomarker, central tendency features (mean, median) and heterogeneity parameters (standard deviation, kurtosis, skewness, mad, energy and entropy) (Fig 1).
Univariate and bivariate analysis (the latter based on Linear Discriminant Analysis) were performed to identify respectively the parameter and the pairs of parameters with the best accuracy. The Wilcoxon signed-rank test, receiver operating characteristic ROC curves and eventually the leave-one-out cross-validation were employed.
RESULTS AND DISCUSSION
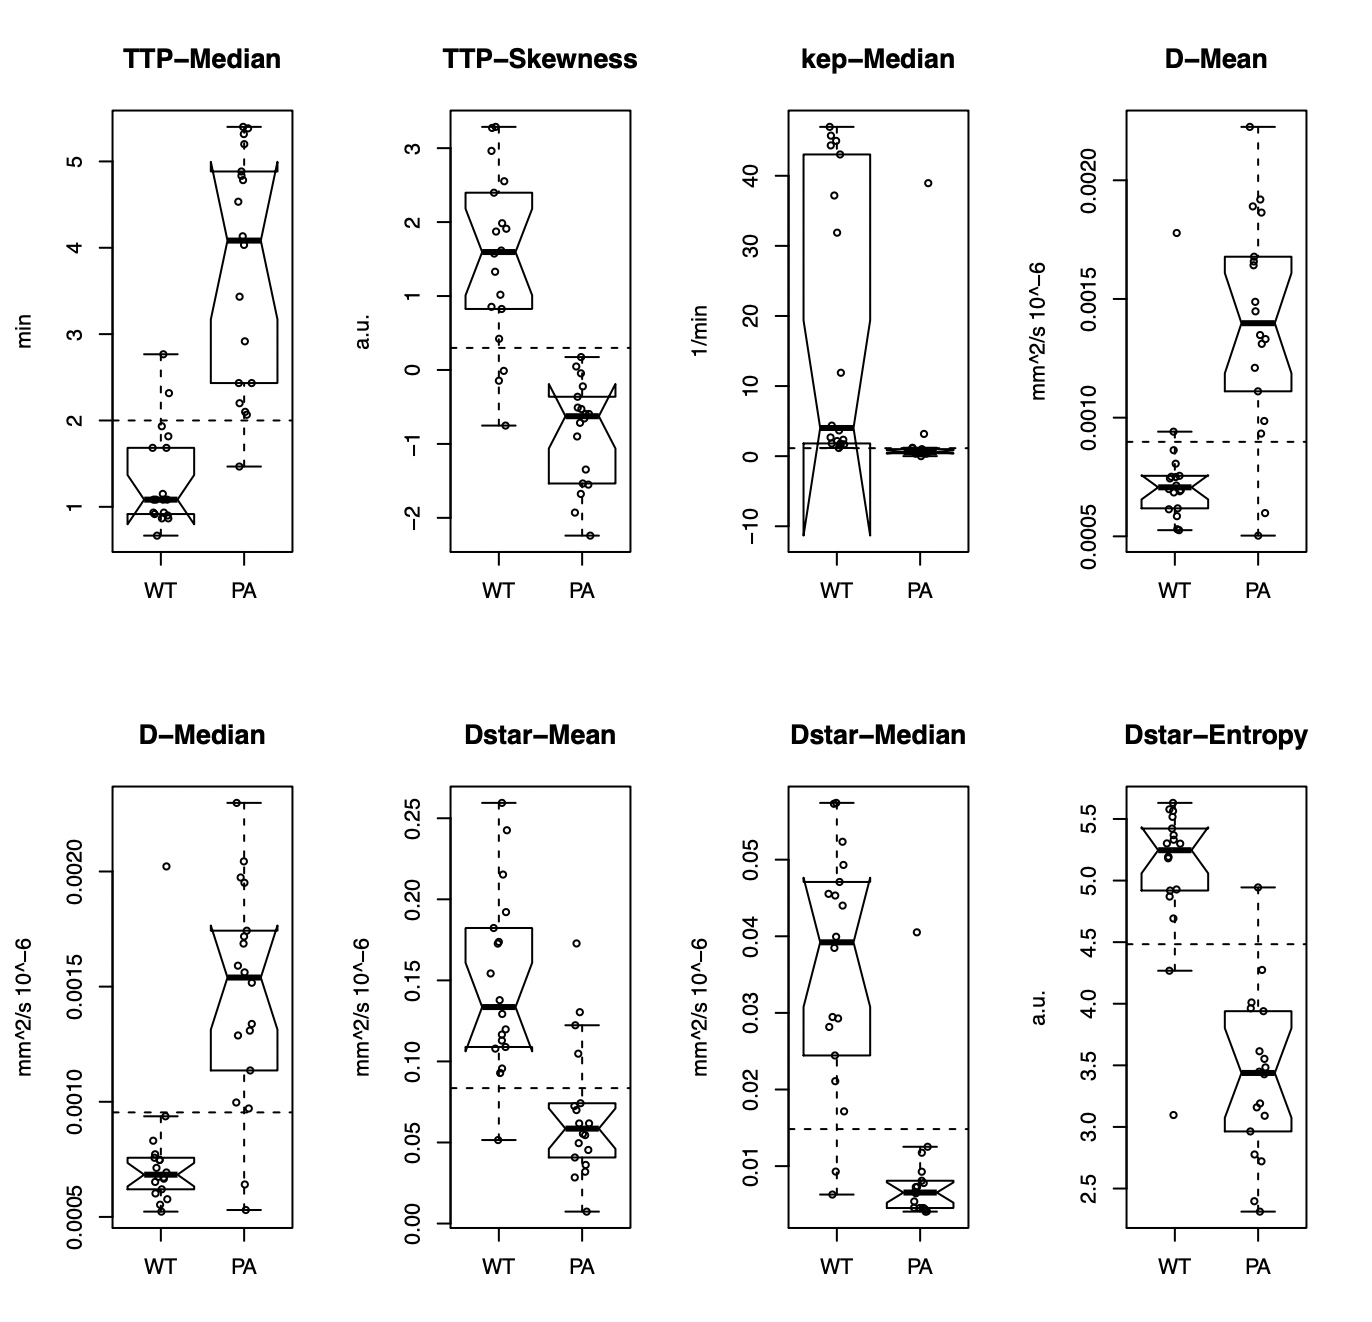
Significant difference (p < 0,05 at Wilcoxon test) between WT and PA was found for all histogram parameters. Specifically, difference was observed in heterogeneity parameters of WOS, TTP, MRE, D*, f and D, and in central tendency parameters of all features except for WIS and Vp (fig 2). The fact that WOS and D* presented significant difference for all histogram parameters suggests that the main distinction between PA and WT, especially with respect to heterogeneity, may lie in vascular distribution rather than parenchymal composition.The prominence of vascularity was confirmed by ROC analysis of single features, since the best classifiers were 6 vascular parameters: TTP median and skewness, D* median, mean and entropy and Kep median (fig 3). As detailed in figure 4, D* mean, D* and Kep median, D*entropy and TTP skewness were significant higher in WT compared to PA, reflecting a rich and inhomogeneous vascularization. Indeed, WT are known for an extensive and leaky small blood vessel network14, which can result in more intense, but also heterogeneous perfusion. Vice versa, PA are reported to be relatively hypovascular tumors, with low density of microvessels 14-16. Notably, the results of ROC analysis also stated that both central tendency and heterogeneity parameters were able to distinguish WT from PA: the largest AUC were obtained using TTP median and skewness and D* median and entropy (fig 3). Therefore, heterogeneity parameters may integrate the information from mean and median values, increasing diagnostic accuracy.
These conclusions were confirmed by the bivariate analysis that demonstrated that the association of heterogeneity parameters combined together or with central tendency parameters can provide an accurate diagnosis of WT and PA (fig 5). In addition, the bivariate analysis assessed once again the importance of vascularity, since all the pairs reported in fig5 are composed by vascular biomarkers provided by both DCE and IVIM sequences. However, it should be mentioned that in comparing the results of the univariate and bivariate analysis, it seems that no meaningful improvement of classification performance can be obtained using two features (the misclassification error corresponds to 2 with 2 features and to 3 with 1 feature).
CONCLUSION
Differential diagnosis of WT and PA may benefit from the use of IVIM and DCE parameters and from the information provided by histogram descriptorsAcknowledgements
References
- Barnes, L., Eveson, J.W., Reichart, P., Sidransky D. World Health Organization classification of tumours—pathology and genetics of head and neck tumours. iarc. (2005)
- Gao M, Hao Y, Huang MX, et al.Salivary gland tumours in a northern Chinese population: a 50-year retrospective study of 7190 cases. Int. J. Oral Maxillofac. Surg.[Internet]. 46(3), 343–349 (2017).
- Aparecida De Oliveira F, Barroso EC, Ae D, et al.Salivary Gland Tumor: A Review of 599 Cases in a Brazilian Population.
- Lukšić I, Virag M, Manojlović S, et al.Salivary gland tumours: 25 years of experience from a single institution in Croatia. J. Craniomaxillofac. Surg.[Internet]. 40(3), e75-81 (2012).
- Yabuuchi H, Matsuo Y, Kamitani T, et al.Parotid Gland Tumors: Can Addition of Diffusion-weighted MR Imaging to Dynamic Contrast-enhanced MR Imaging Improve Diagnostic Accuracy in Characterization? Radiology. 249(3), 909–916 (2008).
- Yabuuchi H, Fukuya T, Tajima T, Hachitanda Y, Tomita K, Koga M. Salivary gland tumors: diagnostic value of gadolinium-enhanced dynamic MR imaging with histopathologic correlation. Radiology. 226, 345–354 (2003).
- Espinoza S, Halimi P. Interpretation pearls for MR imaging of parotid gland tumor. Eur. Ann. Otorhinolaryngol. Head Neck Dis.[Internet]. 130(1), 30–35 (2013).
- Mikaszewski B, Markiet K, Smugała A, Stodulski D, Szurowska E, Stankiewicz C. Diffusion- and Perfusion-Weighted Magnetic Resonance Imaging—An Alternative to Fine Needle Biopsy or Only an Adjunct Test in Preoperative Differential Diagnostics of Malignant and Benign Parotid Tumors? J. Oral Maxillofac. Surg.[Internet]. (2017).
- Hectors SJ, Wagner M, Bane O, et al.Quantification of hepatocellular carcinoma heterogeneity with multiparametric magnetic resonance imaging. Sci. Rep.(2017).
- Marrero JA, Hussain HK, Nghiem H V., Umar R, Fonatana RJ, Lok AS. Improving the prediction of hepatocellular carcinoma in cirrhotic patients with an arterially-enhancing liver mass. Liver Transplant.11(3), 281–289 (2005).
- Chan S-C, Cheng N-M, Hsieh C-H,et al.Multiparametric imaging using 18F-FDG PET/CT heterogeneity parameters and functional MRI techniques: prognostic significance in patients with primary advanced oropharyngeal or hypopharyngeal squamous cell carcinoma treated with chemoradiotherapy. Oncotarget[Internet]. (2015).
- Rito M, Fonseca I. Salivary Gland Neoplasms: Does Morphological Diversity Reflect Tumor Heterogeneity. Pathobiology. (2018).
- Abouyared M, Fundakowski C, Casta J, et al.The Role of Indeterminate Fine-Needle Biopsy in the Diagnosis of Parotid Malignancy. (March), 678–681 (2014)
- Woo SH, Choi DS, Kim J pyeong, et al.Two-phase computed tomography study of warthin tumor of parotid gland: Differentiation from other parotid gland tumors and its pathologic explanation. J. Comput. Assist. Tomogr.37(4), 518–524 (2013)
- Teymoortash A, Schrader C, Shimoda H, Kato S, Werner JA. Evidence of lymphangiogenesis in Warthin’s tumor of the parotid gland. Oral Oncol.43(6), 614–618 (2007).
- Wang J, Tang Z, Wang S, et al.Differential diagnostic value of computed tomography perfusion combined with vascular endothelial growth factor expression in head and neck lesions. Oncol. Lett.[Internet]. 11(5), 3342–3348 (2016). Available from: https://www.spandidos-publications.com/10.3892/ol.2016.4413.
Figures