2954
Histogram analysis based on apparent diffusion coefficient maps in differential diagnosis of nasopharyngeal non-Hodgkin lymphoma and nasopharyngeal carcinoma.1The First Affiliated Hospital of Zhengzhou University, Zhengzhou, China
Synopsis
This study aimed to investigate the diagnostic value of the histogram analysis derived from apparent diffusion coefficient (ADC) maps in the differential diagnosis of nasopharyngeal carcinoma (NPC) and nasopharyngeal lymphoma (NPL).Compared with conventional MRI, histogram analysis parameters particularly for 90%ADC and 99%ADC can be used to show the distribution of different intensity signals in the tumor, extract the heterogeneity characteristics of the tumor, understand the tissue density and metabolism inside the lesion, and calculate all the voxels of the whole tumor volume. The results of histogram analysis are more objective, and have a certain advantage compared with the traditional ADC average measurement.
Introduction
Nasopharyngeal carcinoma (NPC) and nasopharyngeal non-Hodgkin lymphoma (NPNHL) are the two most common nasopharyngeal malignancies . Due to the complex anatomy of the nasopharynx, the clinical manifestations of the two tumors are not specific.NPNHL has a tendency to be misdiagnosed as NPC and there are significant differences in biological behavior, treatment management and prognosis between the two tumors1.Therefore,accurate preoperative differential diagnosis and image localization are essential for optimizing individual treatment options. It is difficult to distinguish between the two tumor types based solely on the signal intensity observed on conventional MR images.This study attempt to explore the diagnostic value of the histogram analysis derived from apparent diffusion coefficient (ADC) maps in the differential diagnosis of NPC and NPNHL.Previous studies have confirmed that there was a statistically significant difference in the ADC mean between NPC and NPNHL based on ROI, but always with a significant overlap on account of the difference in ROI selection methods,which may lead to bias.Method
79 cases of nasopharyngeal neoplasms confirmed by pathology before operation who underwent MRI and DWI scanning were retrospectively analyzed , including 34 cases of nasopharyngeal lymphoma (mean age: 51.0±20.1 years; median age: 53.5 years) and 45 cases of nasopharyngeal carcinoma(mean age: 46.6±14.2 years; median age: 46 years). All the patients underwent MRI acquisition on a 3T scanner (MAGNETOM Prisma, Siemens Healthcare, Erlangen, Germany), including MR regular plain and enhanced scan. The DWI images were acquired using axial single-shot-spin echo-echo planar imaging (SE-EPI) sequence .Two different b-values (0 and 1000 s/mm2) were included in the acquisition. The other sequence parameters were as follows: TR/TE = 3300/54 ms, FOV = 220 × 220 mm2, slice thickness = 4 mm, voxel size = 1.4 × 1.4× 4.0 mm3, slices = 24, and scan time=1.31min.
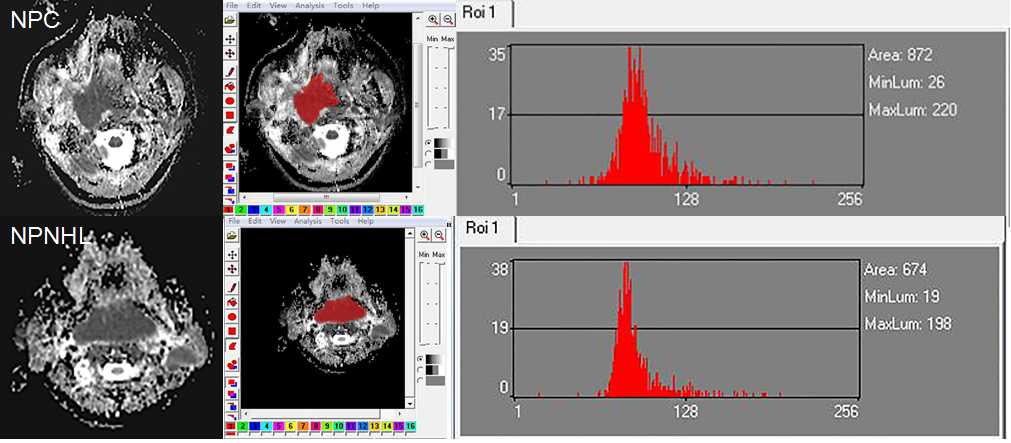
Drawing the region of interest(ROI) on the maximum level of ADC maps and going on histogram analysis, these two steps are all performed on the software named Mazda(Figure1). Statistical analysis was performed using SPSS 21.0 (Chicago, IL) and MedCalc (MedCalc, Mariakerke, Belgium) statistical software. For the parameters with statistically significant differences, the optimal threshold value was determined by plotting the receiver's operating characteristic (ROC) curve, use the Yoden index to determine the optimal diagnostic threshold, and calculate the diagnostic and predictive value of sensitivity and specificity. P < 0.05 was considered to be significant.
Results
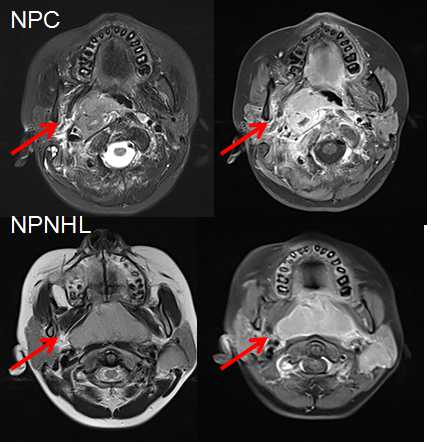
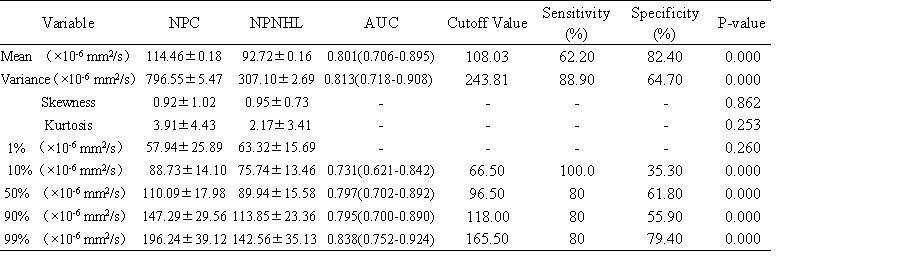
Figure 2 shows the normal MR findings of NPC and NPNHL.Table1 shows that in the 9 parameters which were extracted from histogram, ADCmean, ADCvariance, 10%ADC, 50%ADC, 90%ADC and 99%ADC had the statistical significance(P < 0.05). ROC analysis indicated that 99%ADC had the highest diagnostic accuracy for differentiating the two groups, with the area under the curve(AUC) being0.838(95% CI: 0.752~0.924), a cutoff value of 165.5×10⁻⁶mm2/s, and a sensitivity of 80.0% and a specificity of 79.4%.Discussion
The standard deviation, kurtosis and skewness in the histogram can reflect the the difference between the pixels in the parenchymal part of the tumor, the degree of data variation and the symmetry of the data. Pathologically, ADC values are mainly determined by cell density and composition of extracellular matrix. ADC values are inversely correlated with tissue cell density and positively correlated with extra-vascular or extra-cellular space2. The standard deviation of NPC ADC was higher than that of NPNHL. Considering that more abundant microcirculation blood supply than NPNHL, higher plasma volume and higher vascular permeability lead that NPC is more prone to necrosis, cystic change, hemorrhage, resulting in unevenness in the parenchyma. Lymphoma interstitial necrosis is rare and the texture is relatively uniform. The 90th and 99th percentiles of NPC were larger than lymphoma, and the 99th percentile had the highest diagnostic efficacy, sensitivity is 80%, specificity is 79.4%, because the higher ADC value distributed at the right end of the curve suggests ischemia or hypoxia caused by cystic changes or edema tissue, it can be speculated that the heterogeneity of the two tumors is mainly determined by the amount of necrotic cystic components. In the study no specific comparisons between the pathological subtypes were performed, and more samples of each pathological type need to be collected.Acknowledgements
No acknowledgement found.References
1. Liu X W, Xie C M, Mo Y X, et al. Magnetic resonance imaging features of nasopharyngeal carcinoma and nasopharyngeal non-Hodgkin's lymphoma: are there differences? Eur J Radiol.2012;81(6):1146-1154.
2. Xu X Q, Ma G, Wang Y J, et al. Histogram analysis of diffusion kurtosis imaging of nasopharyngeal carcinoma: Correlation between quantitative parameters and clinical stage. Oncotarget. 2017;8(29):47230-47238.
Figures