2948
Investigation of arterial blood T1 measurements using cardiac-triggered acquisitions in a pulsatile flow phantom1Radiology and Nuclear Medicine, Amsterdam UMC, Amsterdam, Netherlands, 2Biomedical Engineering & Physics, Amsterdam UMC, Amsterdam, Netherlands
Synopsis
We used a pulsatile flow phantom setup to investigate the method by Li et al. (2017)3 to measure arterial blood T1. We found that under different flow conditions the addition of cardiac triggering led to changes in the estimated T1 values. T1 values found in the flowing fluid matched the reference value measured in a no flow condition using a low flip-angle inversion recovery sequence, validating the correctness of our setup.
Introduction
Arterial blood T1 is a critical parameter in the quantification of cerebral blood flow (CBF) in arterial spin labelling (ASL) MRI. Although arterial blood T1 is known to depend on numerous factors such as hematocrit, oxygenation fraction and age1, the use of a constant value is widely adopted2. Li et al. (2017), proposed a fast sequence to measure arterial blood T13. This is especially useful in patients in whom the blood T1 is known to deviate from the recommended value, such as sickle cell patients4,5. Although Li et al. showed accurate and reliable measurements of arterial blood T1, the effect of blood velocity and cardiac triggering was not assessed. Here, we study the effect of different flow conditions on T1 measurements in a flow-phantom and verify our results in an in-vivo scan.Methods
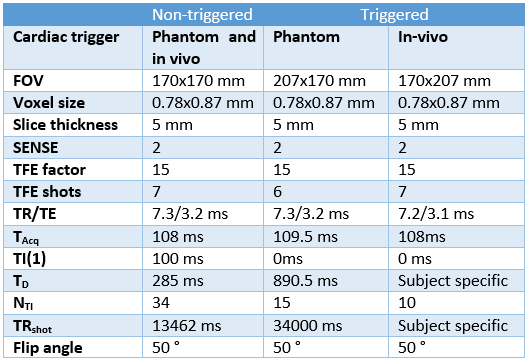
Acquisition: All measurements were acquired on a Philips 3T Ingenia system. A 2D flow measurement was performed to obtain the flow-profile. T1 measurements as described by Li et al., shown in Figure 1a, were used to measure the T1 of arterial blood and fluid in the phantom without and with cardiac triggering3. Imaging parameters of the T1 measurements are shown in Table 1.
Phantom set up: A mixture of tap water and contrast agent (9600:1) was circulated through the flow-phantom, shown in Figure 1b, using a connected air pump from outside the MRI room. Next, an untriggered and triggered acquisition was performed using two normal and one abnormal flow-profile created by the pump, shown in Figure 2. During triggered acquisitions, all readouts are performed at the same point in the cardiac cycle. Lastly, the pump was turned off to measure the T1 of the fluid under static conditions using a low flip-angle inversion recovery sequence. To ensure correct T1 phantom measurements, the adiabatic pulse was optimized and the phantom was carefully positioned to ensure inversion of all phantom fluid.
In-vivo study: One volunteer (female, age 30) was scanned using an eight-channel neck coil. The volunteer was centered at the clavicle for an optimal inversion volume. After the untriggered acquisition, triggered measurements were performed, at peak systole and late diastole.
Post-processing: Data processing was performed using MATLAB. Using the image with the longest TI, an ROI was drawn on the center of the tube in the phantom /carotid artery, which was thereafter applied to the other images. The average intensity as a function of TI was fitted using a three-parameter model, shown in the equation below. Using a nonlinear least-squares algorithm3.
$$$ S(TI) = S_0|1-2α*exp(-TI/T_1) + exp(-TR_shot/T_1)| $$$
in which S0 is the initial magnitude, α the inversion degree and T1 the relaxation time of the fluid. The inversion degree was restricted to be less than one.
Results
Images with the longest TI of an in-vivo (left) and flow-phantom (right) acquisition are shown in Figure 1c. The red arrows indicate the carotid artery and the tube used for the T1 measurements.
The recovery curves obtained from the different flow profiles in the flow-phantom and in-vivo, are shown in Figure 3. The T1 values that these curves resulted in are shown in Table 2. For all flow conditions and in-vivo a variation of ~100 ms was found for triggered and untriggered acquisitions. The reference T1 value for the phantom study was determined at 1320 ms, which is in agreement with the T1 values measured in the flowing fluid.
Discussion
A pulsatile flow phantom was used to investigate the T1 measurement technique for arterial blood. We noticed differences in the measured T1 values for triggered and non-triggered scans under several flow conditions. More measurements should reveal if these differences are significant. Untriggered acquisitions may be sensitive to incomplete fresh inflow if the readout is performed in diastole where the flow can be low, especially in elderly and diseased subjects.
One concern of cardiac triggering of these measurements is the changing heartrate during the acquisition which may lead to incorrect timing of the readouts. Moreover, cardiac triggering allows less measuring points on the recovery curve, which results in a less accurate fitting. A method to acquire points more frequently along the recovery curve would solve the latter concern.
Conclusion
To conclude, we set up and verified an experiment that enables measuring T1 values of a flowing fluid while manipulating the flow profile.Acknowledgements
No acknowledgement found.References
1. Grgac, K., Van Zijl, P. C., & Qin, Q. (2013). Hematocrit and oxygenation dependence of blood 1H2O T1 at 7 tesla. Magnetic resonance in medicine, 70(4), 1153-1159.
2. Alsop, D. C., Detre, J. A., Golay, X., Günther, M., Hendrikse, J., Hernandez‐Garcia, L., ... & Van Osch, M. J. (2015). Recommended implementation of arterial spin‐labeled perfusion MRI for clinical applications: A consensus of the ISMRM perfusion study group and the European consortium for ASL in dementia. Magnetic resonance in medicine, 73(1), 102-116.
3. Li, W., Liu, P., Lu, H., Strouse, J. J., van Zijl, P. C., & Qin, Q. (2017). Fast measurement of blood T1 in the human carotid artery at 3T: Accuracy, precision, and reproducibility. Magnetic resonance in medicine, 77(6), 2296-2302.
4. Steen, R. G., Langston, J. W., Ogg, R. J., Xiong, X., Ye, Z., & Wang, W. C. (1999). Diffuse T1 reduction in gray matter of sickle cell disease patients: evidence of selective vulnerability to damage?. Magnetic resonance imaging, 17(4), 503-515.
5. Václavů, L., van der Land, V., Heijtel, D. F. R., van Osch, M. J. P., Cnossen, M. H., Majoie, C. B. L. M., ... & Nederveen, A. J. (2016). In vivo T1 of blood measurements in children with sickle cell disease improve cerebral blood flow quantification from arterial spin-labeling MRI. American Journal of Neuroradiology, 37(9), 1727-1732.
Figures