2944
Quantitative characterization of the carotid atherosclerotic plaque composition using synthetic MRI: a preliminary study with histological confirmation1Radiology Department of China Medical University First Hospital, Shen Yang, China, 2GE Healthcare, MR Application China, Shenyang, China, 3Radiology Department of China Medical University First Hospital, Shenyang, China, 4GE Healthcare, MR Application China, Beijing, China
Synopsis
The current study aims to quantify the extent of different composition in carotid artery plaques like intraplaque hemorrhage (IPH) and calcification by Quantitative MR imaging measurements derived from Synthetic MRI technique. We found different components have different distribution range at the value of T1 mapping, T2 mapping and PD mapping. It was concluded that quantitative mapping of synthetic MRI could quantify the extent of different plaque compositions.
Introduction
Vulnerable plaques may lead to cerebral ischemic events 1, it is known that the composition of the plaque play an important role in its vulnerability. In convention, multi-contrast MRI including TOF, T1w, T2w, and contrast enhancement has been employed to identify the plaque composition 2. However, not only this approach requires relatively long scan time, complicated procedure, more importantly it features manual objective bias in the composition identification. Tissue relaxation, on the other hand, reflects subjective measure of the tissue magnetization properties. Recent work has reported the use of T1 or T2 mapping in identifying the plaque composition 3,4, however dedicated pulse sequences were needed. Synthetic MR offers simultaneous T1 / T2 / PD mapping in one scan and has great potential for plaque composition detection. In this work, the use of the relaxation mapping offered by synthetic MRI in detecting plaque composition is investigated with pathological confirmation.Method
Seven patients who were scheduled for (Carotid endarterectomy) CEA were enrolled in this study, ethical approval and consent forms were obtained. All the patients underwent MR scans on a 3.0T whole body scanner (GE Signa Pioneer, WI), and the scan protocol consisted of both conventional MR and synthetic MR. Matching spatial resolution of 0.7x0.7x3mm were used in conventional and synthetic MR scans. In conventional MR, PD, T1w and T2w 3D black blood FSE were scanned as well as the TOF. Two experienced radiologists independently reviewed the images and identified regions with IPH and without IPH according to the criteria in 5,6. Then the ROIs were repeated to the T1 / T2 / PD mapping obtained using synthetic MR. Histological confirmation was performed on one subject after the plaque was removed by endarterectomy, sections were collected at 3mm interval throughout the specimen, staining was performed on the sections. The histological results were then compared to the compositions identified using multi-contrast MR, then the corresponding relaxation values from synthetic MR were noted.Result
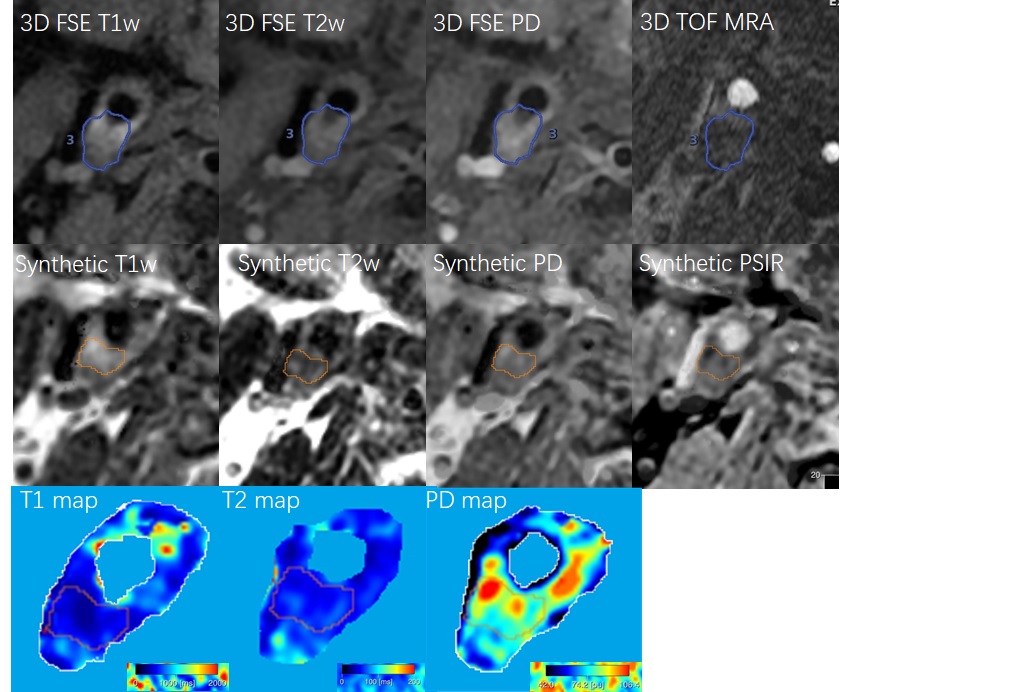
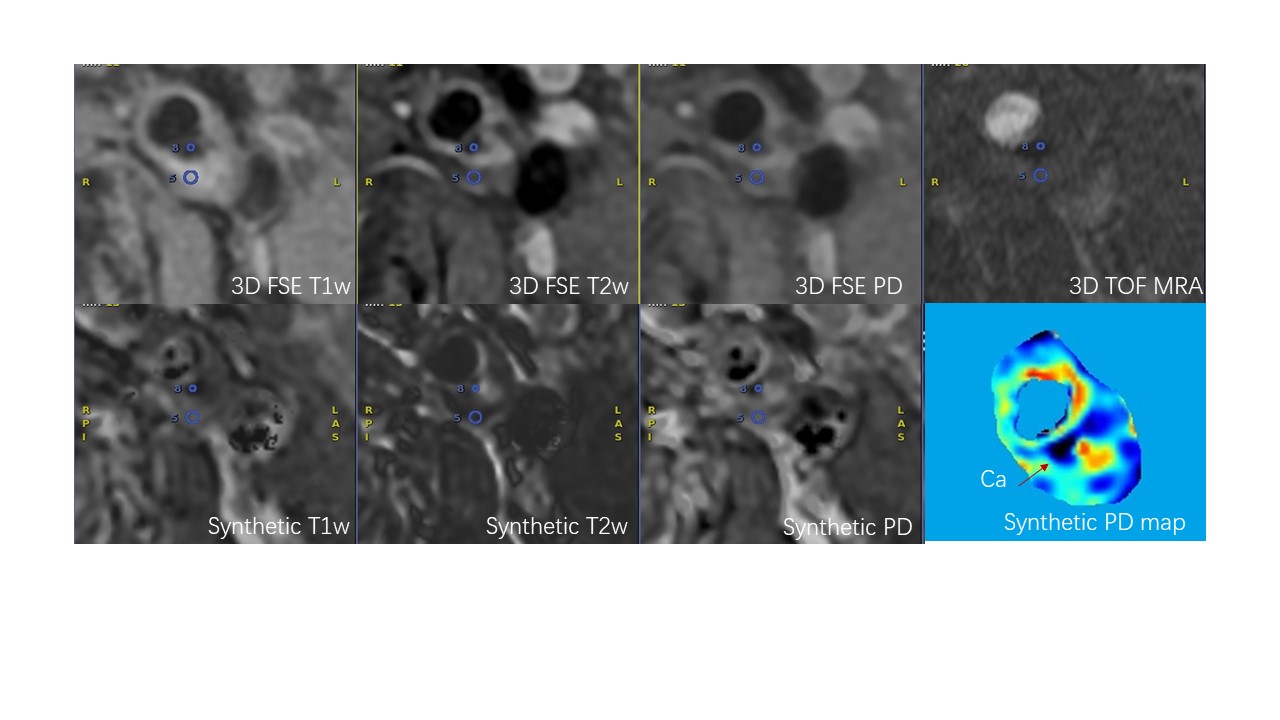
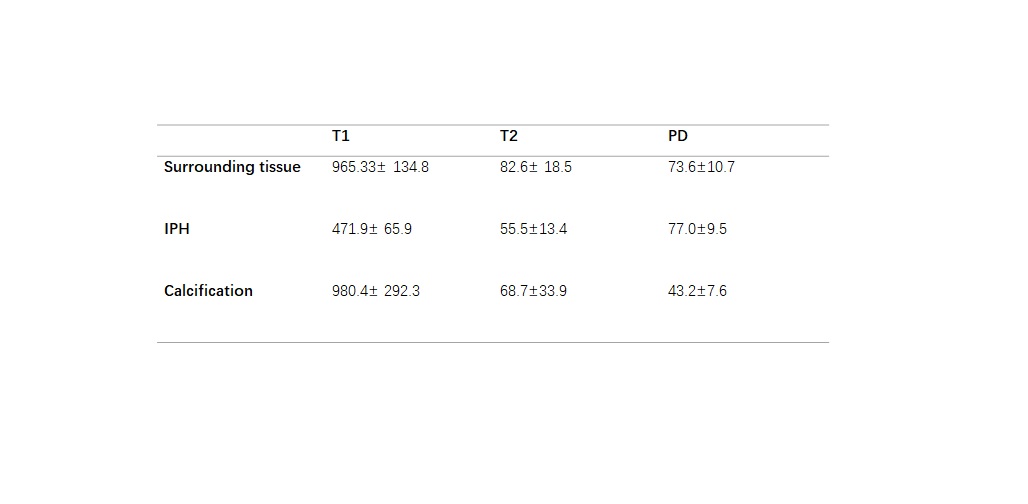
A total of 140 image locations were acquired from all 7 patient exams. Using the criteria 2, IPH was identified at 20 image locations and calcification at 7 image locations. Figure 1 and 2 illustrate a representative case with IPH and calcification respectively, shown with both conventional MR images and quantitative maps from synthetic MR. Quantitative relaxation measurements are summarized in Table 1: IPH regions detected at T1 map showed reduced T1 (472±66 ms) compared with T1 in the surrounding tissues with statistical significance (965±135 ms); calcification showed reduced PD (43.2±7.6 ms) compared with surrounding tissues with statistical significance.Discussion
Research attention has been attracted in quantitative differentiation of carotid plaque composition based on relaxation times 3,4. Synthetic MRI holds great potential for providing spatial registered multiple relaxation time maps. This preliminary work investigates the relaxation characteristics of IPH and calcification with synthetic MRI. With histological confirmation and references to conventional multi-contrast MRI, the results obtained with synthetic MR agree with the pathological properties and previous reports [3.4]: IPH region correspond to hyperintense signal on T1w images and low T1 relaxation. IPH regions correspond to hypo or iso signal intense on T2w and low or iso T2 relaxation. The relaxation data base for other compositions of interests such as fibrous cap and loose matrix requires a larger patient population in the future.Conclusion
Synthetic MR showed good potential for quantitatively characterizing the carotid plaque compositions.Acknowledgements
No acknowledgement found.References
[1] Naghavi M, Libby P, Falk E, et al. From vulnerable plaque to vulnerable patient: a call for new definitions and risk assessment strategies: part I. Circulation 2003;108:1664–1672.
[2] den Hartog AG, Bovens SM, Koning W, Hendrikse J, Luijten PR, Moll FL, Pasterkamp G, de Borst GJ. Current status of clinical magnetic resonance imaging for plaque characterisation in patients with carotid artery stenosis. Eur J Vasc Endovasc Surg 2013;45:7-21.
[3] Koppal S, Warntjes M, Swann J, Dyverfeldt P, Kihlberg J. etal. Quantitative Fat and R2* Mapping In Vivo to Measure Lipid-Rich Necrotic Core and Intraplaque Hemorrhage in Carotid Atherosclerosi. Magn Reson Med. 2017 Jul;78(1):285-296.
[4] Qi H, Sun J, Qiao H, Chen S, etal. Carotid Intraplaque Hemorrhage Imaging with Quantitative Vessel Wall T1 Mapping: Technical Development and Initial Experience. Radiology 2018 Apr;287(1):276-284.
[5] OtaH, YuW, UnderhillHR, Oikawa M,Dong L, Zhao X, etal. Hemorrhage andlarge lipid-rich necrotic cores are independently associated with thin or ruptured fibrous caps: an in vivo 3T MRI study. Arterioscler Thromb Vasc Biol 2009;29:1696–701.
[6] Yuan C, Mitsumori L, Beach K, Maravilla K. Carotid atherosclerotic plaque: noninvasive MR characterization and identification of vulnerable lesions. Radiology 2001;221:285–99.
Figures