2934
Cerebral Metabolic Rate of Oxygen (CMRO2) during transition from wakefulness to sleep measured by high temporal resolution OxFlow MRI with concurrent EEG recordingAlessandra Caporale1, Hyunyeol Lee1, Hengyi Rao2, Hui Lei2, John A Detre3, Michael C Langham1, Pei-Hsin Wu1, and Felix W Wehrli1
1Radiology, Laboratory for Structural, Physiologic and Functional Imaging, University of Pennsylvania, Perelman School of Medicine, Philadelphia, PA, United States, 2Center for Functional Neuroimaging & Division of Sleep and Chronobiology, University of Pennsylvania, Perelman School of Medicine, Philadelphia, PA, United States, 3Neurology, Perelman School of Medicine, University of Pennsylvania Health System, Philadelphia, PA, United States
Synopsis
Reduced synaptic transmissions during states of reduced consciousness cause a slowdown in the cerebral metabolic rate of oxygen (CMRO2) and glucose utilization. Prior methods based on PET and tracer kinetics involving repeated blood sampling are not practical in a clinical setting. Here we used whole-brain MR oximetry at 3-second temporal resolution with simultaneous EEG recording to evaluate the feasibility of in-scanner monitoring of brain oxygen metabolism during wakefulness and sleep. The results in three subjects show reduction in CMRO2 up to 15% following onset of sleep paralleling increased delta wave EEG activity and reduction in heart rate.
Background and purpose
The restorative function of sleep is well known1 as are the adverse effects of persistent insufficient and disrupted sleep on cognitive function and cardiovascular health2-4. During sleep, reduced synaptic transmissions lead to a slowdown in the cerebral metabolic rate of oxygen (CMRO2) and glucose utilization5. Early work from Madsen et al. using invasive technology based on the Kety-Schmidt technique using xenon tracer kinetics, showed CMRO2 to decrease from 5% to 25%, during light and deep non-REM sleep, respectively6,7. However, in order to be clinically practical, the method must be noninvasive, robust and be able to yield data at a rate on the order of a few seconds. Susceptometry-based MRI oximetry satisfies these requirements8,9. The technique, referred to as OxFlow, relies on a joint measurement of total cerebral blood flow (tCBF) and venous oxygen saturation (SvO2) of a major cerebral vein, typically the superior sagittal sinus (SSS) draining the cortex. Here we used a golden-angle radial OxFlow (rOxFlow) to follow CMRO2 dynamically with high temporal resolution10. We had previously measured the sleep-driven CMRO2 reduction in healthy volunteers, assessing their sleep state empirically11. However, to definitively assess whether the subject is asleep and possibly correlate the level of CMRO2 reduction with sleep stage, electroencephalography (EEG) is required. Here, we adapted rOxFlow for concurrent EEG monitoring and were able to evaluate the evolution of CMRO2 during the transition from wakefulness to sleep at 3.0 T.Methods
Three healthy male volunteers (ages 22, 35 and 40 years), were scanned in late evening following dinner. None were sleep deprived, but they all had indicated previously that they were able to sleep during MRI data collection in the scanner. EEG data were recorded in the MR scanner (Siemens Prisma, 3.0 T) using a 15-channel customized MR-compatible sleep cap and a 32-channel amplifier (BrainAmp MR Plus). Scalp electrodes were placed according to the international 10-20 system. The EEG+rOxFlow protocol lasted 45 minutes: during the first 5 and the last 10 minutes the subjects were in eyes open condition, whereas in the central 30 minutes whey were at liberty to sleep (Fig. 1). CMRO2 was computed off-line via the Fick’s principle: $$$CMRO_2=C_a\cdot tCBF\cdot(SaO_2-SvO_2)$$$, with $$$C_a$$$ being the O2 carrying capacity of hemoglobin (1.39 ml O2/g[Hb]), in which [Hb] is the hemoglobin concentration measured from a finger stick blood sample (Hemocue Hb 201+). rOxFlow technique yields the total cerebral blood flow through PC-MRI, and the venous oxygen saturation through susceptometry-based oxymetry. tCBF was obtained by upscaling the flow measured in the superior sagittal sinus (SSSBF) by a calibration factor corresponding to the ratio between the inflow from the internal carotid and vertebral arteries and the outflow from SSS9. was measured by pulse oximetry (Veris Medrad 8400). CMRO2 and tCBF were normalized to brain mass. The rOxFlow protocol was slightly adapted with respect to the one used previously11, based on preliminary tests for simultaneous EEG + rOxFlow acquisition in eyes open closed conditions. TR=50ms (frequency=20Hz) avoids signal contamination of α-waves, characteristic of eyes-closed condition. rOxFlow resolution (and thus of CMRO2) was 3.4s. EEG data were digitally filtered to attenuate gradient induced and cardioballistic artifacts, and Fourier transformed to yield power spectral densities of characteristic wavebands. The onset of non-REM sleep was inferred from delta power density increase12.Results and Discussion
The stability of the protocol when performed during wakefulness is illustrated in Fig. 2. Time-courses of the measured parameters during transition from wakefulness to sleep are plotted in Fig. 3, together with heart rate (HR). The subjects were inferred to be asleep based on the characteristic increase and subsequent decrease in delta-wave power density (Fig. 4). CMRO2 was found to decrease following onset of sleep with respect to pre-sleep wakefulness in all three subjects (P<0.0001), corresponding to an average relative change of about -15% in subjects 1 and 2 and -12% in subject 3 (see Table 1). The observed CMRO2 depression was paralleled by a HR decrease of 6-7 bpm, consistent with previous studies13. An increase in HR could be observed following forced awakening (Fig. 3). Of note, however, is that post-sleep CMRO2 did not recover to pre-sleep values during the 15-minute post-sleep period. Future studies will require inclusion of prolonged post-sleep periods, to allow monitoring of the return to baseline values.Conclusions
These preliminary data illustrate the feasibility of in-scanner monitoring of the effect of sleep on CMRO2 via temporally resolved whole-brain oximetry and concurrent EEG. The method should be suited for longer-term studies in sleep-deprived subjects to quantify the sleep-stage specific effects on brain oxygen metabolism.Acknowledgements
NIH Grants R01 HL122754 and R21 EB022687References
1. Benington JH, Heller HC. Restoration of brain energy metabolism as the function of sleep. Progress in neurobiology 1995;45(4):347-360. 2. Goel N, Rao H, Durmer JS, Dinges DF. Neurocognitive consequences of sleep deprivation. Semin Neurol 2009;29(4):320-339. 3. Mullington JM, Haack M, Toth M, Serrador JM, Meier-Ewert HK. Cardiovascular, inflammatory, and metabolic consequences of sleep deprivation. Prog Cardiovasc Dis 2009;51(4):294-302. 4. Pack AI, Gislason T. Obstructive sleep apnea and cardiovascular disease: a perspective and future directions. Prog Cardiovasc Dis 2009;51(5):434-451. 5. Boyle PJ, Scott JC, Krentz AJ, Nagy RJ, Comstock E, Hoffman C. Diminished brain glucose metabolism is a significant determinant for falling rates of systemic glucose utilization during sleep in normal humans. J Clin Invest 1994;93(2):529-535. 6. Madsen PL, Schmidt JF, Holm S, Vorstrup S, Lassen NA, Wildschiodtz G. Cerebral oxygen metabolism and cerebral blood flow in man during light sleep (stage 2). Brain Research 1991;557(1-2):217-220. 7. Madsen PL, Schmidt JF, Wildschiodtz G, Friberg L, Holm S, Vorstrup S, Lassen NA. Cerebral O2 metabolism and cerebral blood flow in humans during deep and rapid-eye-movement sleep. Journal of Applied Physiology 1991;70(6):2597-2601. 8. Jain V, Langham MC, Wehrli FW. MRI estimation of global brain oxygen consumption rate. J Cereb Blood Flow Metab 2010;30(9):1598-1607. 9. Rodgers ZB, Jain V, Englund EK, Langham MC, Wehrli FW. High temporal resolution MRI quantification of global cerebral metabolic rate of oxygen consumption in response to apneic challenge. J Cereb Blood Flow Metab 2013;33(10):1514-1522. 10. Cao W, Chang YV, Englund EK, Song HK, Barhoum S, Rodgers ZB, Langham MC, Wehrli FW. High-speed whole-brain oximetry by golden-angle radial MRI. Magn Reson Med 2018;79(1):217-223. 11. Lee H, Langham MC, Rodriguez-Soto AE, Detre JA, Schwab R, Wehrli FW. CMRO2 Changes During Sleep in Humans. 2018 June 16-21; Paris, France. 12. Campbell IG. EEG recording and analysis for sleep research. Curr Protoc Neurosci 2009;Chapter 10:Unit10.2. 13. Khatri, I. M., & Freis, E. D. Hemodynamic changes during sleep. Journal of Applied Physiology 1967;22(5),:867-873.Figures
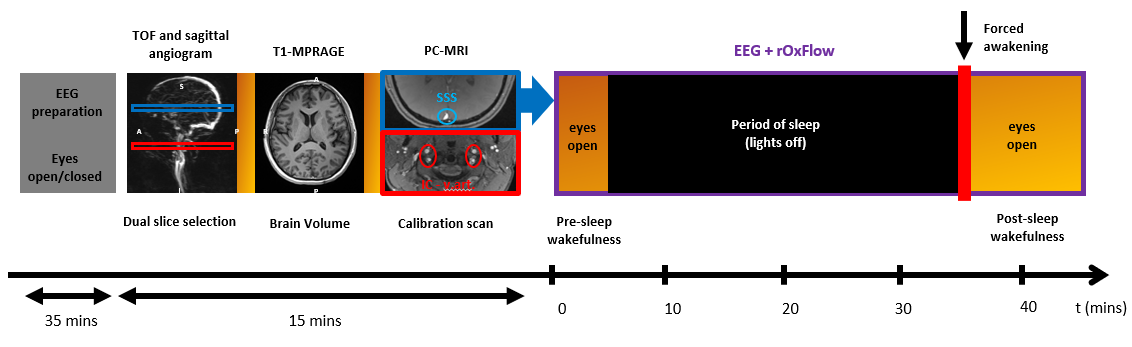
Figure 1-Concurrent EEG and radial-OxFlow
acquisition pipeline. The
EEG preparation includes the EEG-cap placement and the initial recording
outside the scanner in eyes open/closed conditions. MRI acquisition starts with
the selection of two slice locations (SSS, superior sagittal sinus-blue,
internal carotids and vertebral arteries-red) prescribed from a sagittal scout
angiogram. Brain volume is extracted from T1-MPRAGE images. The flow upscaling
factor SSS-BF/tCBF is computed dividing the flow at the two prescribed
locations obtained from a baseline scan prior to the time-series. The latter is
followed by continuous rOxFlow data collection at SSS and concurrent EEG
monitoring for 45 minutes.
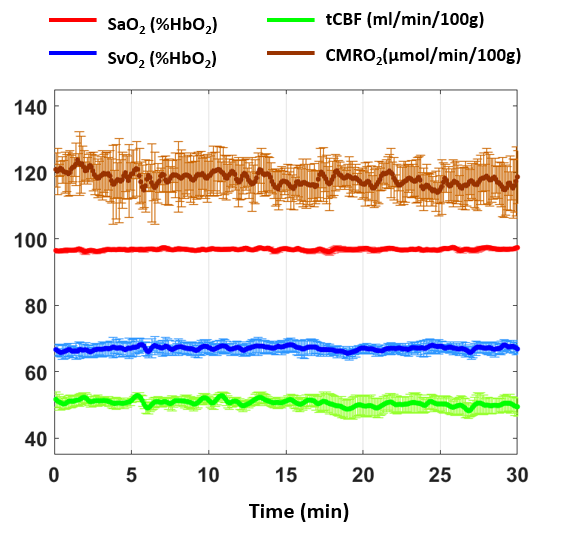
Figure 2-Stability of CMRO2 obtained
with rOxFlow. Group
means from five subjects plotted for CMRO2, SaO2, SvO2,
tCBF) during a wakefulness period of 30 minutes (error bars correspond to
standard errors). The dynamics of the measured parameters was stable over the scanning
period (CV ≈
7% for
CMRO2, data from Lee et al.11).
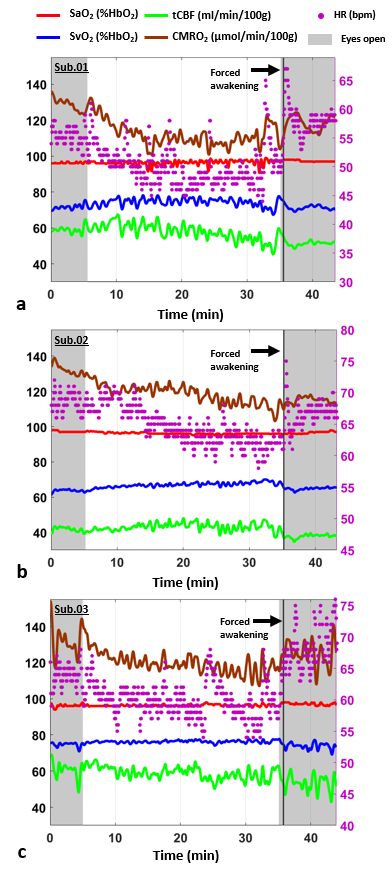
Figure 3-Neurovascular-metabolic
parameters during various stages of consciousness. Time-courses for CMRO2,
heart rate (HR), SaO2, SvO2 and tCBF measured in the
three subjects. The right y axis represents HR scale, shaded regions represent
the periods during which the subject was in ‘eyes open’ awake state. The
subject was awakened by means of acoustic signals and was asked to provide feed-back through the squeeze-ball (black vertical line) to confirm awakening.
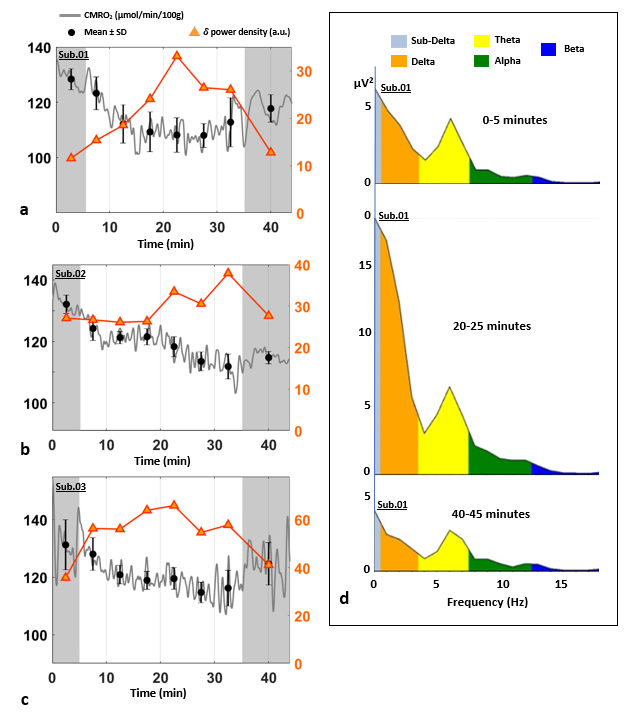
Figure 4-CMRO2 and delta-wave
EEG power spectra. (a-c) Power density of delta frequency
component superimposed on CMRO2 time-course for the three study subjects. Shaded regions represent the periods during which the subject was in
‘eyes open’ condition. Increased delta power density indicates onset of sleep.
Notice the parallel decrease in CMRO2 in each subject d) EEG power bands recorded
by the cortex electrode C3 during the experiment for subject 1,
showing increased low frequency components (delta, sub-delta, theta) between
20-25 minutes, and decreased alpha activity during the periods of ‘eyes open’
condition (0-5 and 40-45 minutes).
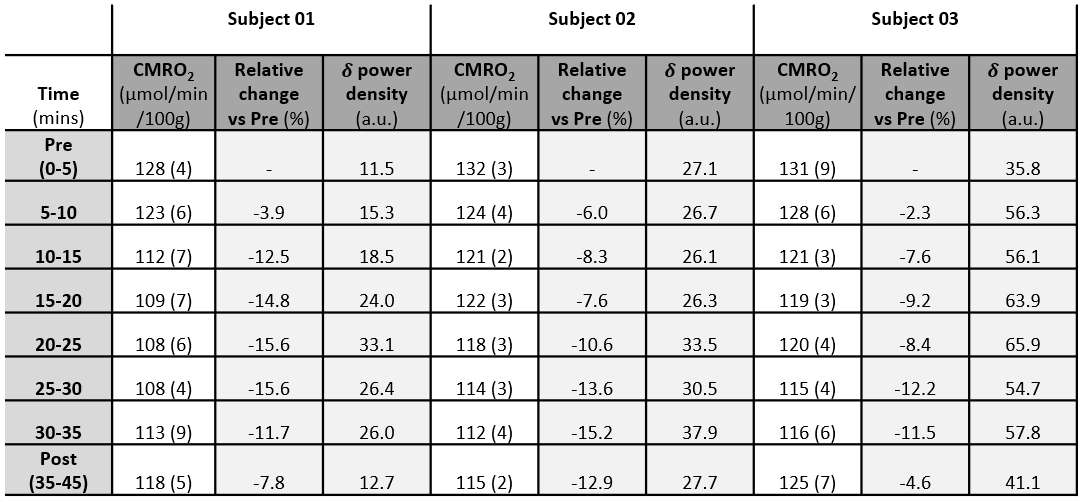
Table 1-Delta power density, CMRO2
and relative changes during the protocol. Values
of CMRO2 and delta (δ) power density averaged over time epochs
of 5 minutes (standard deviations in parenthesis).