2933
Inaccurate Visualisation of Haemorrhagic Markers in Cerebral Amyloid Angiopathy in Susceptibility Weighted Imaging can be Overcome Using Susceptibility Mapping1Department of Medical Physics and Biomedical Engineering, University College London, London, United Kingdom, 2Department of Brain Repair and Rehabilitation, UCL Queen Square Institute of Neurology, University College London, London, United Kingdom, 3Institute of Nuclear Medicine, University College London, London, United Kingdom, 4Dementia Research Centre, UCL Queen Square Institute of Neurology, University College London, London, United Kingdom, 5Lysholm Department of Neuroradiology and the Neuroradiological Academic Unit, UCL Queen Square Institute of Neurology, University College London, London, United Kingdom, 6Leonard Wolfson Experimental Neurology Centre, UCL Queen Square Institute of Neurology, University College London, London, United Kingdom
Synopsis
Cerebral amyloid angiopathy is a small vessel disease characterised by imaging signatures including cerebral microbleeds and cortical superficial siderosis. We show here that non-local phase effects affecting Susceptibility Weighted Imaging (SWI) cause broadening and/or duplication of microbleeds, as well as deformation of superficial siderosis. Furthermore, susceptibility maps and “true SWI”, where local susceptibility values are used, facilitate more accurate microbleed size estimation, reduce the risk of microbleed miscount and provide better delineation of superficial siderosis. Therefore, susceptibility maps and true SWI are likely to be more accurate than SWI in identifying and grading these haemorrhagic markers, with potential clinical relevance.
Introduction
Cerebral Amyloid Angiopathy (CAA) is a small vessel disease characterised by the agglomeration of amyloid mostly in the cortical and leptomeningeal arteries and arterioles(1). Its prevalence reaches 20-40% in non-demented and 50-60% in demented elderly populations(2,3). Whilst no definite CAA identification can be made without histopathology, CAA can be diagnosed in vivo using MRI-detectable markers including IntraCerebral Haemorrhage (ICH), Cerebral MicroBleeds (CMB), and cortical Superficial Siderosis (cSS)(4–7). A recently developed CAA score attempts to estimate disease severity using measures including the number of CMBs and sulci affected by cSS(8). Accurate quantification of these markers is thus essential for diagnosis and patient management in CAA and other cerebral small vessel diseases(9). Here, we show improved identification of CMB and cSS by replacing non-local MRI phase with underlying local susceptibility values in Susceptibility Weighted Imaging (SWI)(10).Methods
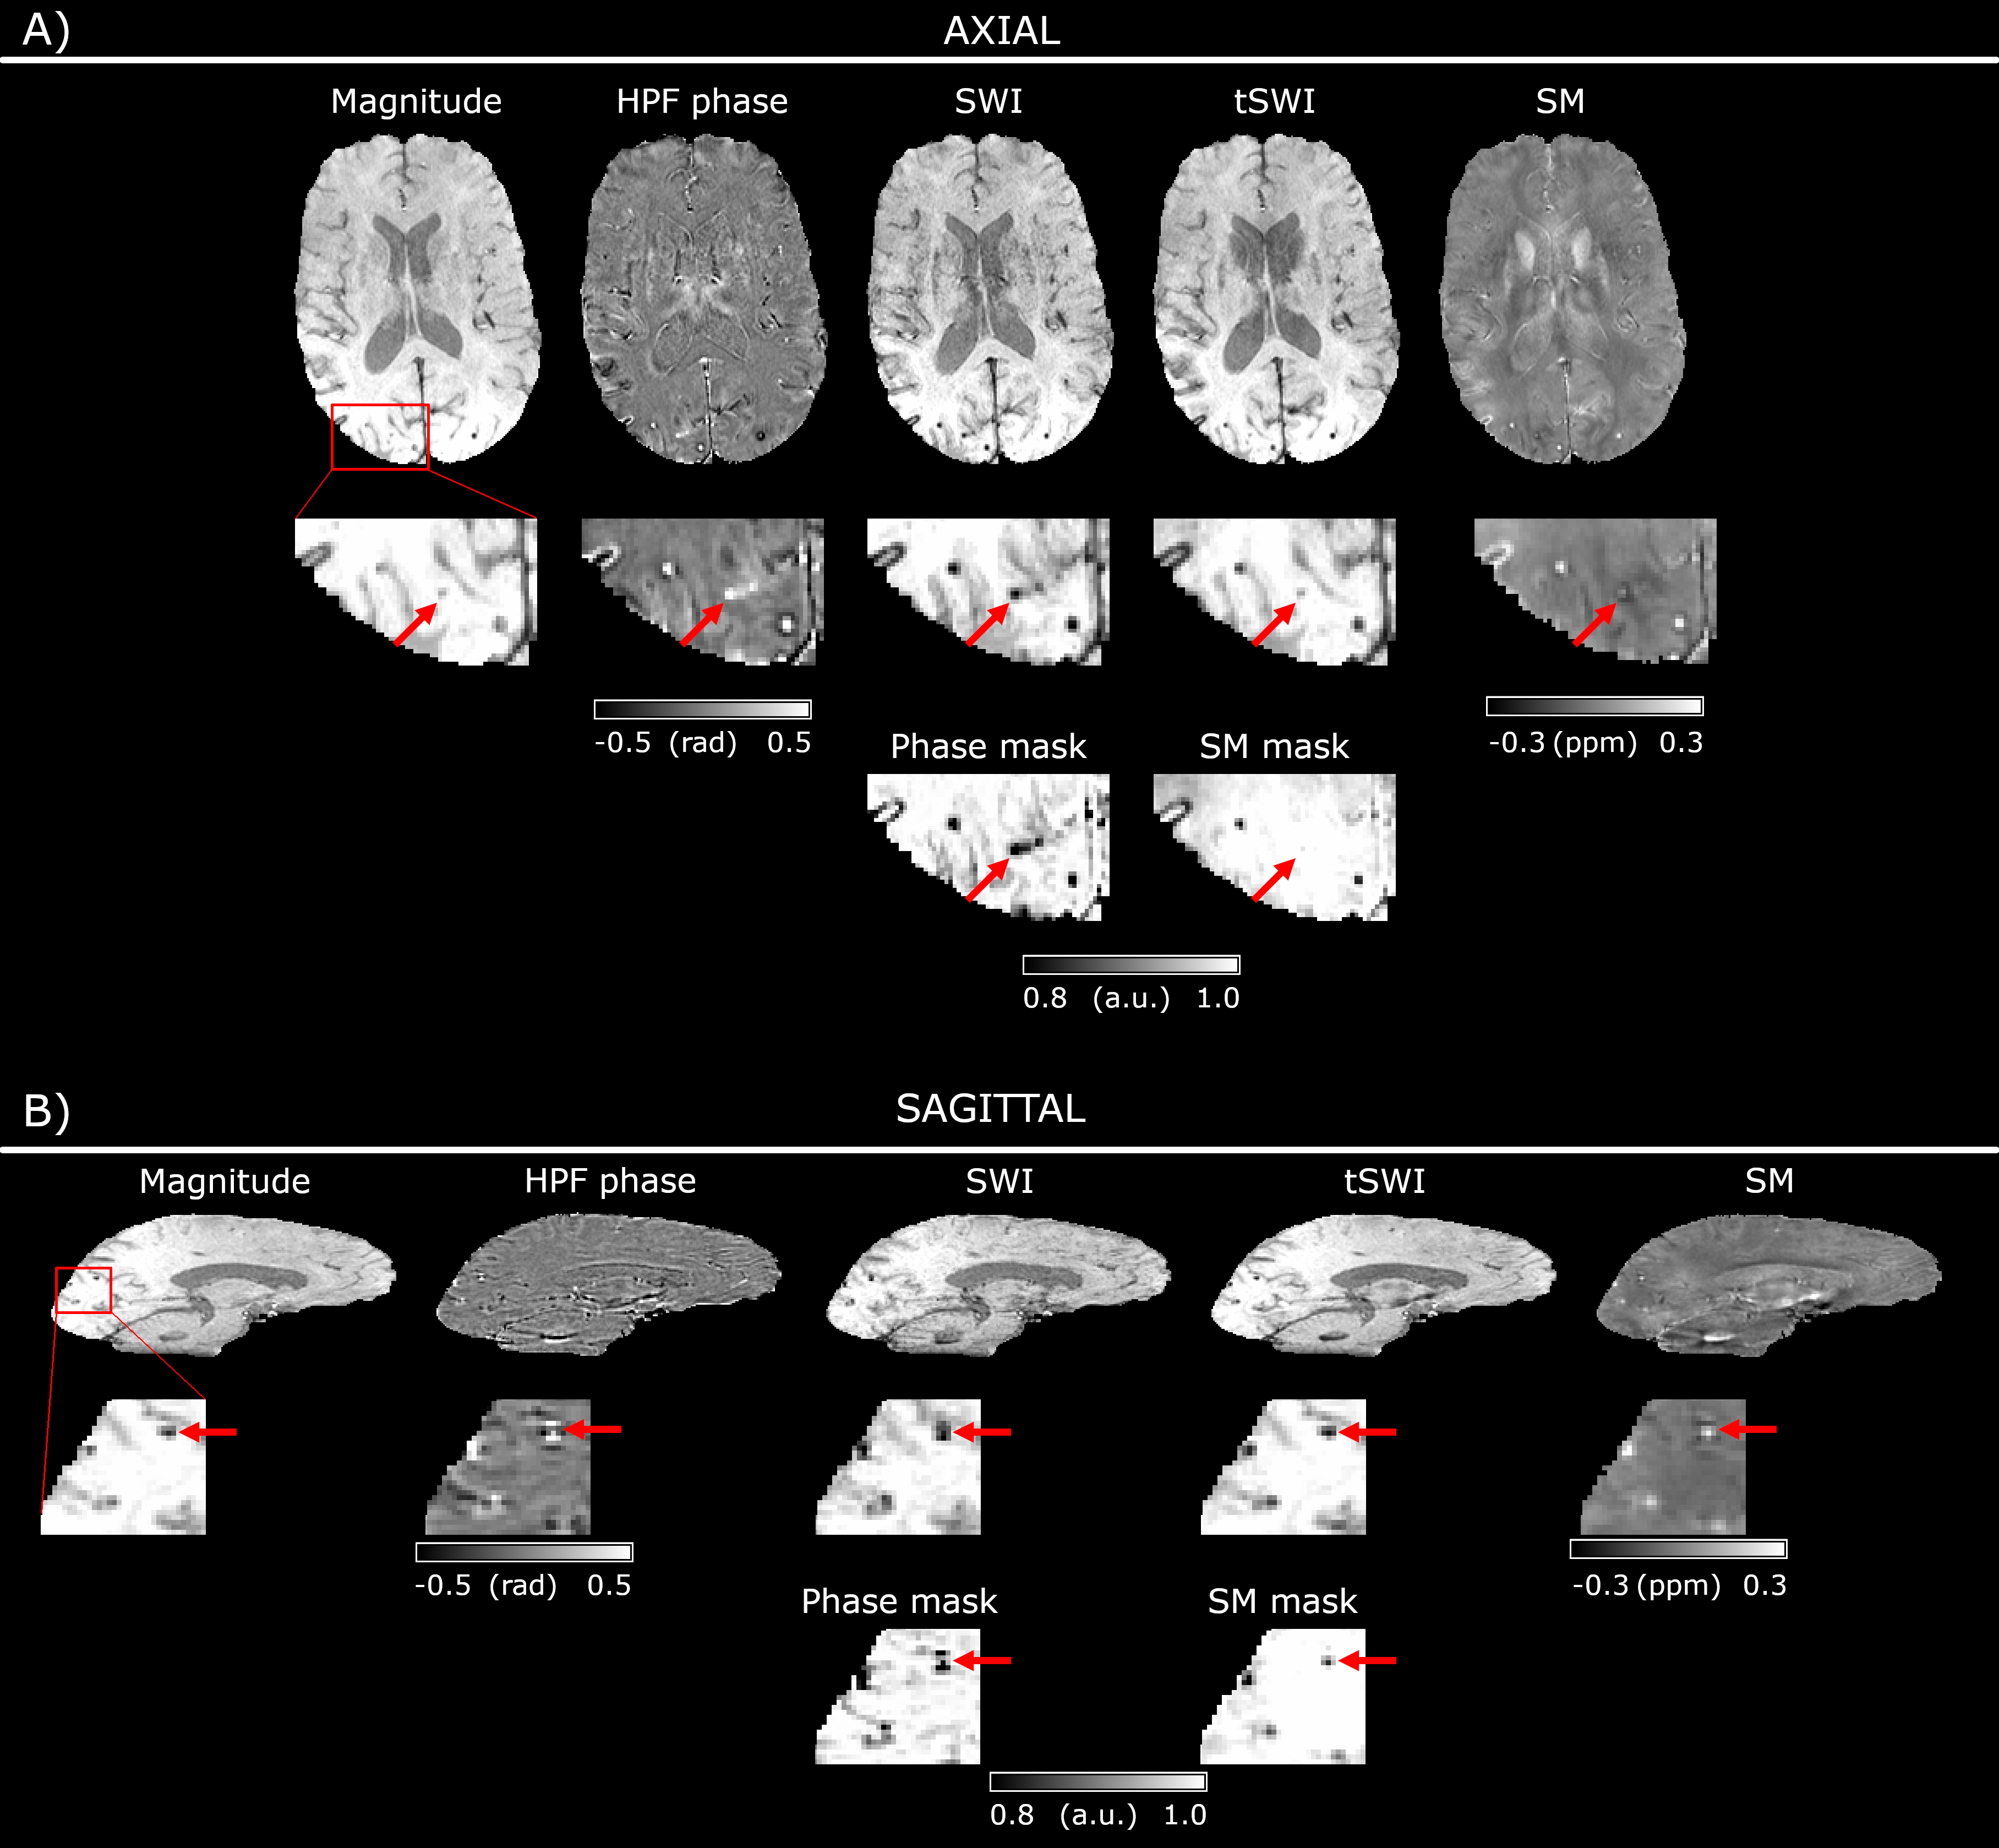
Data were collected as part of the BOCAA (Biomarkers and Outcomes in Cerebral Amyloid Angiopathy) study, approved by the local ethics committee. Ten patients with “probable CAA”, according to the Boston criteria(4) (age: 68.6±3.0 years, 2 women) and five healthy volunteers (age: 64.4±6.5 years, 3 women) were scanned on a 3 T Siemens Magnetom Biograph mMR using a 12-channel head coil and a 3D GRE sequence(11): TEs = [4.9, 9.8, 19.7] ms, TR = 27 ms, Receiver Bandwidth = [400, 400, 140] Hz/Pixel, Flip Angle = 15°, Matrix Size = 192x256x96 voxel3, Resolution = 0.9x0.9x1.5 mm3. The phase and magnitude images were combined using ASPIRE(12). Laplacian unwrapping was applied to the combined phase at TE = 19.7 ms. The unwrapped phase was High-Pass Filtered (HPF) using a 5x5x3 voxel Gaussian kernel with standard deviation of 2 voxels. Additionally, instead of HPF, background fields were removed with PDF(13) and susceptibility maps (SM) were calculated using Tikhonov regularisation with regularisation parameter = 0.05(14). Phase and SM masks were created, where values were set to “1” for negative phase or susceptibility, and decreased linearly to “0” for values between zero and the maximum. Masks were raised to the power of 4 and multiplied by the corresponding magnitude image yielding classical SWI(15), with the phase mask, and “true SWI” (tSWI)(10), using SM mask.Results
All CAA patient images showed CMBs and/or cSS whereas healthy control images showed no such pathology.
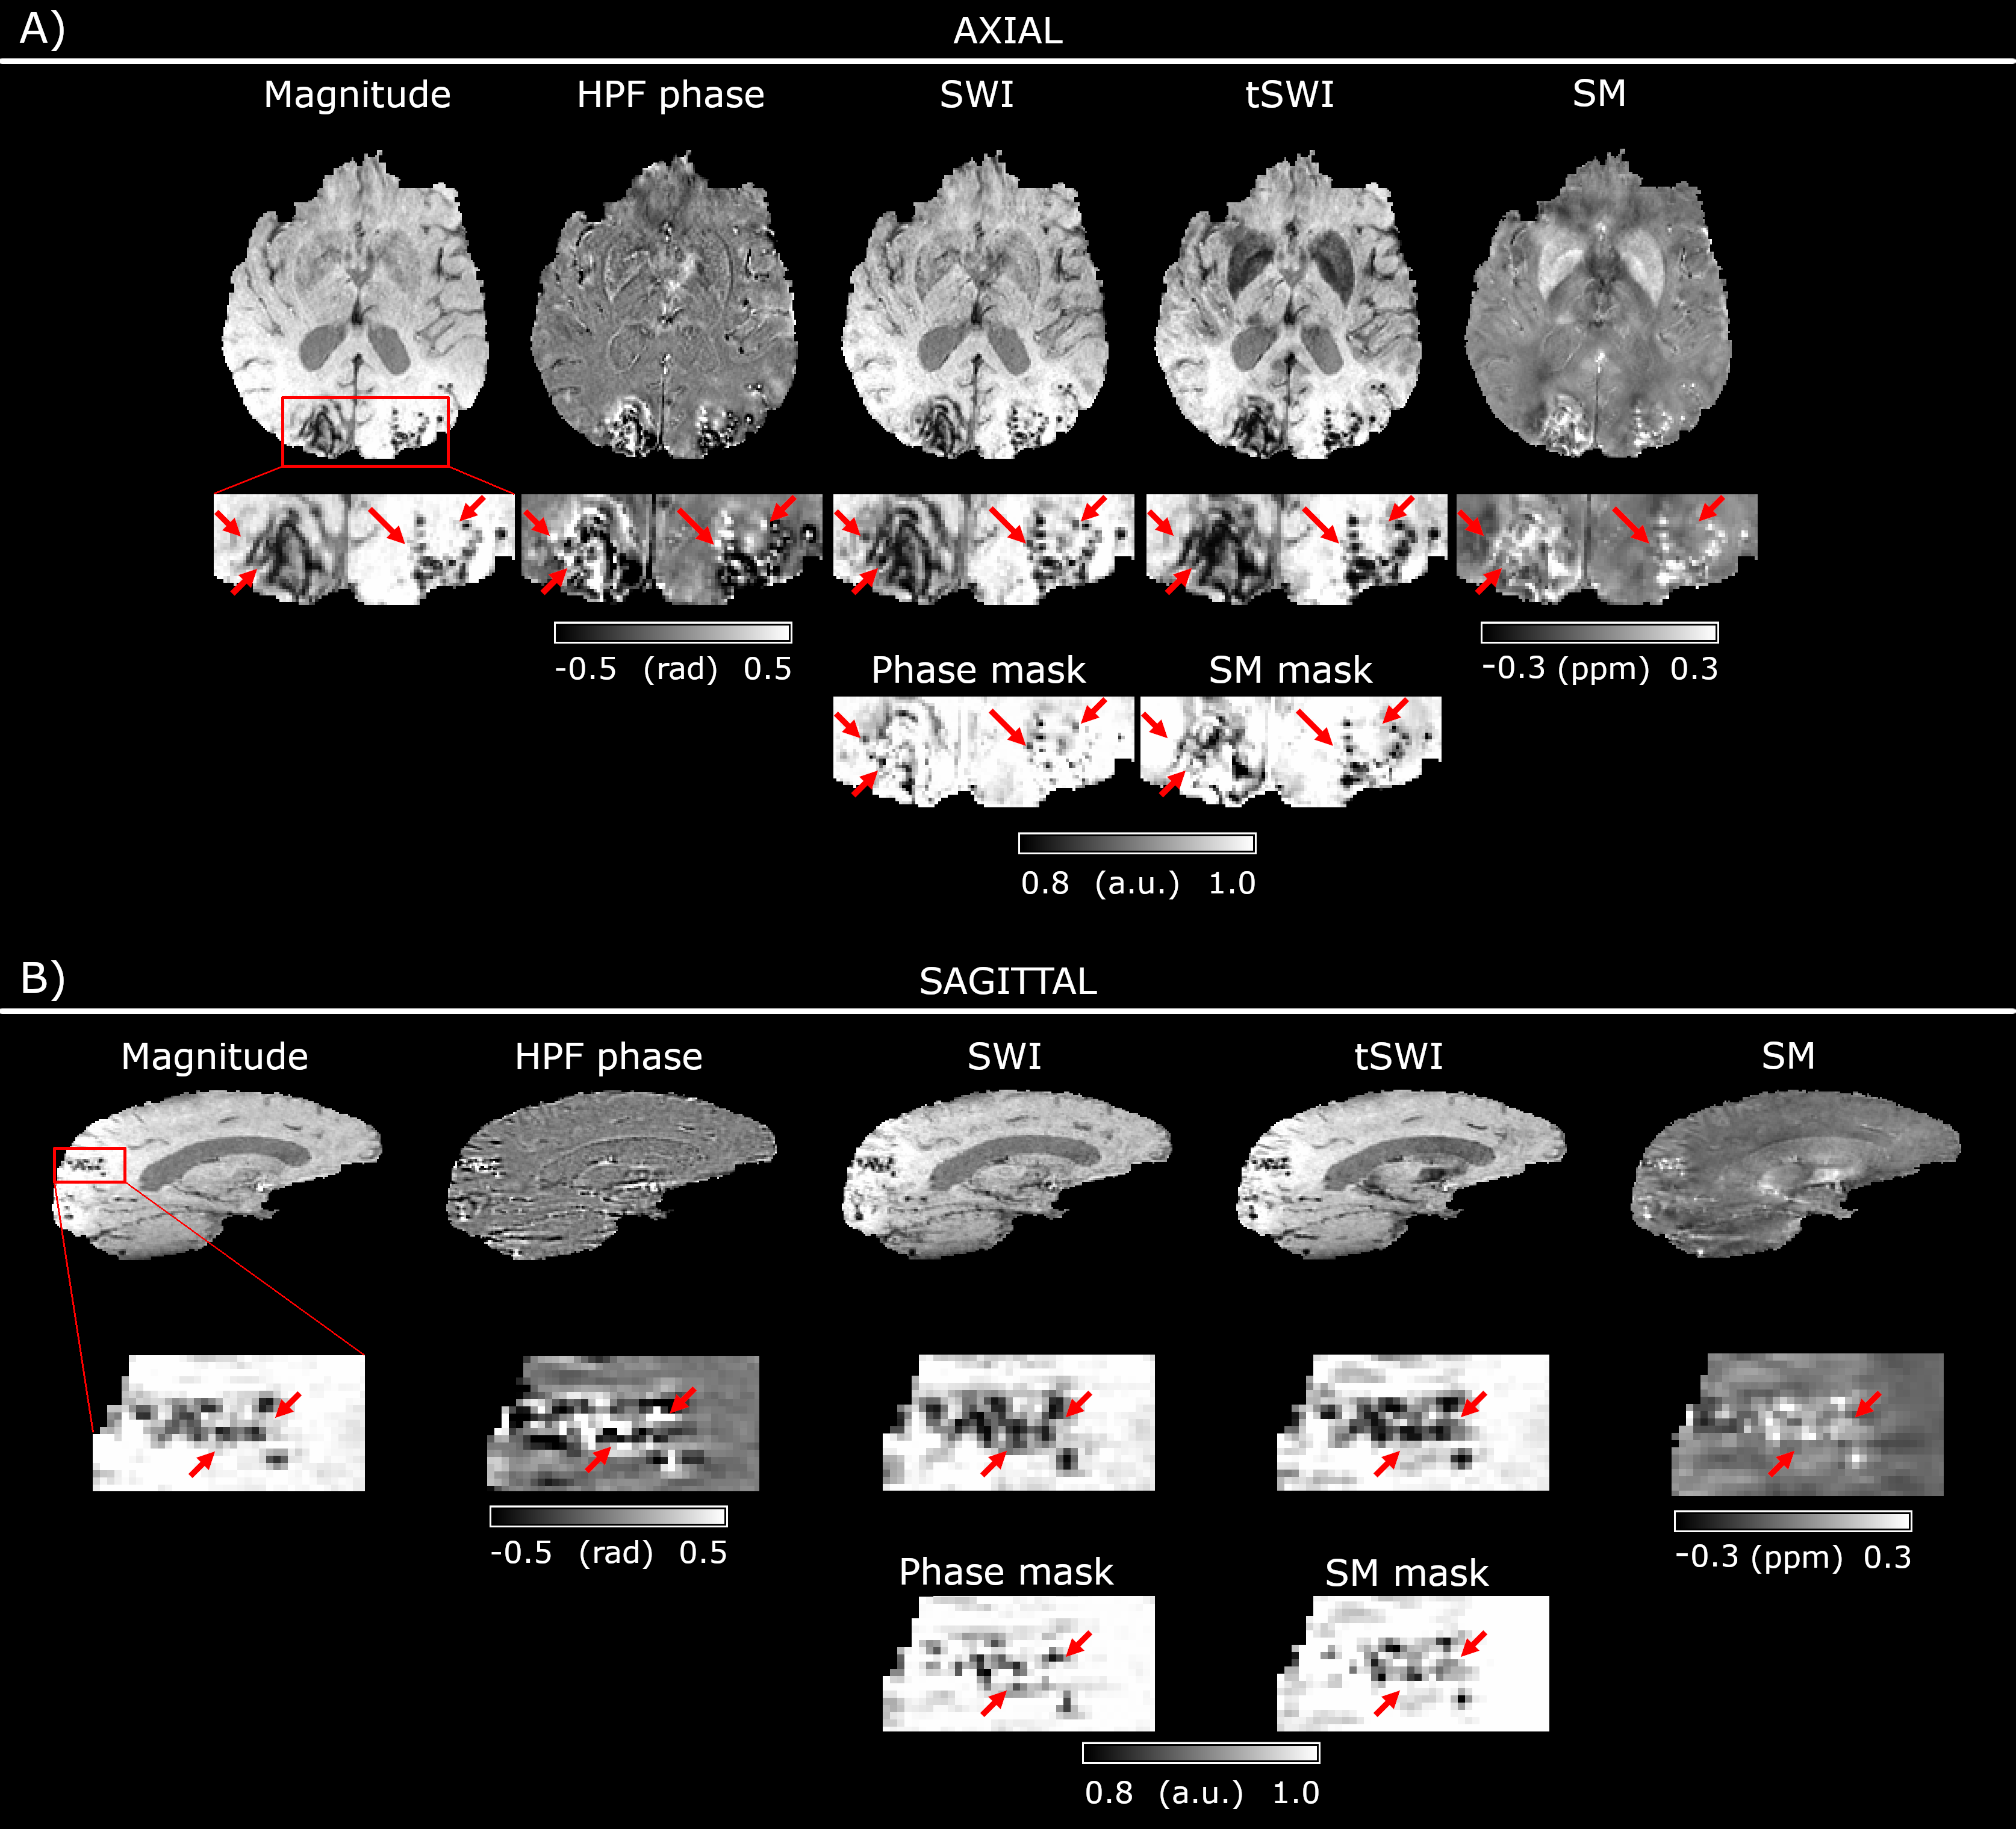
Figures 1 and 2 show examples of artifactual CMB duplication or broadening in SWI in two patients with a light and a heavy CMB burden respectively. In Figure 1A the arrow shows a CMB clearly visible in the HPF phase and SWI but not in the magnitude image, SM and tSWI. The sagittal view of the same CMB (Fig.1B, arrow) reveals a dipole-like field distribution in the HPF phase surrounding the CMB. This creates two hypointense spots along the B0 direction in the phase mask, causing artifactual CMB broadening in SWI, which could be misinterpreted as two neighbouring CMBs. Both the SM and corresponding tSWI are free of this non-local artifact, revealing a single focal susceptibility increase at the CMB. In Figure 2A four apparent CMBs are marked in the SWI, which are not visible in the corresponding magnitude image, SM and tSWI.
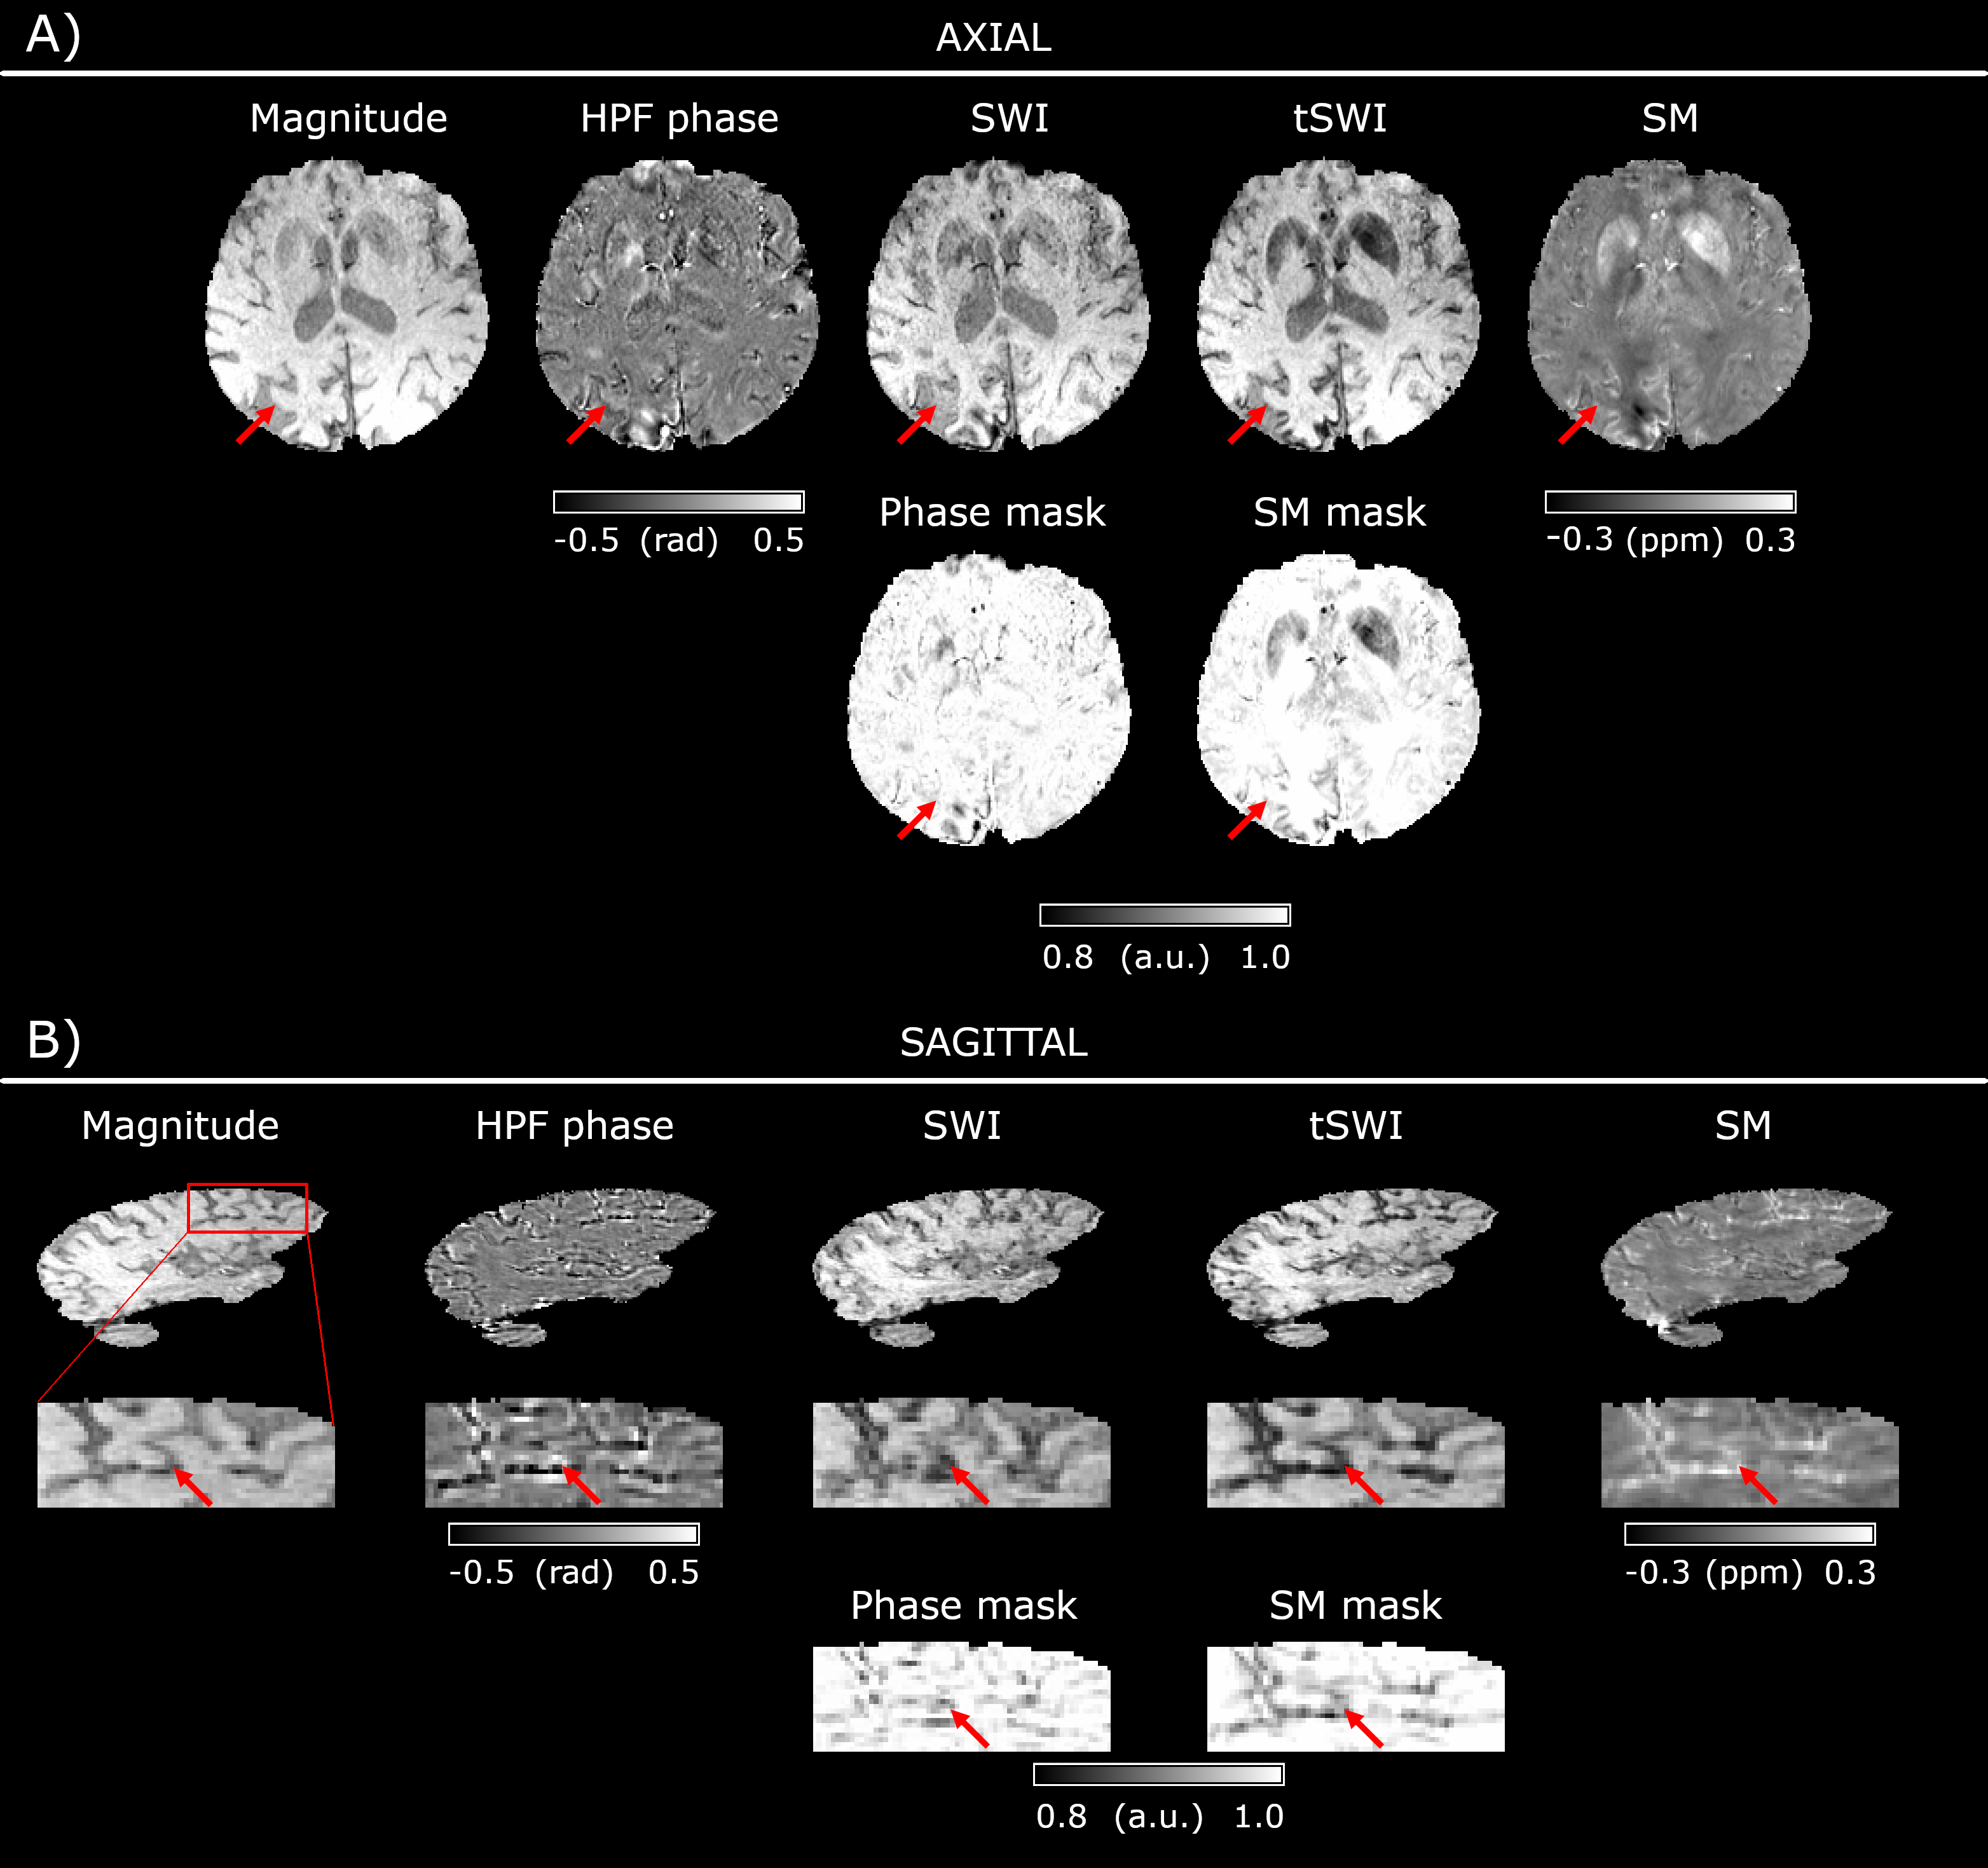
Figure 3 shows a patient with disseminated cSS where cortical surfaces appear artifactually deformed in the SWI (Fig.3A, arrow). The cSS layer is shown clearly in the SM (bright) and tSWI (dark). Non-local phase effects are especially apparent in the sagittal view for cortical surfaces perpendicular to the main magnetic field (Fig.3B, arrow).
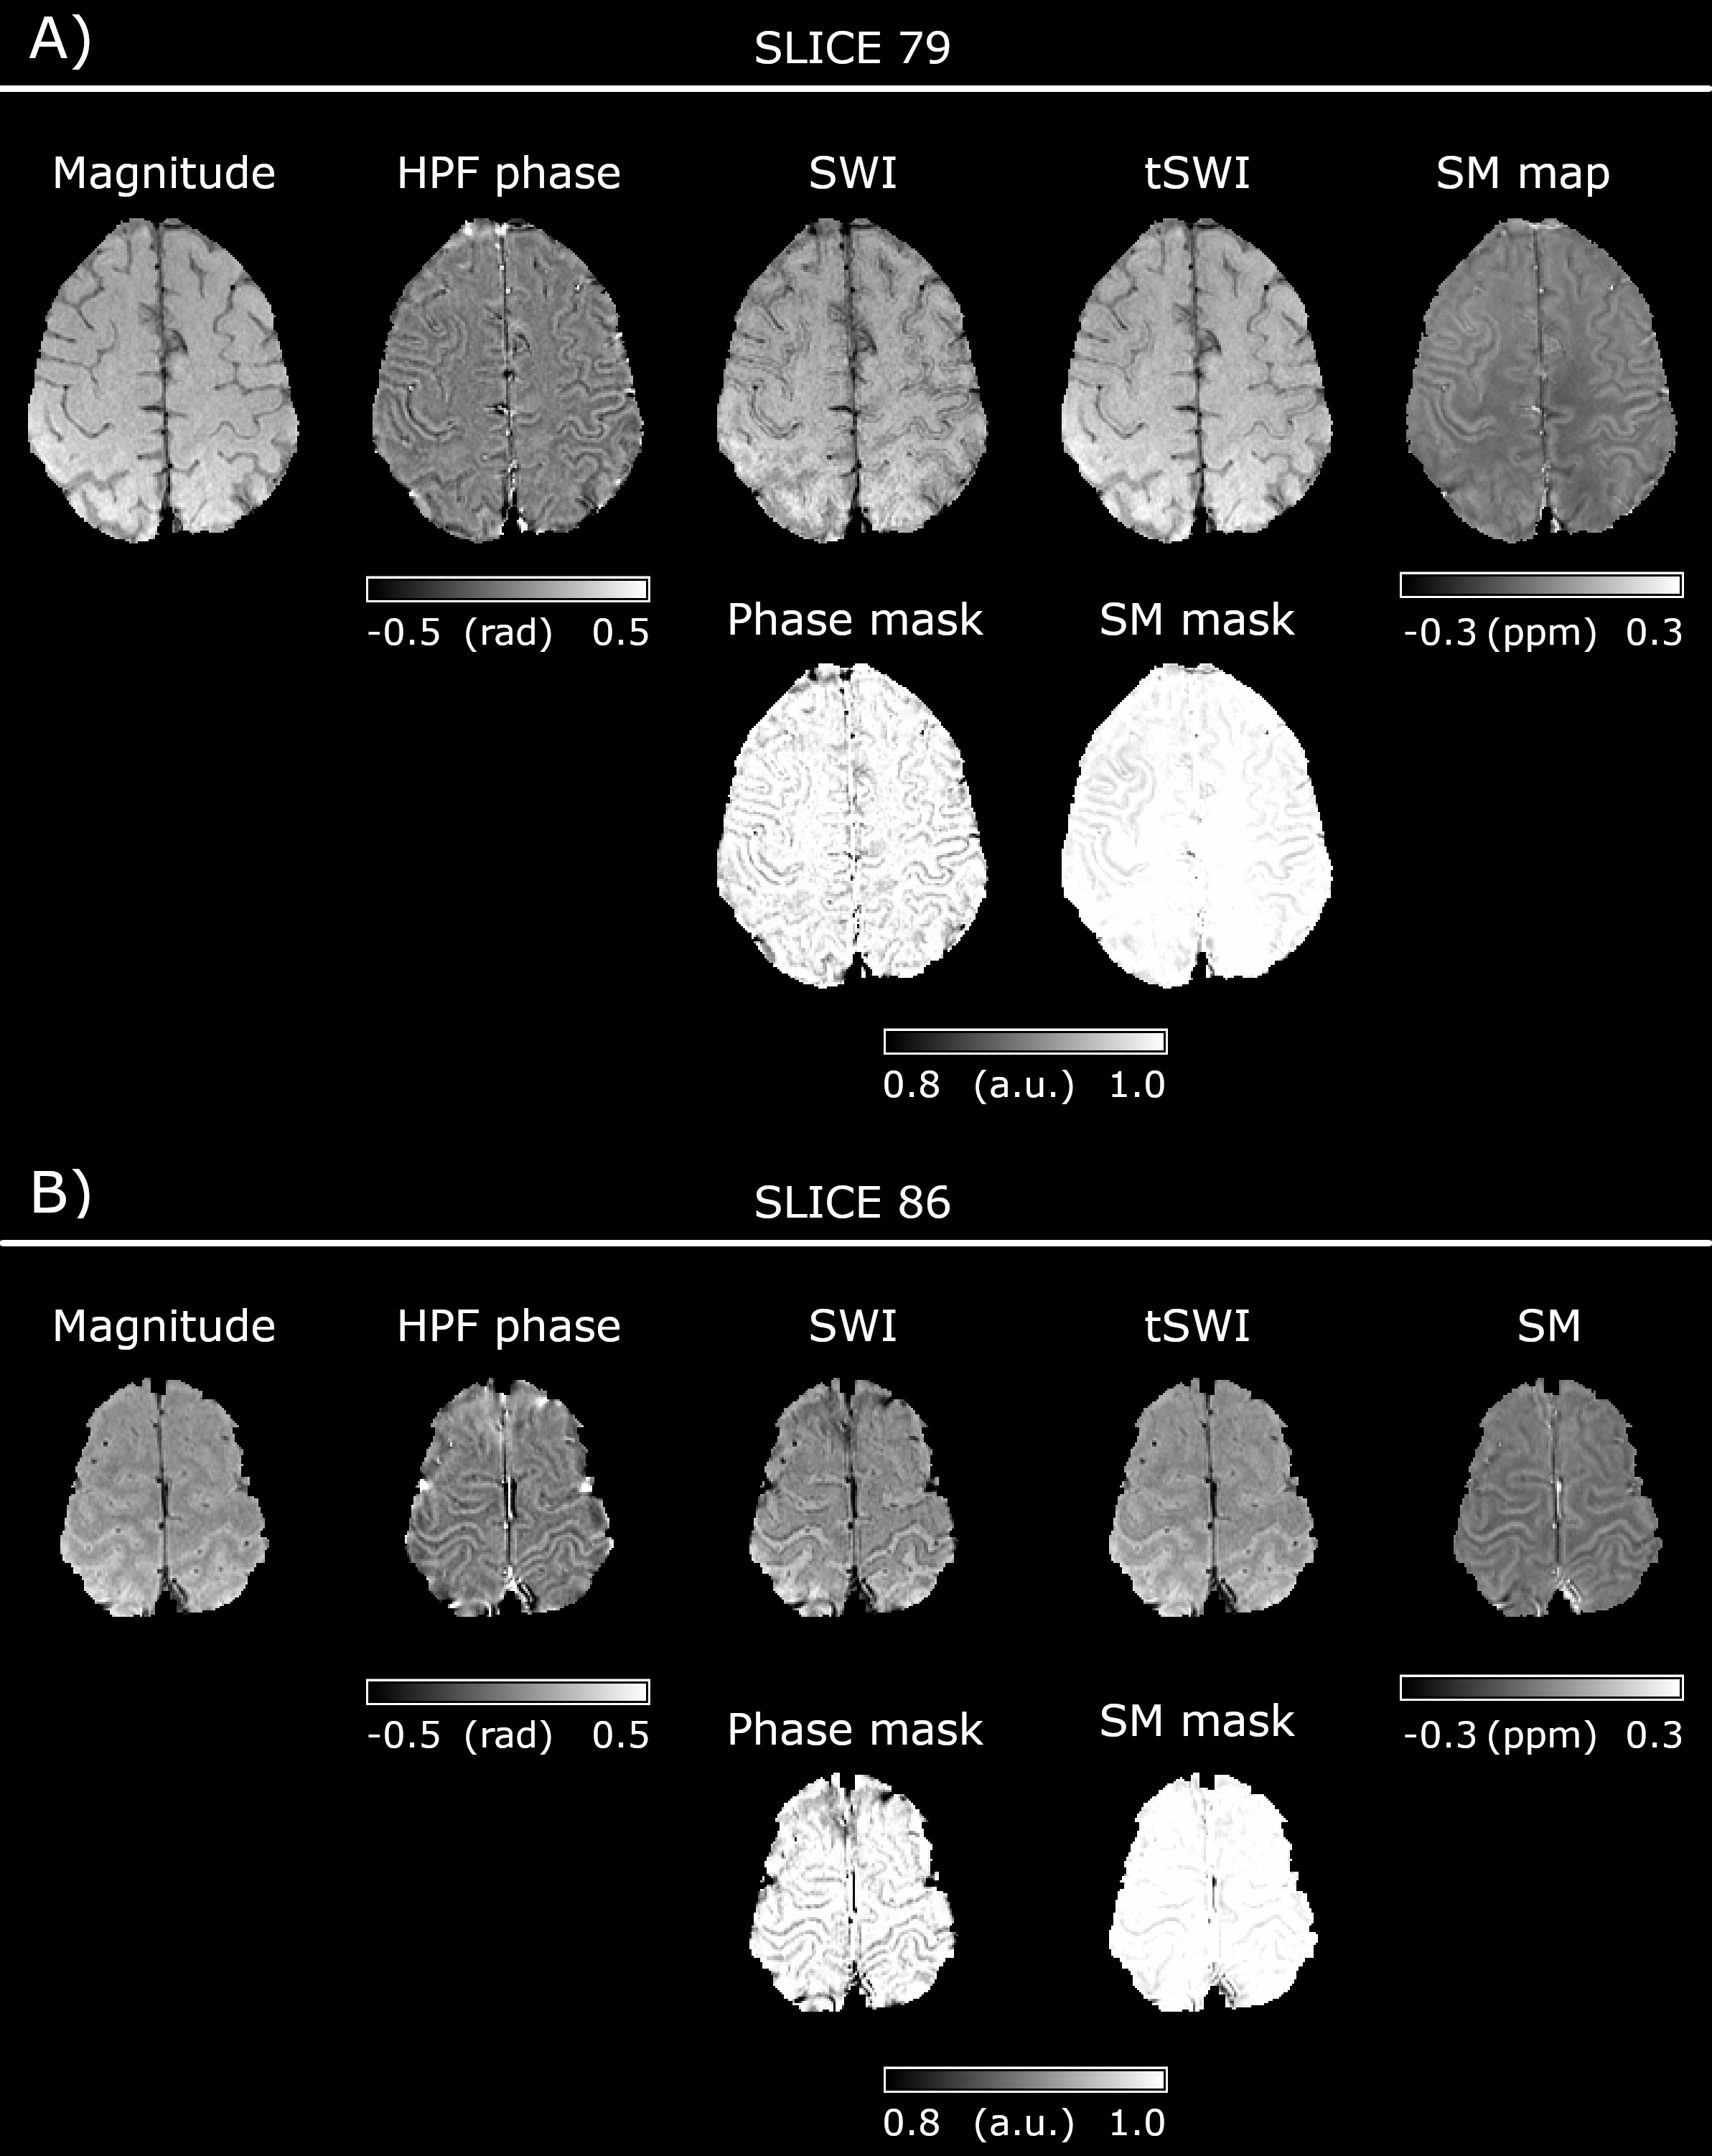
Figure 4 shows two axial slices from a patient whose entire cortical surface appears hypointense in SWI and could therefore be interpreted as disseminated cSS. These hypointensities are less apparent in tSWI, suggesting that the cSS may not be as extensive as the SWI indicates.
All SMs and tSWI were characterised by superior image quality and less noise compared to SWI.
Discussion and conclusions
We have shown that non-local
phase effects in SWI cause broadening and/or duplication of CMBs and
deformation of cSS, which may lead to CMB miscount and misestimation of cSS extent
respectively. SM and tSWI provided better image quality than SWI, facilitating more
accurate CMB size estimation and cSS delineation, and reducing the risk of CMB
miscount. By using the underlying susceptibility instead of non-local phase
values, SM and tSWI are likely to be more accurate than SWI in identifying and
grading haemorrhagic markers of CAA which are essential for diagnosis and
estimating disease severity. Therefore, SM and tSWI may aid clinical management
of patients with CAA and other haemorrhagic cerebral small vessel diseases.
Acknowledgements
The BOCAA study is funded by Rosetrees Trust Fund. BD is supported by Marie Skłodowska-Curie Action (MRI COMIQSUM #798119) and DLT by the UCL Leonard Wolfson Experimental Neurology Centre (PR/ylr/18575).References
1. Biffi A, Greenberg SM. Cerebral Amyloid Angiopathy: A Systematic Review. Journal of Clinical Neurology 2011;7:1 doi: 10.3988/jcn.2011.7.1.1.
2. Xuereb JH, Brayne C, Dufouil C, et al. Neuropathological Findings in the Very Old: Results from the First 101 Brains of a Population-based Longitudinal Study of Dementing Disorders. Annals of the New York Academy of Sciences 2000;903:490–496 doi: 10.1111/j.1749-6632.2000.tb06404.x.
3. Charidimou A, Gang Q, Werring DJ. Sporadic cerebral amyloid angiopathy revisited: recent insights into pathophysiology and clinical spectrum. J Neurol Neurosurg Psychiatry 2012;83:124–137 doi: 10.1136/jnnp-2011-301308.
4. Knudsen KA, Rosand J, Karluk D, Greenberg SM. Clinical diagnosis of cerebral amyloid angiopathy: validation of the Boston criteria. Neurology 2001;56:537–539.
5. Linn J, Halpin A, Demaerel P, et al. Prevalence of superficial siderosis in patients with cerebral amyloid angiopathy. Neurology 2010;74:1346–1350 doi: 10.1212/WNL.0b013e3181dad605.
6. Banerjee G, Carare R, Cordonnier C, et al. The increasing impact of cerebral amyloid angiopathy: essential new insights for clinical practice. J Neurol Neurosurg Psychiatry 2017:jnnp-2016-314697 doi: 10.1136/jnnp-2016-314697.
7. Dierksen GA, Skehan ME, Khan MA, et al. Spatial relation between microbleeds and amyloid deposits in amyloid angiopathy. Annals of Neurology 2010;68:545–548 doi: 10.1002/ana.22099.
8. Charidimou A, Martinez-Ramirez S, Reijmer YD, et al. Total Magnetic Resonance Imaging Burden of Small Vessel Disease in Cerebral Amyloid Angiopathy: An Imaging-Pathologic Study of Concept Validation. JAMA Neurol 2016;73:994–1001 doi: 10.1001/jamaneurol.2016.0832.
9. Haller S, Vernooij MW, Kuijer JPA, Larsson E-M, Jäger HR, Barkhof F. Cerebral Microbleeds: Imaging and Clinical Significance. Radiology 2018;287:11–28 doi: 10.1148/radiol.2018170803.
10. Liu S, Mok K, Neelavalli J, et al. Improved MR venography using quantitative susceptibility-weighted imaging. Journal of Magnetic Resonance Imaging 2014;40:698–708 doi: 10.1002/jmri.24413.
11. Lane CA, Parker TD, Cash DM, et al. Study protocol: Insight 46 – a neuroscience sub-study of the MRC National Survey of Health and Development. BMC Neurology 2017;17:75 doi: 10.1186/s12883-017-0846-x.
12. Eckstein K, Dymerska B, Bachrata B, et al. Computationally Efficient Combination of Multi-channel Phase Data From Multi-echo Acquisitions (ASPIRE). Magnetic Resonance in Medicine 2018;79:2996–3006 doi: 10.1002/mrm.26963.
13. Liu T, Khalidov I, Rochefort L de, et al. A novel background field removal method for MRI using projection onto dipole fields (PDF). NMR in Biomedicine 2011;24:1129–1136 doi: 10.1002/nbm.1670.
14. Kressler B, de Rochefort L, Liu T, Spincemaille P, Jiang Q, Wang Y. Nonlinear Regularization for Per Voxel Estimation of Magnetic Susceptibility Distributions from MRI Field Maps. IEEE Trans Med Imaging 2010;29:273–281 doi: 10.1109/TMI.2009.2023787.
15. Haacke EM, Xu Y, Cheng Y-CN, Reichenbach JR. Susceptibility weighted imaging (SWI). Magnetic Resonance in Medicine 2004;52:612–618 doi: 10.1002/mrm.20198.
Figures