2931
Linearity assessment of the BOLD signal in response to controlled hypercapnea in healthy controls1Medical Imaging, The University Health Network, Toronto, ON, Canada, 2Julien Poublanc, The UNnversity Health Network, Toronto, ON, Canada
Synopsis
This study addresses concerns over the degree to which the relationship between the cerebral BOLD MRI signal and a CO2 flow stimulus is non-linear. The issue was tested using a quantitative BOLD stimulus in a large population of healthy controls. The results indicate that linear modelling of the response compared to the sigmoid model underestimated the response by ≈ 10%. This would indicate that linear modelling of the BOLD is a reasonable surrogate for flow measurement in subjects undergoing cerebrovascular reactivity testing.
Introduction: There has been considerable debate over the nature of the BOLD MRI response to vasodilatory stimuli. Consistent claims have been made over the non-linearity and therefore the quantitative limitations of the response reinforcing the need to acquire cerebrovascular reactivity (CVR) data in the linear range of CO2 dependence.1-4The purpose of this work therefore was to examine the extent to which the BOLD response deviates from linearity by using a well-controlled, repeatable, and quantitative CO2 stimulus using BOLD MRI in healthy controls.
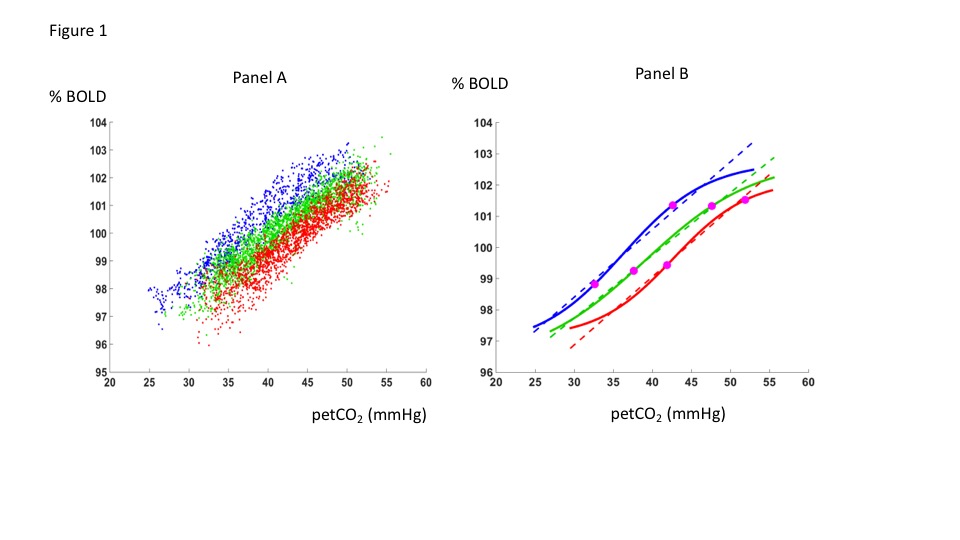
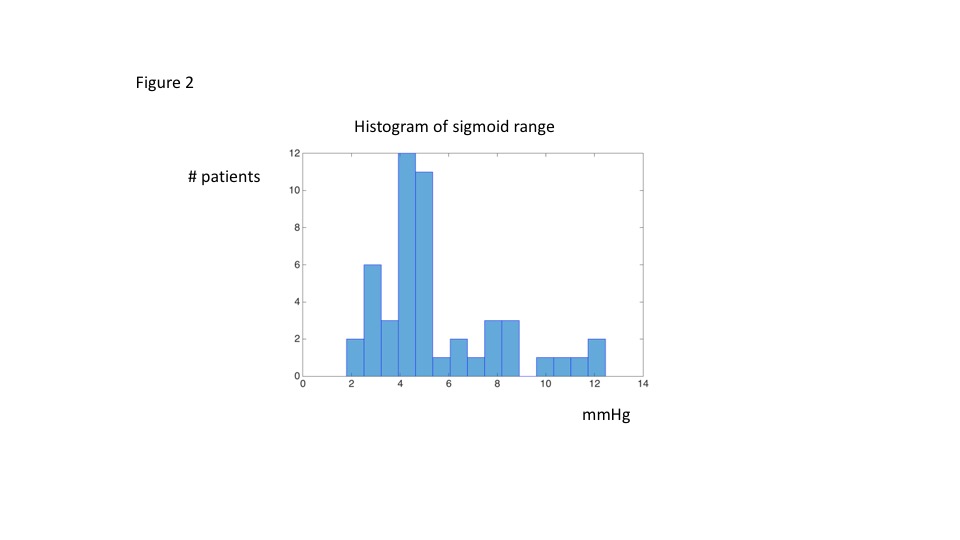
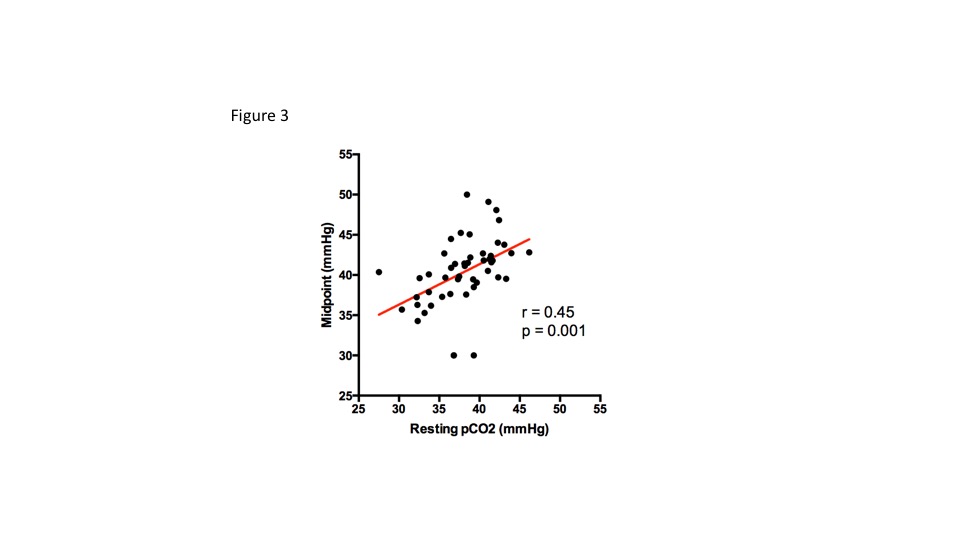
Methods: A retrospective review of a control CVR database was performed. CVR data from 48 heathy controls (ages 18-83 and 18 Males) from the ramp stimulus (see below and figure 1) was included for analysis. The CVR studies were obtained using the same CO2 protocol on the same 3T MR system. The stimulus consisted of 3 baselines held at resting end-tidal CO2 (petCO2) levels with two interspersed petCO2 elevations. The first petCO2 elevation was a 2.5 minute step stimulus with rapid increase in petCO2 from rest to 10 mmHg above rest. The second was a slow ramp increase in petCO2 from 5 mmHg below rest to 15 mmHg above rest over 4.5 minutes. The ramp effectively eliminates confounds secondary to response time delays. Since the CO2 delivery system employed (RespirAcTTM Thornhill Medical) controls alveolar ventilation, petCO2 equals paCO2 so that sampling of petCO2 can be used to measure paCO2 for correlation with the BOLD data.5Furthermore, accurate programmed CO2 stimulus waveforms (step and ramp) can be achieved. CVR data were analyzed by averaging the BOLD response over the MCA territories for each subject followed by fitting as a function of petCO2 to a sigmoid curve: BOLD = b + a( 1 + exp { -(pCO2-m)/r } )-1where m is the midpoint and r is the range (for m-r < pCO2 < m+r, the response is linear to within 1.9% of the sigmoid amplitude). Simple linear regression was then applied to the same data set for comparison with the sigmoid responses. Results: The sigmoid fits gave a mean range r over all subjects = 5.5 ± 2.6 mm Hg. The distribution appears to be bimodal, with a small number of healthy subjects showing a range of around 10 mm Hg (figure 2). For a hypercapnic stimulus of 10 mm Hg above the resting pCO2 and a range of 5.5 mm Hg, the CVR estimated using a linear approximation underestimated the differential CVR at the midpoint (sigmoid slope = a/4r) by 10%. The midpoints were correlated to resting pCO2 (Pearson-r = 0.452, p=0.001) with mid-point on average 2.3 mm Hg higher than the estimated resting pCO2 (figure 3). In addition, there was no correlation between resting petCO2 and the range of the sigmoid.
Discussion:For typical hypercapnic stimuli up to 10 mm Hg, the BOLD response is well within the linear approximation when calculating CVR as the slope of BOLD response to pCO2. Over the range of pCO2 investigated here, the washout non-linearity predicted by the Davis6equation was observable even in subjects with the most linear response (large ranges r ≈ 10 mm Hg) but nevertheless it represented a negligible departure from linearity over a 10 mm Hg range of pCO2 increase over resting values. In addition, despite some variability, the individual resting petCO2 levels tend to reside close to the inflection point of the sigmoidal curves (≈ 2 mmHg).
Conclusion: In spite of expected deoxyhemoglobin washout effects, the response of the BOLD signal to increases in CO2 between resting baseline to 10 mmHg above resting in healthy controls is essentially linear deviating from the linear portion of the sigmoidal curves by 10% at most. This indicates that BOLD CVR is very good correlate of the blood flow response. The only caveat is that BOLD responses in the setting of vascular diseases are not only non-linear, but arenon-sigmoidal.7 Comparison of BOLD versus a gold standard blood flow measure such as positron emission tomography (PET) would be informative but limitations in temporal resolution of the PET method would need to be resolved.
Acknowledgements
No acknowledgement found.References
1. Ghariq, E., Zhang, X., Webb, AG., van Buchem, MA., Dahan, A., van Osch, MJ. Int Soc Magn Reson Med, Milan. 2014. The dependency of cerebral blood flow on endtidal CO2 pressure; p. 213 2. Halani S, Kwinta JB, Golestani AM, Khatamian YB, Chen JJ. Comparing cerebrovascular reactivity measured using BOLD and cerebral blood flow MRI: The effect of basal vascular tension on vasodilatory and vasoconstrictive reactivity. Neuroimage. 2015;110:110-23.3. Tancredi FB, Gauthier CJ, Madjar C, Bolar DS, Fisher JA, Wang DJJ, Hoge RD. Comparison of pulsed and pseudocontinuous arterial spin-labeling for measuring CO2-induced cerebrovascular reactivity. J Magn Reson Imaging. 2012; 36:312–321. [PubMed: 22544711] 4. Bhogal AA, Siero JC, Fisher JA, et al. Investigating the non-linearity of the BOLD cerebrovascular reactivity response to targeted hypo/hypercapnia at 7T. Neuroimage.2014;98:296-305.5. Slessarev M, Han J, Mardimae A, Prisman E, Preiss D, Volgyesi G, Ansel C,Duffin J, Fisher JA. Prospective targeting and control of end-tidal CO2 and O2concentrations. J Physiol. 2007 Jun 15;581(Pt 3):1207-19. 6. Davis TL, Kwong KK, Weisskoff RM, Rosen BR. Calibrated functional MRI: mapping the dynamics of oxidative metabolism. Proc Natl Acad Sci U S A. 1998;95(4):1834-9.7. Duffin J, Sobczyk O, McKetton L, et al. Cerebrovascular Resistance: The Basis of Cerebrovascular Reactivity. Front Neurosci. 2018;12:409.Figures