2930
3D Morphological Measurement of Basilar Artery and Its Relationship with CBF Based on TOF-MRA Data in Elders1State Key Laboratory of Brain and Cognitive Science, Institute of Biophysics, Chinese Academy of Sciences, Beijing, China, 2University of Chinese Academy of Sciences, Beijing, China, 3CAS Center for Excellence in Brain Science and Intelligence Technology, Chinese Academy of Sciences, Beijing, China, 4Department of Radiology, Chinese PLA General Hospital, Beijing, China, Beijing, China
Synopsis
Morphological features of vascular have a major impact on blood flow and chronic diseases. A 3D semi-automatic vessel geometric feature extraction algorithm was developed in this study, and applied to basilar artery (BA). The relationship among BA morphological parameters can be explained by hemodynamic and flow mechanism. The geometry of BA affected the cerebral blood flow value was demonstrated in this study. This algorithm will save us a lot of efforts for analyzing large dataset, and help clinical doctors to quantify the vessel morphometry rapidly.
Introduction
Basilar artery(BA), formed by confluence of two
vertebral arteries, is part of the posterior cerebral circulation to supply
oxygen-rich blood1,2 for occipital and part of temporal lobes,
together with the brain stem and the cerebellum. Morphological features of
vascular have a major impact on blood flow and consequently leading to the
development of brain diseases, like stenosis, aneurysms3. Time-of-flight
magnetic resonance angiography(TOF-MRA) with high contrast between arteries
and surrounding tissues, is often used to visualize blood flow and vasculature.
With the development of
computer-aid techniques, 2D morphological measurement methods based on TOF images have
already well developed. While compared with 3D measurement, 3D measurement
is more accurate and less observer variability for performing large-scale
studies4. Therefore, in this study, we hope to develop a 3D
morphometric method to measure geometric features of basilar artery, and
analyze correlation among these features and their relationships with cerebral blood flow(CBF) in cerebrum.
Materials and Methods
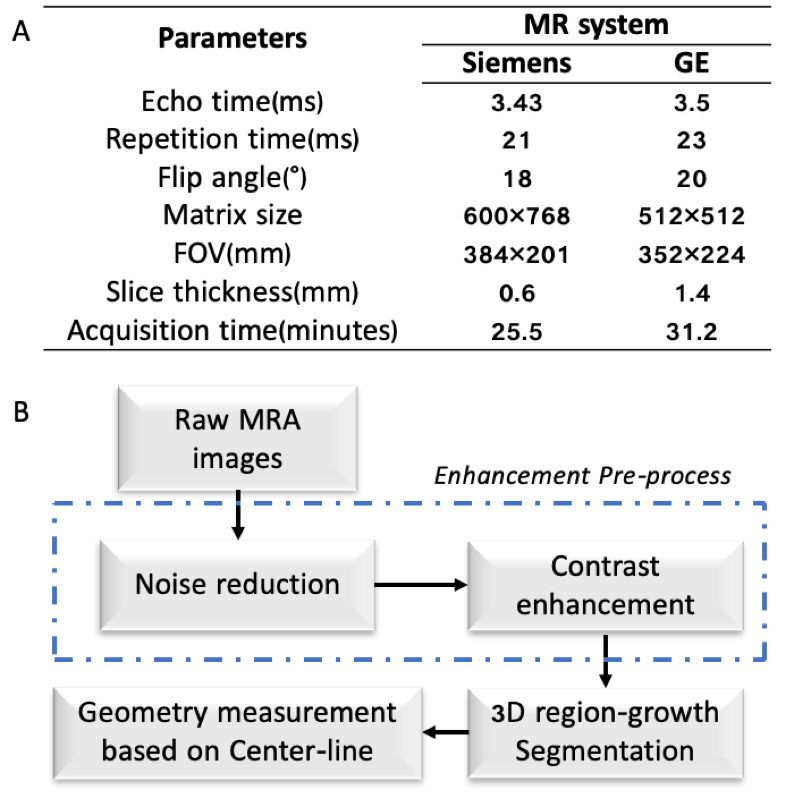
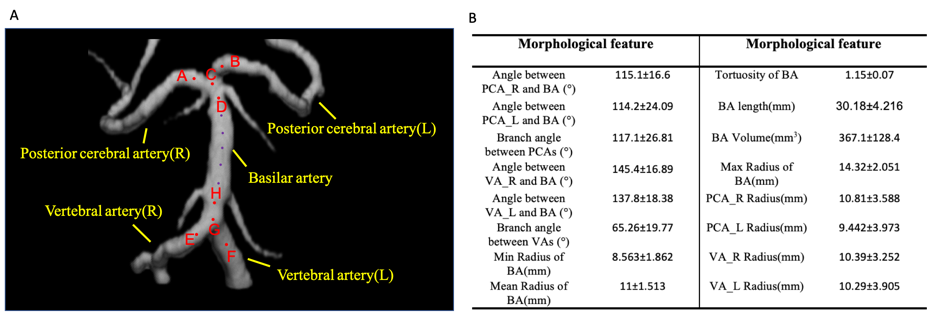
16 healthy elder volunteers (77.7±10.7 years, 14-male) were performed at Siemens Skyra 3.0T MRI system with a 12-channel head coil(Siemens healthnieer, Erlangen, Germany) and GE DISCOVERY MR750 system with an 8-channel head coil(GE Healthcare, USA) and signed the IRB of local hospital. TOF, T1-weighted and arterial spin labeling sequences were scanned to obtain arterial vascular, anatomic and CBF information(the protocols in detail are shown in Fig.1A). Customer post-processing program of segmentation and geometric measurement was implemented in Matlab (The Mathworks Inc., USA). The algorithm in this study for geometric measurement of vascular contained two major stages (Fig.1B). Firstly, adaptive low-pass Wiener filter was performed on TOF images to denoise and enhance the contrast through power-law transformation4. Then a 3D region growing algorithm(26-connected points) started from a selected seed point4 to enhance BA and mask other arteries. Later, the arterial center line was extracted by customer algorithm. Five main branch arteries in total: BA, left and right posterior cerebral arteries(PCA), left and right vertebral arteries(VA). Finally, the vessel morphometric features were extracted, which included bifurcation angle between posterior cerebral arteries(PCAs) (∠ACB), bifurcation angle between vertebral arteries(VAs)(∠EGF), branch angles of bilateral posterior cerebral arteries(PCAs) with BA, branch angles of bilateral VAs with BA, distance between endpoints(C&G) of BA, length and volume of BA(Fig.2A). CBF images were first co-registered to T1w images, then normalized to MNI space. TD-lobe atlas was used to extract regional lobe CBF values. Pearson correlation was using to analyze the relationship between morphological feature of vessel and regional CBF values.
Results
The descriptive statistics of geometric parameters of BA, PCA and VA were listed in Fig.2B: length/mean radius of BA(20.18±4.22/8.56±1.51mm), PCA/VA bifurcation angle(117.1±26.8°/65.3±19.8°) and volume of BA(0.367±0.128mL). The relationship between vessel geometric features displayed in Fig.3. Fig.3a&b showed that mean radius value of BA is strongly associated with length of BA (R2=0.3964, p<0.005) and branch angle of PCAs (R2=0.265, p<0.05). With the branch angle of PCAs increasing, the flow resistance increase, leading to the blood pressure increase. For elder volunteers, the blood vessel elasticity is getting weaker, inducing the mean radius and volume of BA increase. Fig.3c&d indicated a strong negative relationship between left VA-BA angle and VA bifurcation angle (R2=0.260, p<0.005), left PCA-BA and mean PCA bifurcation angle (R2=0.540, p<0.005). Both of these correlations were only found in the left, no correlation was found in the right artery (R2=0.0007, p=0.92; R2=0.2033, p=0.079). Fig.3e&f show VAs bifurcation angle was significantly correlated with minimum BA radius (R2=0.336, p<0.005) and right VA radius (R2=0.445, p<0.05). As the bifurcation angle of VAs increase, the blood flow from both of the left and right Vas will increase flow resistance, which will enlarge the arteries radius, such as right VA radius and minimum radius of BA. The linear correlation between geometric features of BA and lobe CBF values exhibited in Fig.4. the angle between right PCA and BA is strongly associated with CBF value of parietal lobe (R2=0.276, p<0.005) and occipital lobe (R2=0.324, p<0.005).
Discussion and Conclusion
A 3D semi-automatic basilar artery geometry features extraction algorithm was successfully developed. The relation between the BA morphometric parameters can be perfectly explained through hemodynamic and flow mechanism. It is found that an increase of bifurcation angle between PCAs, leading to increase of mean BA radius and BA length. PCA bifurcation angle is an important hemodynamic contributor in posterior cerebral circulation. Larger bifurcation angle means more pressure for the blood, resulting in increasing mean radius of BA. And some correlations among BA morphometric parameters with regional cerebral blood flow were demonstrated in smaller sample. This algorithm will save us a lot of efforts for analyzing large dataset, and help clinical doctors to quantify the vessel morphometry rapidly.
Acknowledgements
This work
was supported in part by the Ministry of Science and Technology of China (2015CB351701),
the National Natural Science Foundation of China (31730039, 81871350), National
Major Scientific Instruments and Equipment Development Project (ZDYZ2015-2) and
Chinese Academy of Sciences Strategic Priority Research Program B grants (XDBS01000000).
References
1.
Wake-Buck AK, Gatenby JC, Gore JC. Hemodynamic
characteristics of the vertebrobasilar system analyzed using MRI-based
models. PLoS One. 2012;7(12):e51346.
2.
Yadav S. Variations of circle of Willis in human
cadavers. 2018;11(2):43-45.
3.
Stapleton CJ, Kumar JI, Walcott BP, et al. The
effect of basilar artery bifurcation angle on rates of initial occlusion,
recanalization, and retreatment of basilar artery apex aneurysms following coil
embolization. Interv Neuroradiol. 2016;22(4):389-95.
4. Neubert
A, Fripp J, Engstrom C, et al. Three-dimensional morphological and signal
intensity features for detection of intervertebral disc degeneration from
magnetic resonance images. 2013:1082-1090.
5.
M. M. Almi'ani and B. D. Barkana. Automatic
segmentation algorithm for brain MRA images, 2012 IEEE Long Island
Systems. Applications and Technology Conference (LISAT), Farmingdale, NY, 2012,
pp. 1-5.
6.
M. M. Almi'ani and B. D. Barkana, A modified
region growing based algorithm to vessel segmentation in magnetic resonance
angiography, 2015 Long Island Systems, Applications and Technology,
Farmingdale, NY, 2015, pp. 1-7.
Figures