2920
Voxel-based Analyses of SUVs and ADCs with a 18FDG-PET/MR System in Differentiating CNS Lymphomas from Glioblastomas1Department of Clinical Radiology, Graduate School of Medical Sciences, Kyushu University, Fukuoka, Japan, 2Department of Molecular Imaging & Diagnosis, Graduate School of Medical Sciences, Kyushu University, Fukuoka, Japan
Synopsis
Using a hybrid PET/MR system that enables precise image co-registration of 18FDG-PET and DWI, we evaluate the utility of voxel-based analysis of SUVs and ADCs to differentiate CNS lymphomas from GBs. Fifteen GBs and five CNS lymphomas were enrolled. DWI and 18FDG-PET were acquired. Volume, SUVmax, ADCmin, correlation coefficient, elliptical 95% area of bivariate normal distribution of SUVs and ADCs and elliptical 95% area/volume were evaluated. Elliptical 95% area/volume in CNS lymphomas was higher than that of GBs and showed the best diagnostic performance. Voxel-based analysis of 18FDG-PET/MR may be useful to differentiate CNS lymphomas from GBs.
Introduction
Several studies have shown that minimum apparent diffusion coefficient (ADCmin)values from diffusion-weighted imaging (DWI) and maximum standardized uptake value (SUVmax) from fluorine-18-fluoro-2-deoxy-D-glucose (18FDG) positron emission tomography (PET) can help differentiate between central nervous system (CNS) lymphoma and glioblastoma(GB).1,2 However, solely SUVmax or ADCmin based quantification methods were potentially problematic, as the assessment with a single voxel measurement of SUVmax or ADCmin did not accurately reflect the metabolic activity or cellular density of a whole tumor. A hybrid PET/MR system has recently been developed that enables the acquisition of 18FDG-PET and DWI simultaneously, and precise image co-registration,3 and could potentially enable direct voxel-by-voxel comparison of SUV and ADC. The purpose of this study was to evaluate the utility of voxel-based analyses of SUVs and ADCs obtained on a 18FDG-PET/MR system to differentiate CNS lymphomas from GBs.Materials and Methods
Fifteen GBMs (M/F: 9/6, age: 53.8±16.8 y.o.) and 5 CNS lymphomas (M/F: 2/3, age: 70.8±8.2 y.o.) were enrolled from February 2015 to October 2018. PET/MR imaging was performed with the Ingenuity TF PET/ MR system (Philips Healthcare, Cleveland, OH, USA). PET imaging was initiated 60 to 90 minutes after the administration of 18F-FDG (4.0 MBq/kg). The field of view (FOV) for the PET imaging was 256 × 256 mm. PET images were reconstructed with 2 × 2 × 2 mm3 voxels. Then, MRI including DWI, T2-weighted imaging (T2WI), 3 dimensional T1-weighted imaging (3D-T1WI) was performed. DWI was acquired using a single-shot spin-echo echo planar sequence with following parameters: repetition time 4136 msec, echo time 70 msec, b value 0 and 1000 s/mm2, FOV 230 × 230 mm2, matrix 256 × 256, slice thickness = 5 mm, acquisition time 165 sec. All image processing was executed using Intellispace Portal workstation, Osirix, and Fiji. First, image registration with rigid transformation was performed between 3D-T1WIs and PET images. T2WIs and PET images were then resliced in accordance with ADC maps (5 mm). On T2WIs, ROIs were manually drawn along the border of the tumor (mass and surrounding T2-hyperintense area) in all slices. Gray matter was manually excluded. The ROIs were then copied onto the ADC maps and PET images. After extracting tumor area, in-plane image resolution was interpolated to 4 × 4 mm2 from 2 × 2 mm2. Pairs of ADCs and SUVs within the whole tumor ROIs were recorded along with the X-Y coordinates in a voxel-wise manner, and scatter plots of SUV versus ADC were generated for each tumor. Tumor volume, SUVmax, ADCmin, Pearson`s correlation coefficients of SUVs and ADCs, elliptical 95% areas of bivariate normal distribution of SUVs and ADCs and elliptical 95% area/volume were compared with the Mann–Whitney U-test. ROC analysis was also performed. P < 0.05 was considered significant.
Results
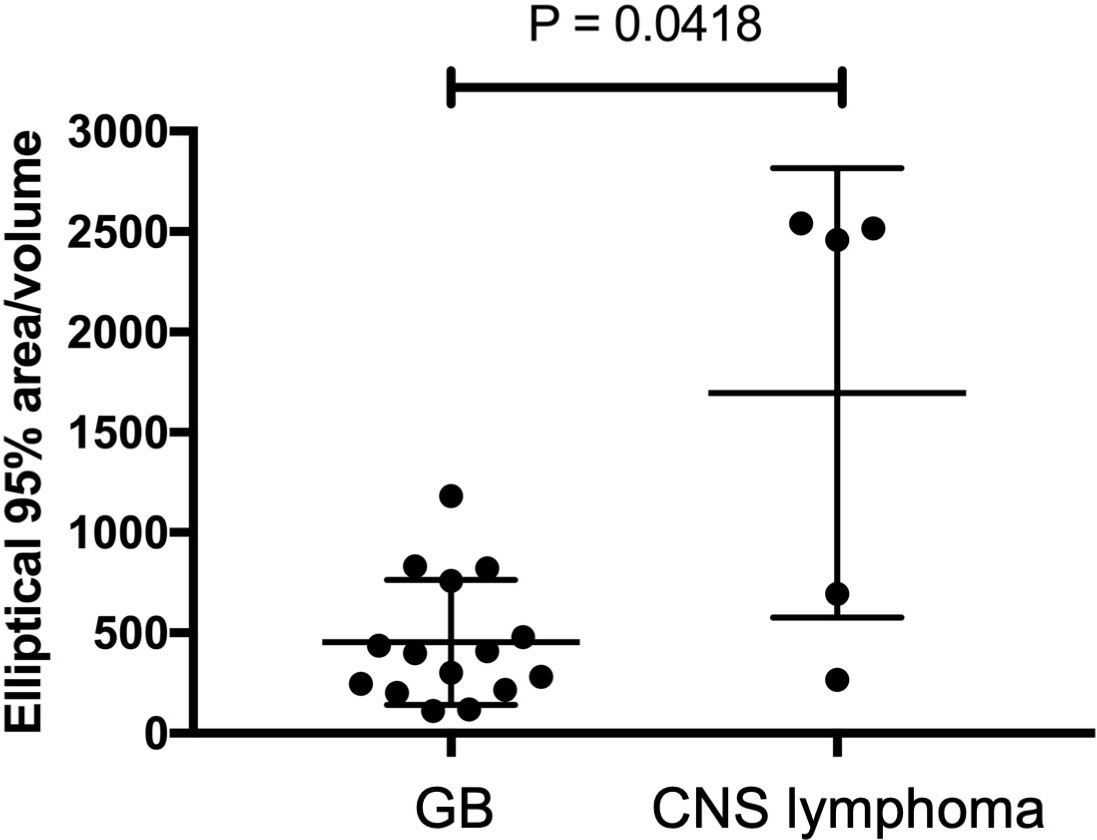
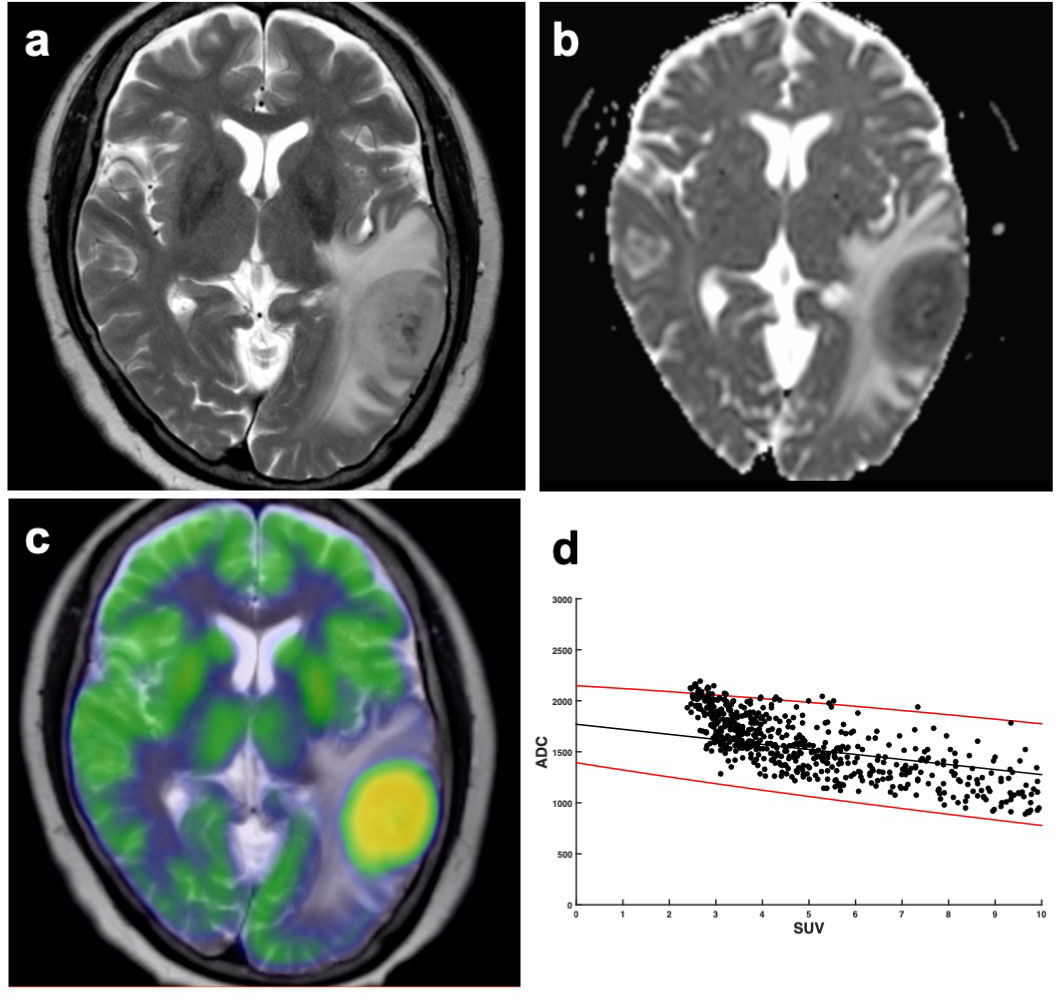
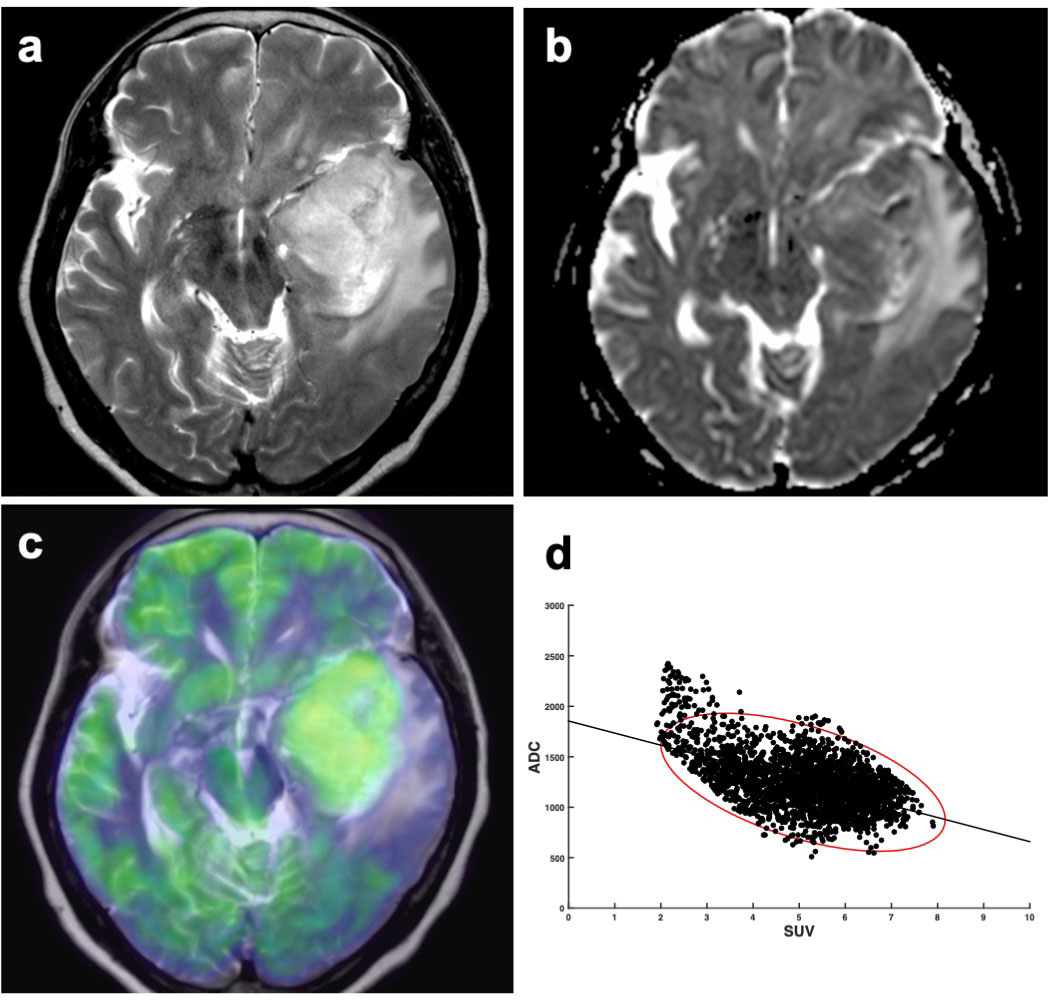
The elliptical 95% area/volume in CNS lymphomas was higher than that of GBs (1696 ± 1120 vs. 452 ± 310, P = 0.0418). Other parameters did not differ significantly (P > 0.05). ROC analysisdemonstrated that the elliptical 95% area/volume showed the best diagnostic performance for differentiating the two groups (AUC 0.81, sensitivity 60.0%, specificity 93.3%). Comparisons of each measurement between CNS lymphomas and GBs are shown in Fig. 1. Figs. 2 and 3 show representative cases of CNS lymphoma and GB.Discussion
The elliptical 95% area/volume obtained from the scatter plot of SUV and ADC exhibited a better diagnostic performance for differentiating CNS lymphomas from GBs than any single conventional parameter alone.Voxel-based analysis can provide information on internal heterogeneity based on SUV and ADC in the tumor in the form of scatter plots of SUV and ADC. The elliptical 95% area of bivariate normal distribution of SUV and ADC is a candidate to use to semi-quantify the degree of SUV-ADC heterogeneity of tumors.4 In the present study, volume of CNS lymphomas tended to be smaller than that of GBs. In order to compare elliptical 95% areas of both groups after reducing the influence of tumor volume, we set a parameter of elliptical 95% area/volume.The SUV of CNS lymphomas showed wider range than that of GB, whereas ADC value of both groups showed substantially overlap. This broader range of SUV within CNS lymphomas made the 95% area/volume larger than that of GBs. We presumed that this was because CNS lymphomas tended to show higher glucose metabolism than that of GBs, especially in the central area. Moreover, a relatively large amount of low SUVs for volume were shown in CNS lymphomas, presumably corresponding heterogeneous glucose metabolism within a tumor. In summary, the elliptical 95% area/volume acquired by 18FDG-PET/MR was useful to differentiate CNS lymphomas from GBs.Acknowledgements
No acknowledgement found.References
1. Toh CH, Castillo M, Wong AM, et al. Primary cerebral lymphoma and glioblastoma multiforme: differences in diffusion characteristics evaluated with diffusion tensor imaging. AJNR American journal of neuroradiology 2008;29:471-4752.
2. Okada Y, Nihashi T, Fujii M, et al. Differentiation of newly diagnosed glioblastoma multiforme and intracranial diffuse large B-cell Lymphoma using (11)C-methionine and (18)F-FDG PET. Clinical nuclear medicine 2012;37:843-8493.
3. Sagiyama K, Watanabe Y, Kamei R, et al. Comparison of positron emission tomography diffusion-weighted imaging (PET/DWI) registration quality in a PET/MR scanner: Zoomed DWI vs. Conventional DWI. Journal of magnetic resonance imaging : JMRI 2016;43:853-8584.
4. Sagiyama K, Watanabe Y, Kamei R, et al. Multiparametric voxel-based analyses of standardized uptake values and apparent diffusion coefficients of soft-tissue tumours with a positron emission tomography/magnetic resonance system: Preliminary results. European radiology 2017;27:5024-5033
Figures