2916
Percentile-based Analysis of Non-Gaussian Diffusion Parameters for Improved Glioma Grading1Naperville North High School, Naperville, IL, United States, 2Center for Magnetic Resonance Research, University of Illinois at Chicago, Chicago, IL, United States, 3Department of Radiology, Tongji Hospital, Tongji Medical College, Huazhong University of Science and Technology, Wuhan, China, 4Department of Bioengineering, University of Illinois at Chicago, Chicago, IL, United States
Synopsis
Diffusion MRI has been used for tumor grading due to its sensitivity to alterations at the tissue microstructural level. Recognizing the limitations of analysis methods based on region-of-interest (ROI) in which the parameter values are averaged over the tumor ROIs, histogram-based approaches have been proposed for differentiating tumor grades. One challenge in this approach is to determine an optimal percentile over the ROI to be used in the analysis. In this study, we systematically and statistically determined an optimal percentile cut-off for calculating the mean parameters obtained from a non-Gaussian diffusion model based on continuous-time random-walk (CTRW) theory for differentiation among glioma grades.
Introduction:
Diffusion MRI with Gaussian or non-Gaussian models has been increasingly used for cancer detection, grading, and treatment monitoring1. Irrespective of the diffusion models, the vast majority of the studies have used region-of-interest (ROI) analyses by computing the mean value of diffusion parameters over the tumor tissues. Recognizing the high degree of tumor heterogeneity, a number of investigators recently employed percentile- or quartile-based histogram analysis in diffusion MRI studies on cancer2-4. When a percentile-based analysis is used, a key issue is to determine a percentile cutoff. A small percentage (e.g., 5%) makes the analysis vulnerable to reduced statistical power, while a large percentage (e.g., 100%) can reduce the sensitivity due to the averaging effect among heterogenous tissues within a tumor. In this study, we have systematically evaluated the effect of different percentiles on grading 91 glioma patients using a set of diffusion parameters obtained from a non-Gaussian diffusion model based on a continuous-time random walk (CTRW)5 with high b-values.Materials and Methods:
Patients: The study enrolled 91 patients with histopathologically proven tumors (age range: 18-75 years; 40 females). 1 patient was diagnosed with grade I (excluded due to the low sample size), 42 with grade II, 19 with grade III, and 29 with grade IV glioma. Diffusion MRI: All patients were scanned on a 3T GE MR750 scanner. DWI was performed with 17 b-values (0 to 4000 s/mm2), TR/TE=4700/100ms, slice thickness=5mm, field-of-view=22cm×22cm, matrix size=256×256, and total scan time≈4 minutes. Trace-weighted images were obtained to minimize the effect of diffusion anisotropy. DWI Analysis: The multi-b-value diffusion images were analyzed with the CTRW model5, $$$S/S_{0}=E_{\alpha}(-(bD_{m})^{\beta})$$$, where Dm is an anomalous diffusion coefficient, α and β are temporal and spatial diffusion heterogeneity parameters, respectively. Percentile-based Histogram Analysis: The ROIs containing the entire tumor were drawn on b=0 images. A histogram analysis over the ROIs was employed to determine the percentile cut-offs with the following steps: 1) The p-values for the statistical differences in the mean Dm, α, or β between grade II&II and grade III&IV gliomas were computed (using Student’s t-test) with different percentiles (i.e., from 1% to 100% with an increment of 1%) as the threshold for computing the mean; 2) The percentile cut-off was determined for each parameter as the highest percentile with p-value<0.05; and 3) The mean parameter values computed by using the percentile cut-offs were then employed to perform a receiver operator characteristic (ROC) analysis for the differentiation between grade II&III and grade III&IV gliomas. This analysis was repeated for the 100th percentile (i.e., computing the mean from the entire ROI) for comparison.Results:
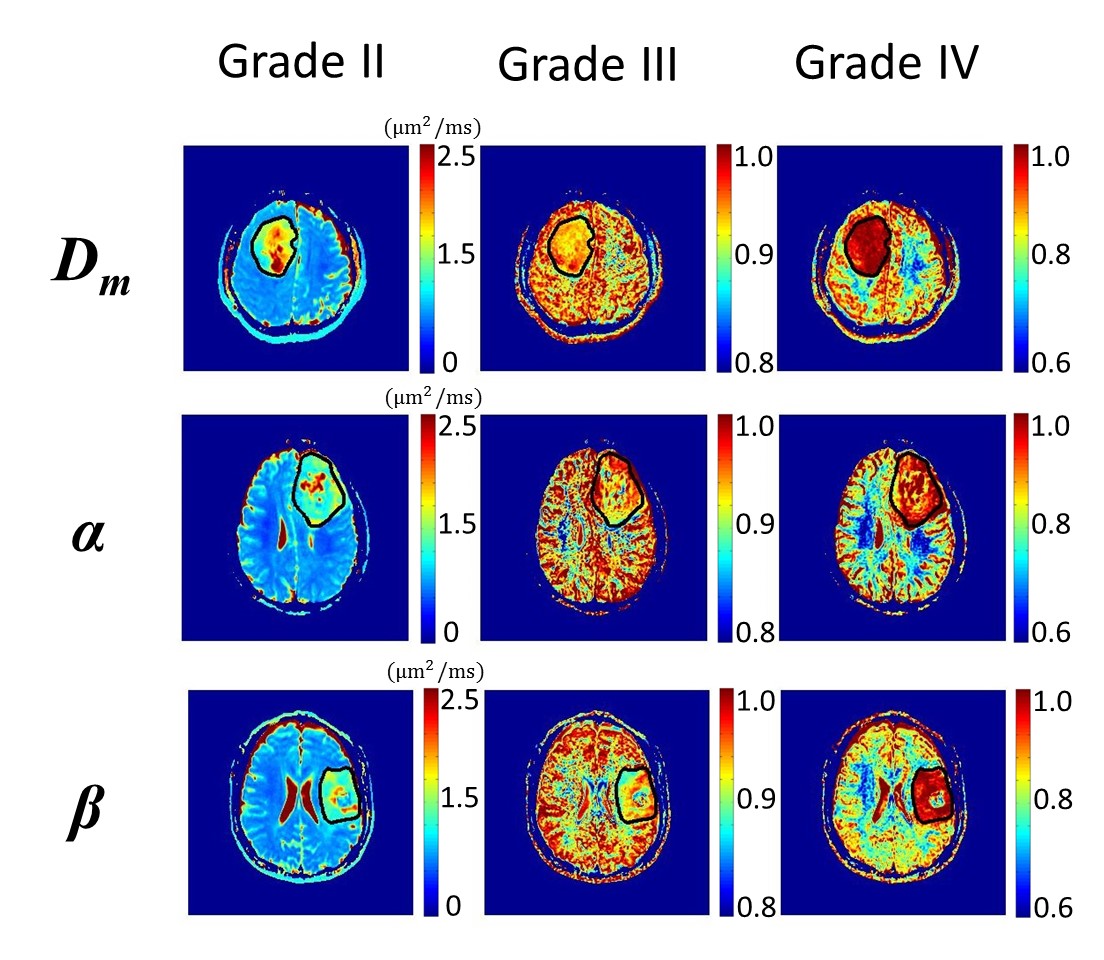
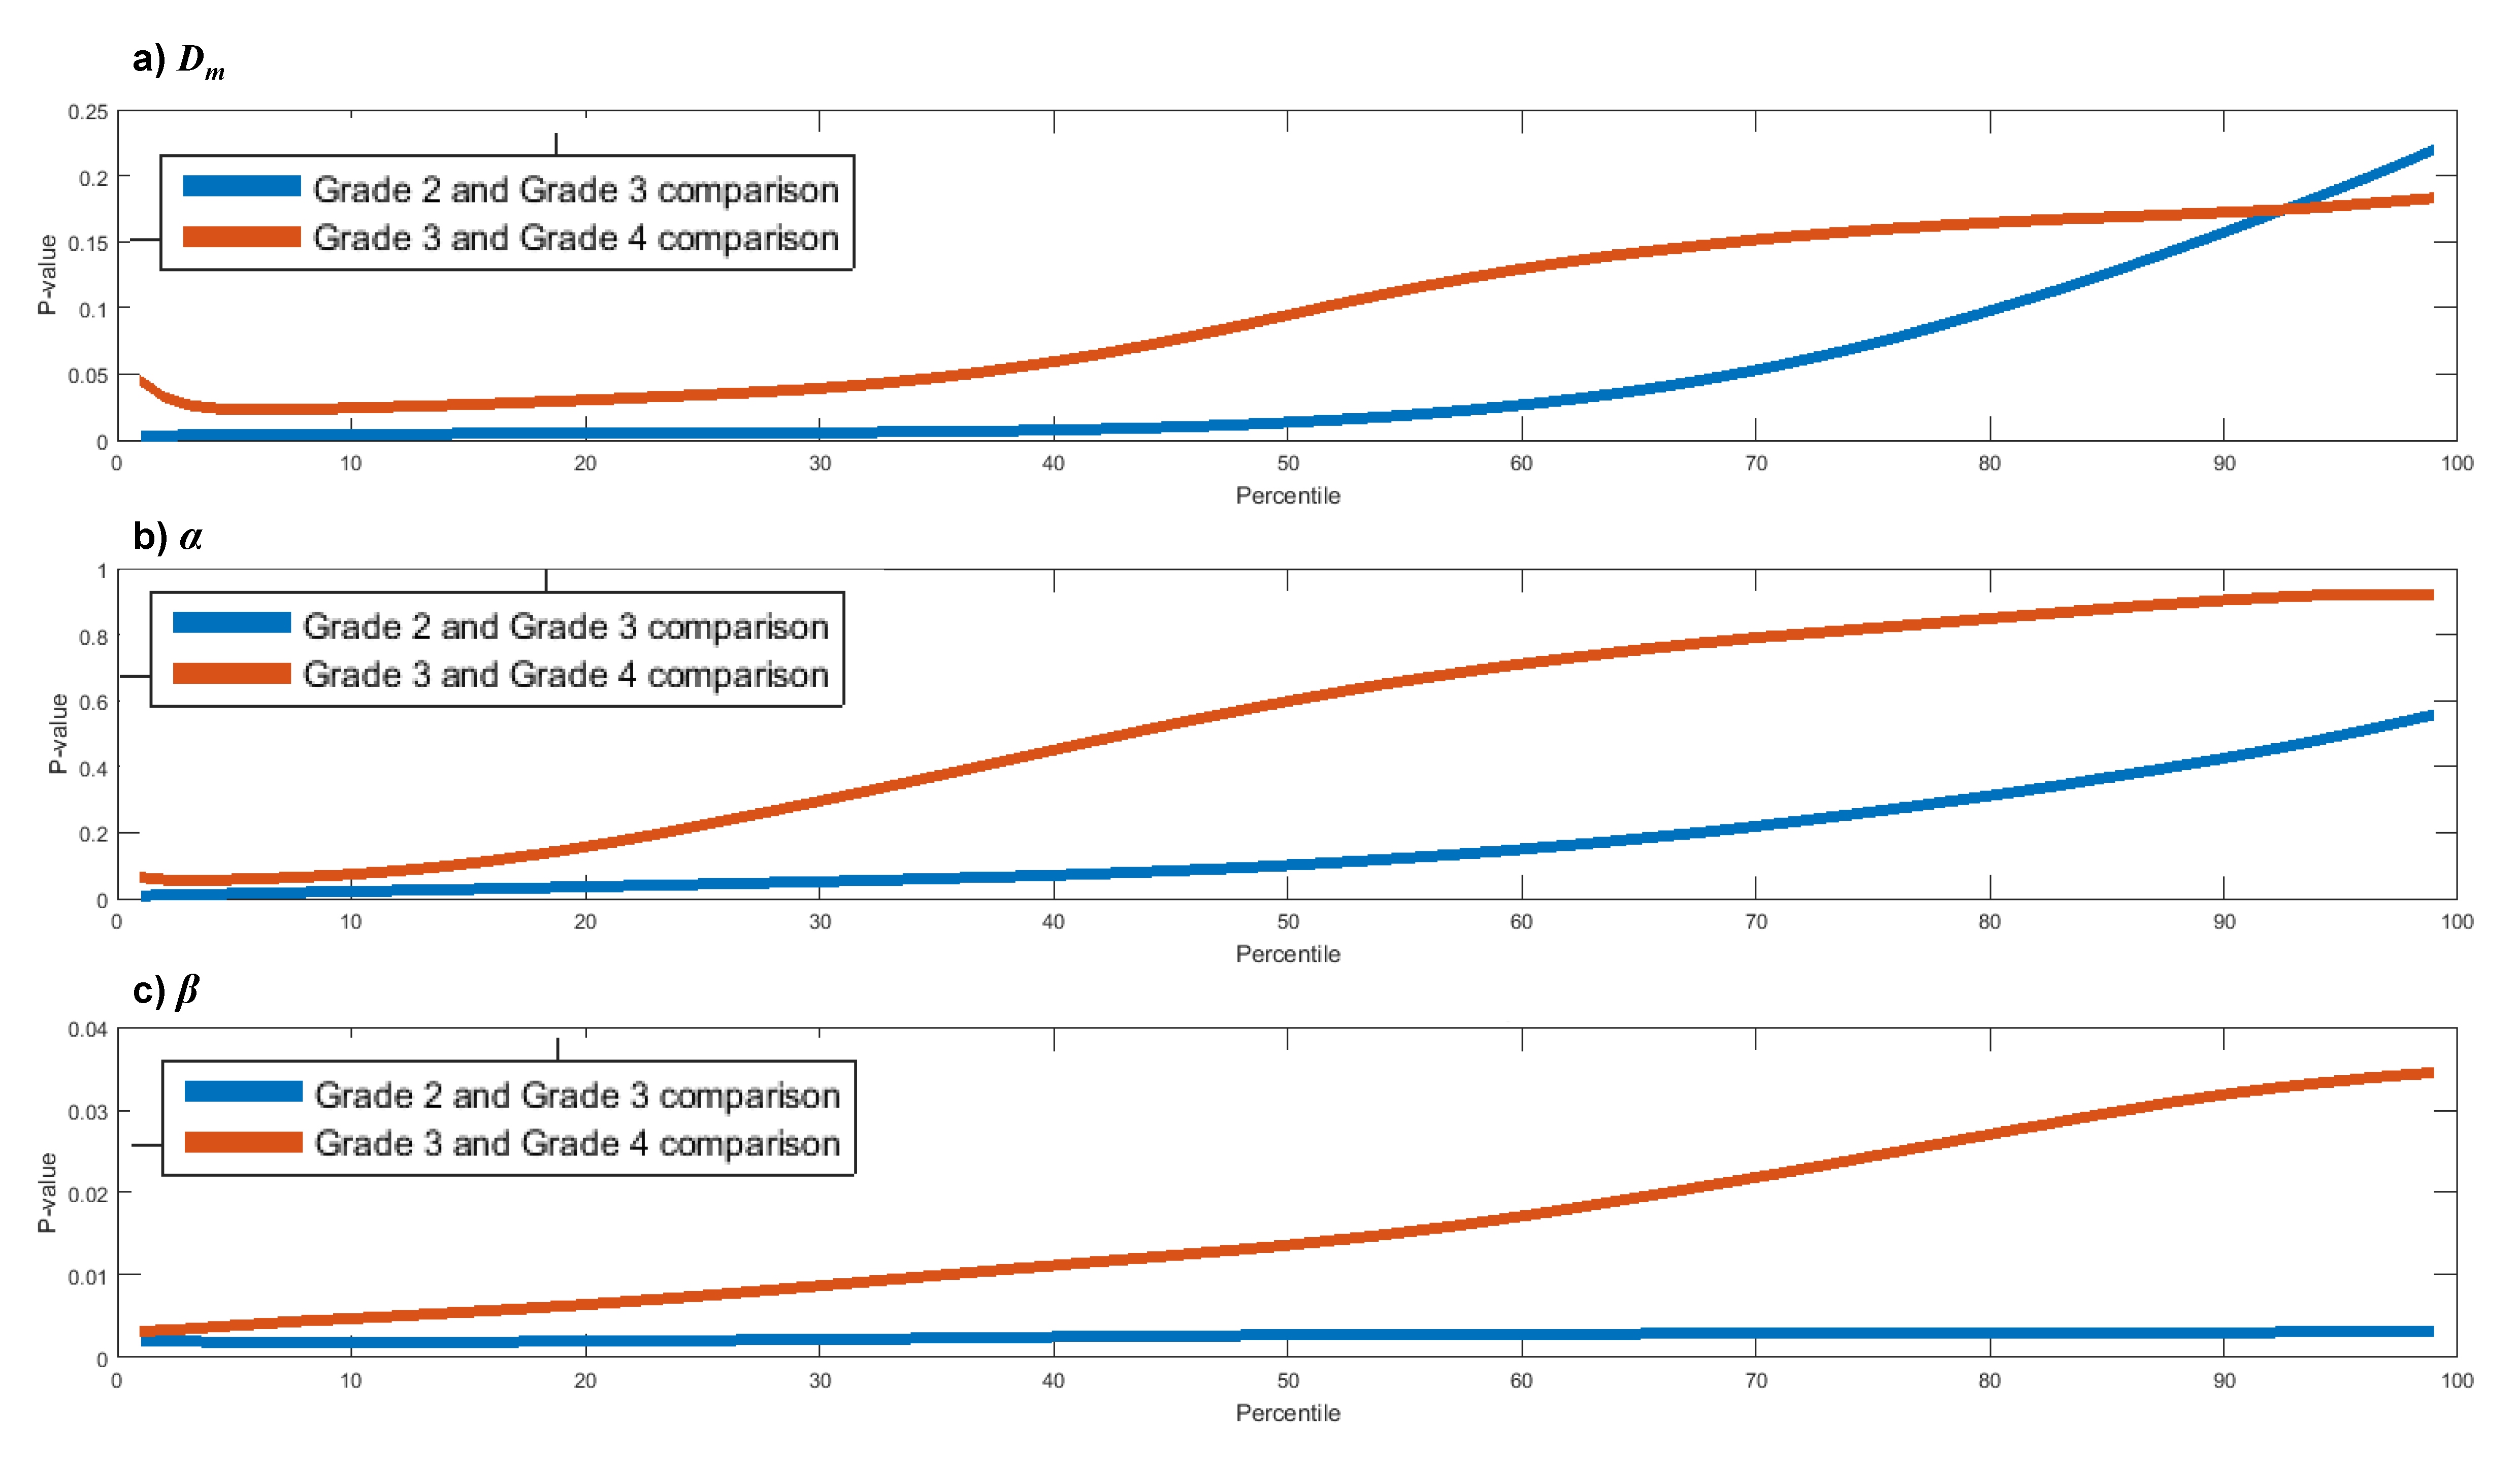
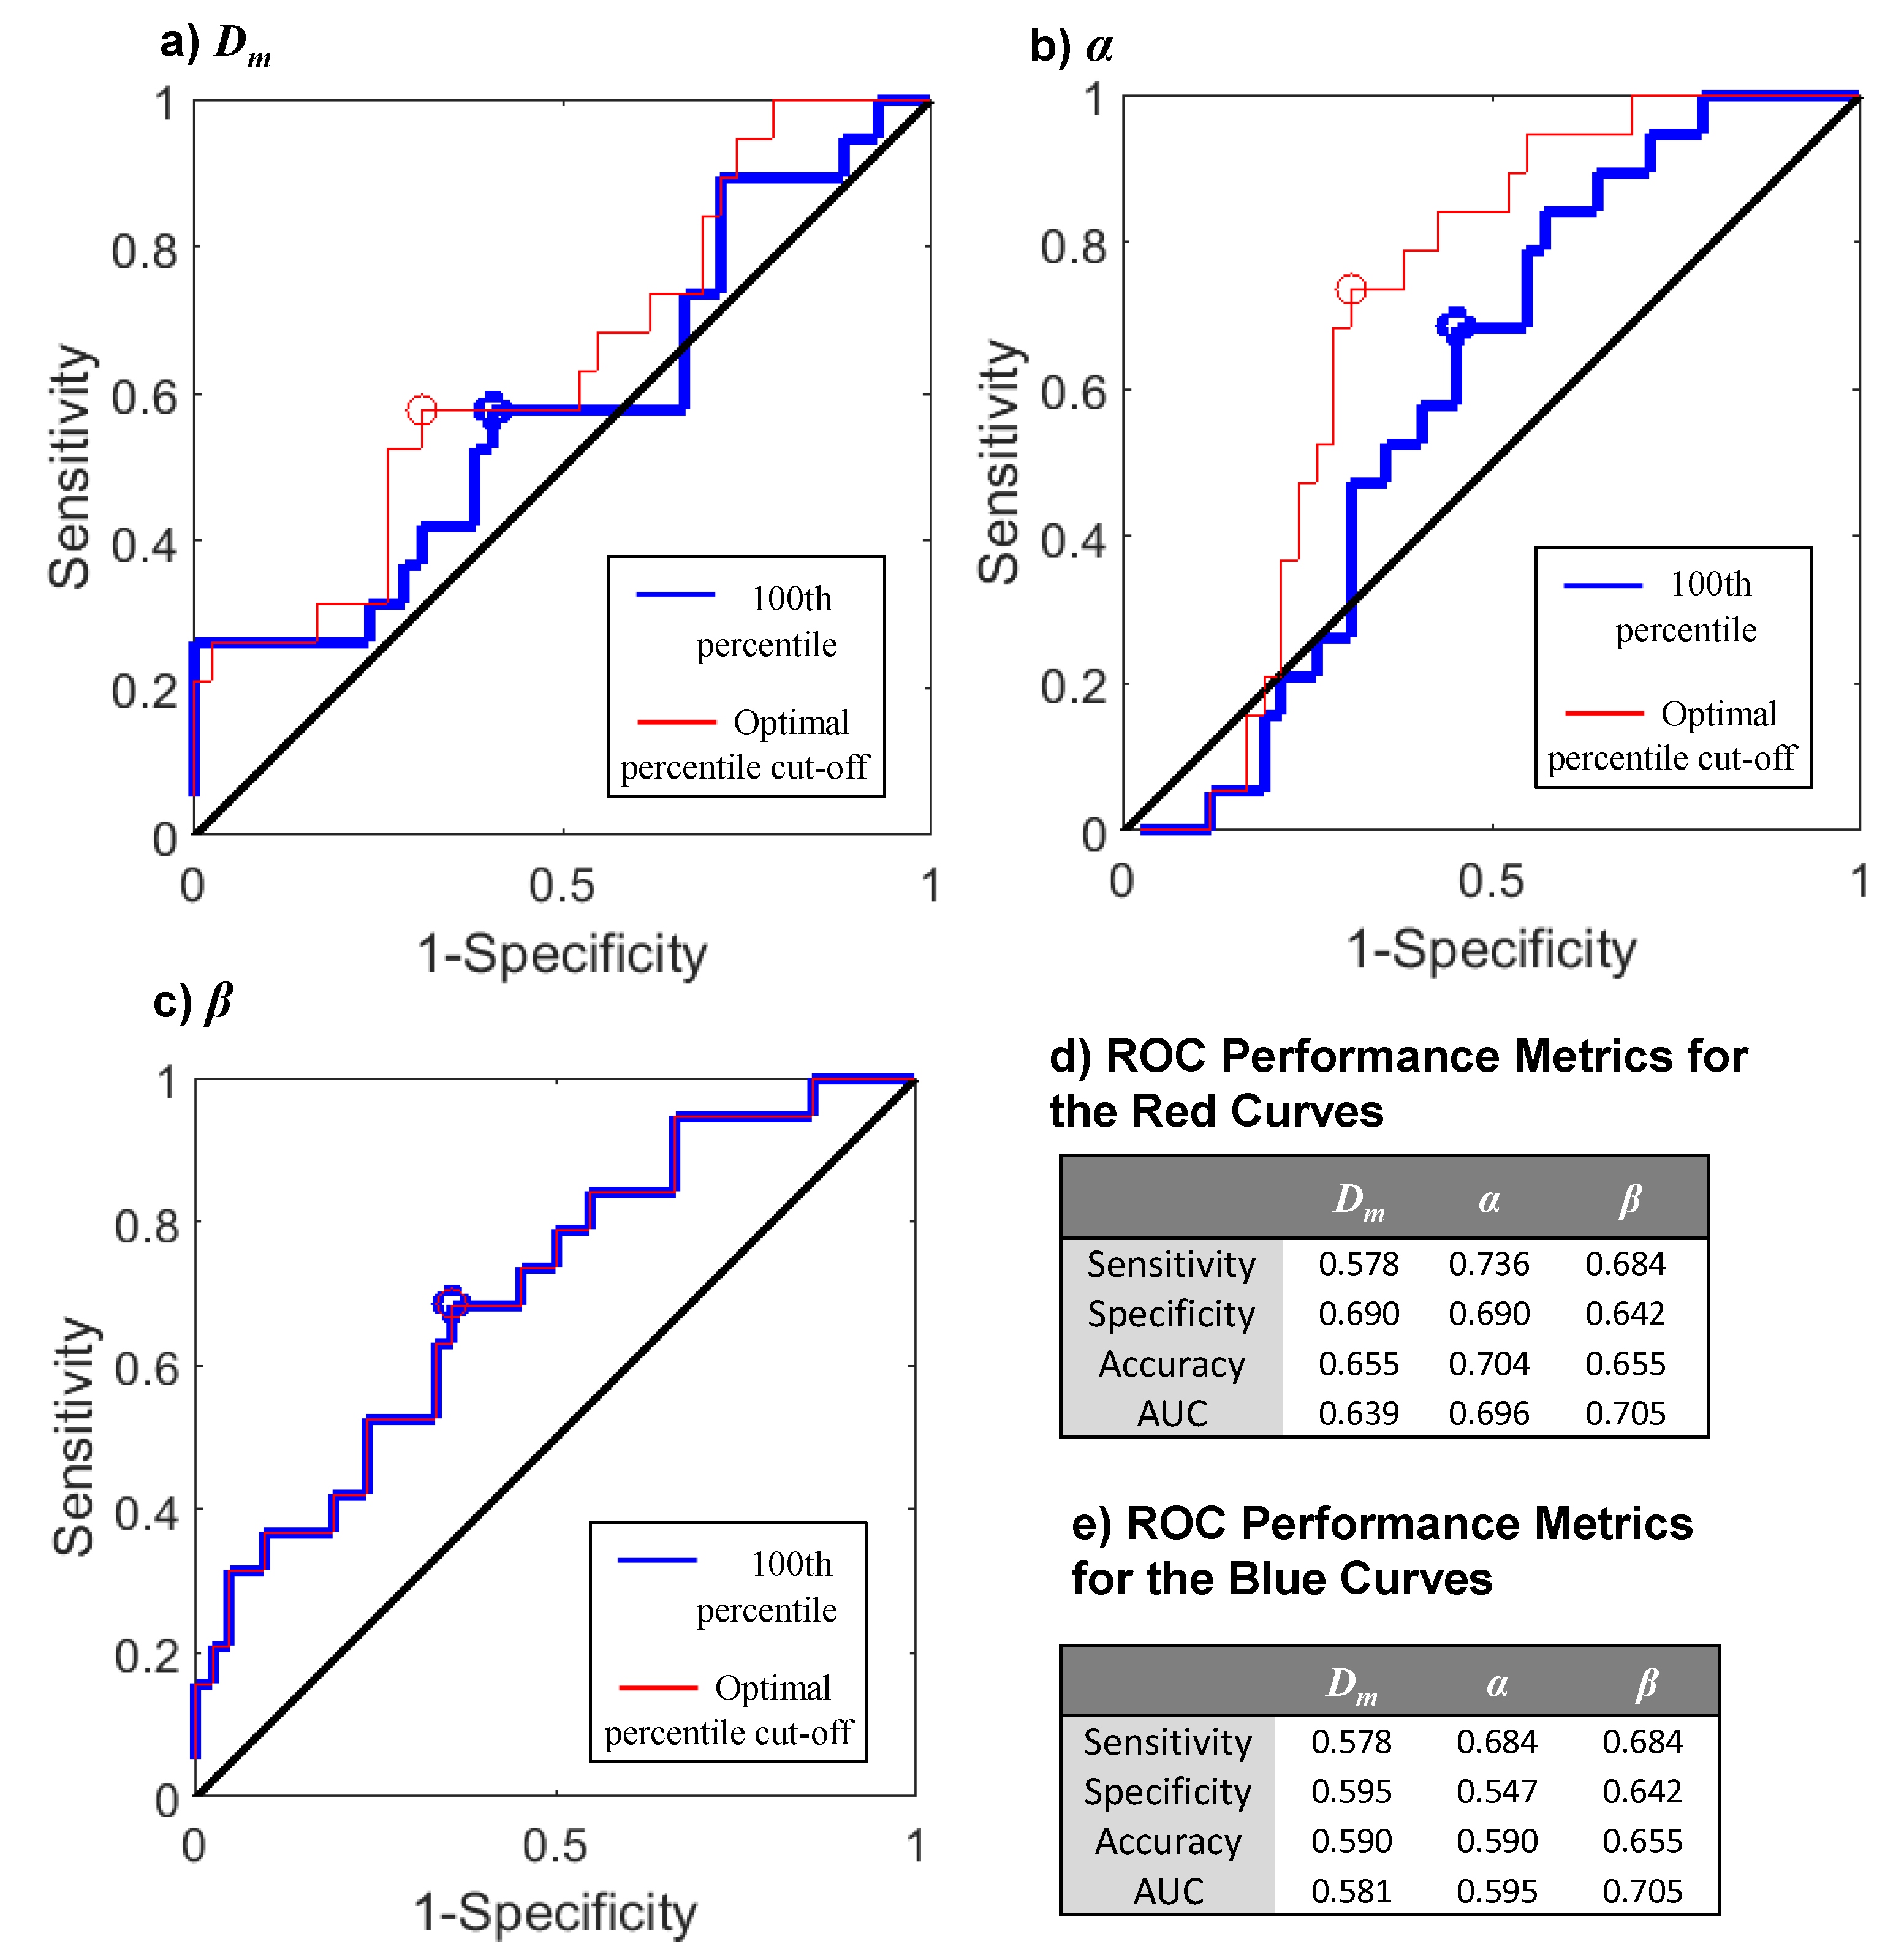
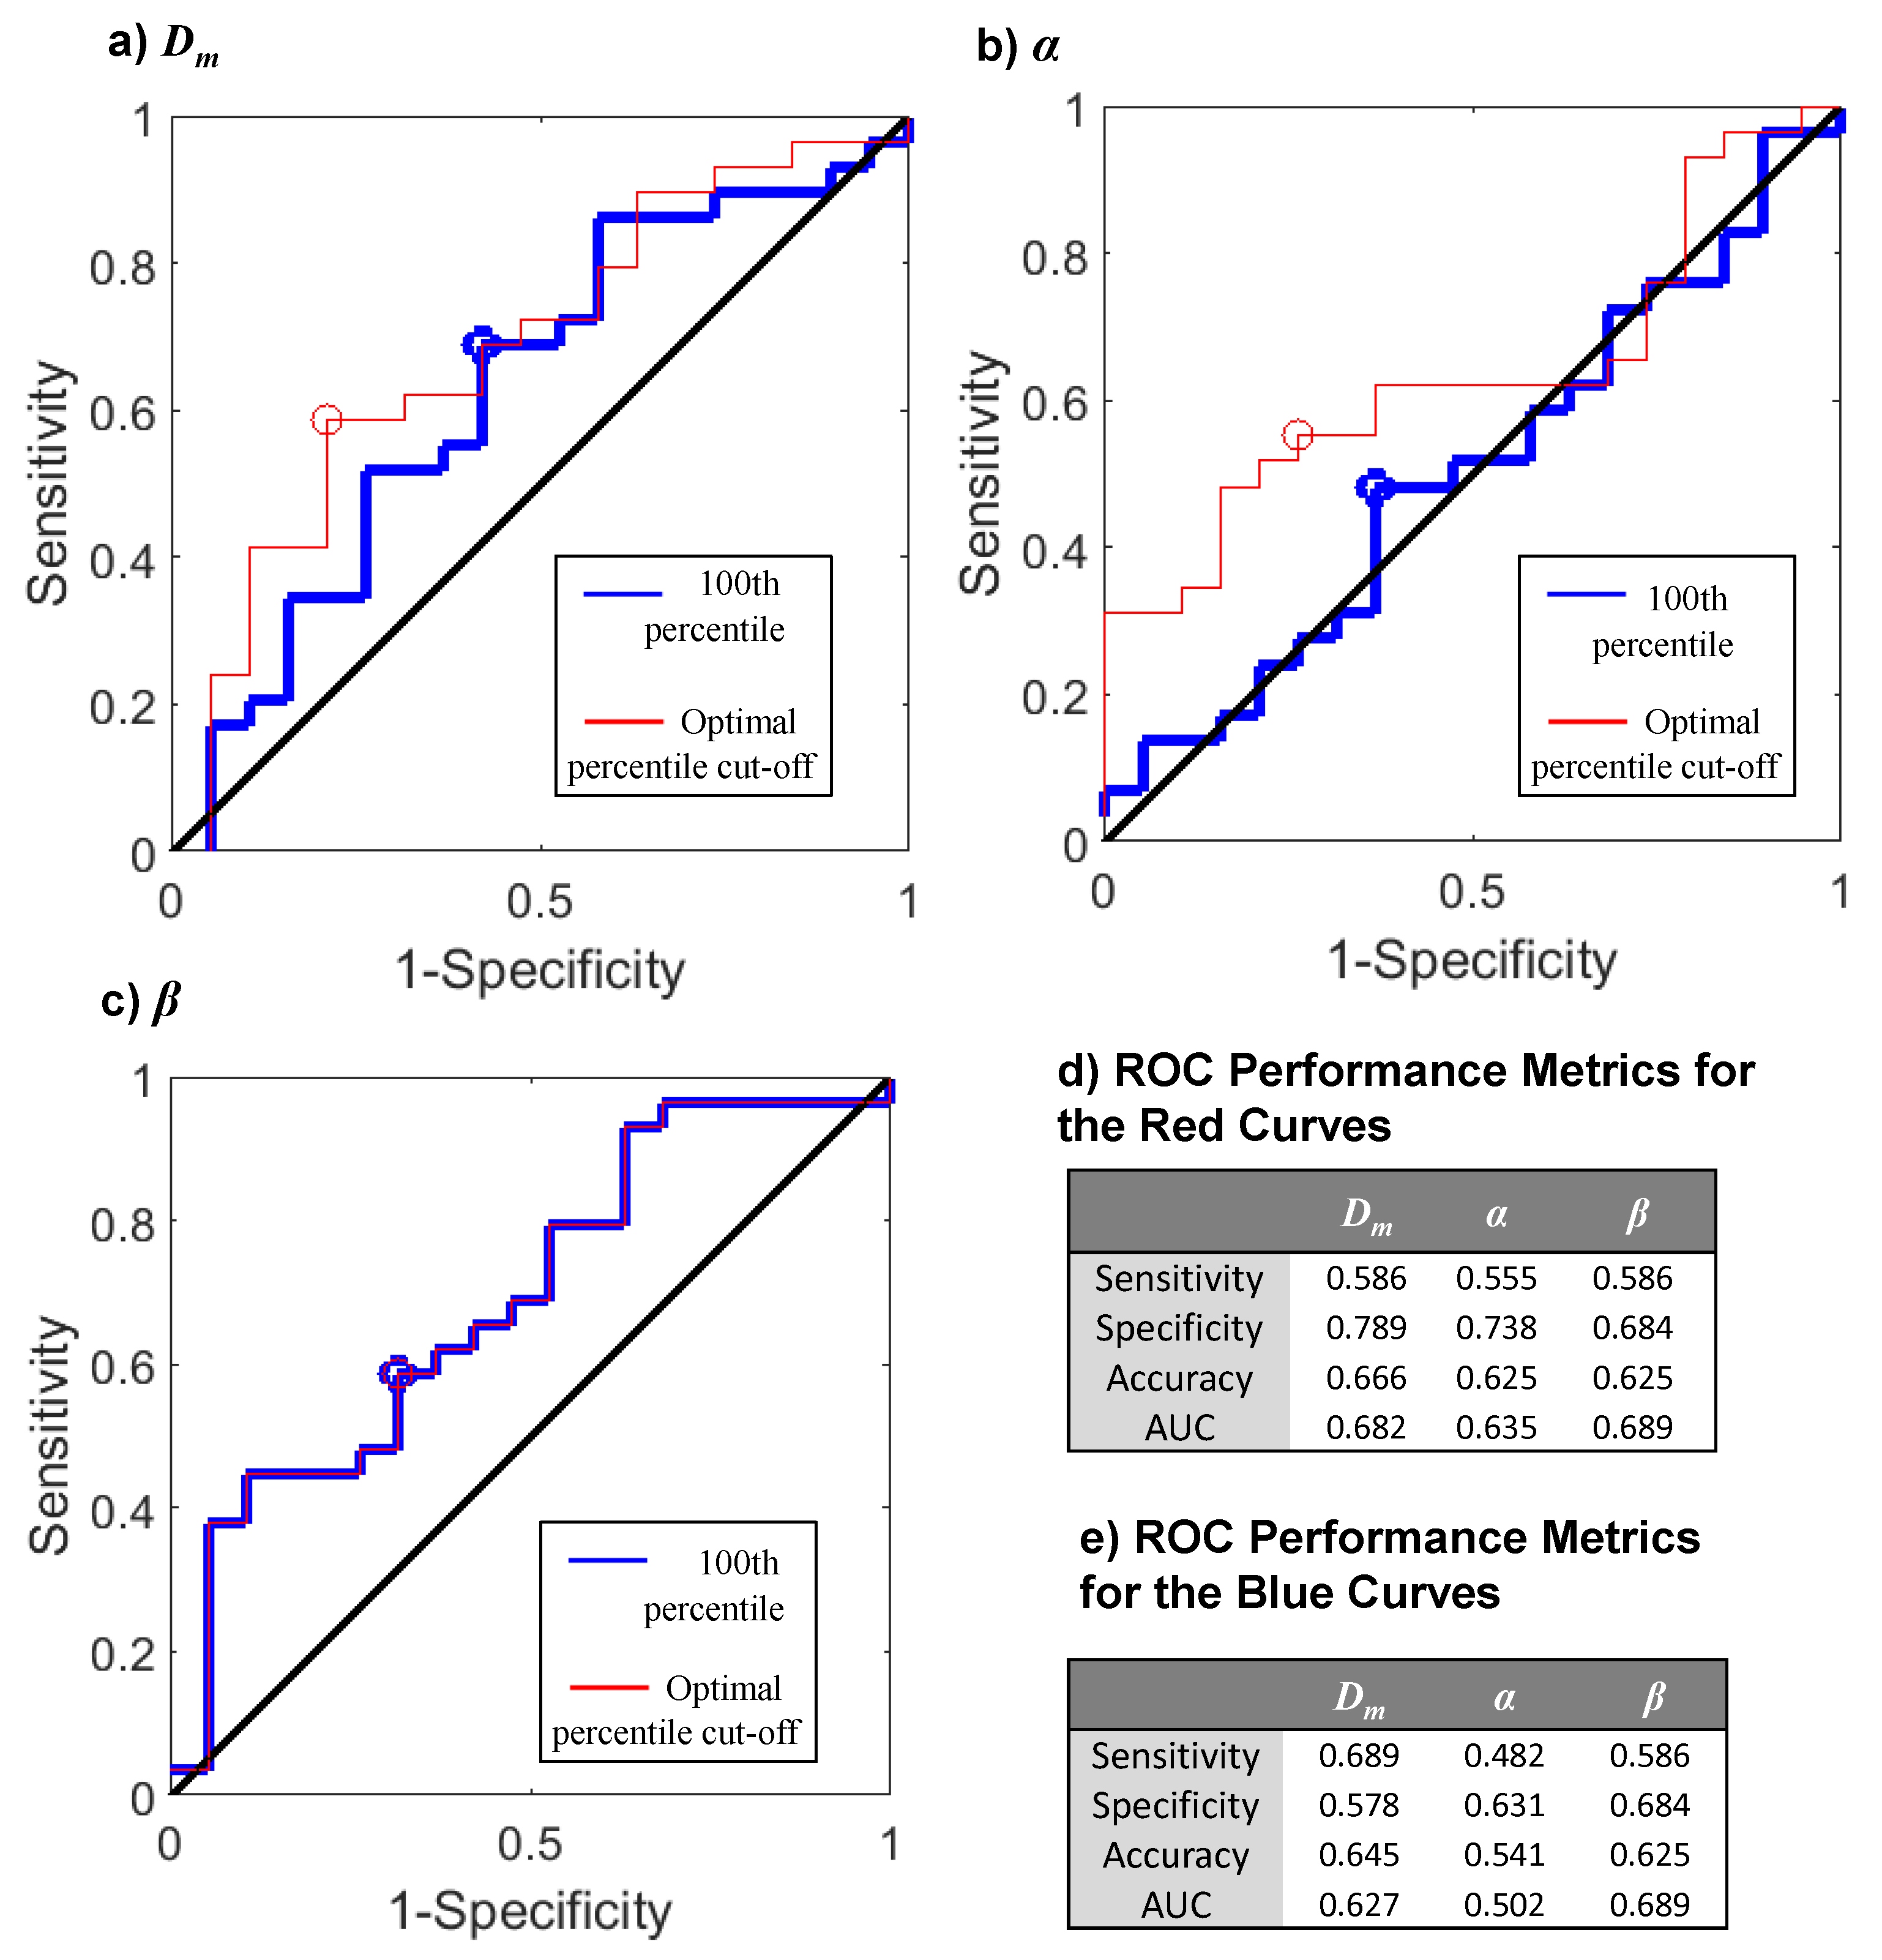
Figure 1 shows Dm, α, and β maps from one representative patient in each of the grade II, III, and IV groups. The CTRW parameter values in the tumor ROIs decreased progressively as the tumor grade increased. Figures 2a-2c show the plots of p-value versus percentile for Dm, α, and β, respectively, for the comparisons of grade II&III (blue) and grade III&IV (in red). The percentile cut-off for Dm was determined as 69% and 36% for grade II&III and grade III&IV comparison, respectively. The α-based p-values were never below 0.05 for grade III&IV differentiation, but were statistically significant up to the 29th percentile for grade II&III separation. For β, p-values were <0.05 at all percentiles investigated for both differentiations. Figure 3 shows that the sensitivity, specificity, accuracy, and area-under-the-curve (AUC), for the separation between grades II and III were always better using the optimized percentile cut-off as opposed to the 100th percentile. Overall, β had the best AUC (0.705), and α had the best accuracy (0.704), sensitivity (0.736), and specificity (0.690). For differentiating between grades III and IV, the results were similar, with every metric improving or staying the same when using the optimized percentile cut-off versus the 100th percentile.Discussion and Conclusion:
In this study, we determined an optimal percentile cut-off for calculating the mean CTRW model parameters to differentiate different glioma grades. Our ROC analysis showed that parameter-specific percentile cut-offs yielded better performance than using the conventional 100th percentile in ROI-based analysis. The proposed approach improves the scientific rigor and provides a systematic way to statistically determine a cut-off in ROI-based percentile analysis of diffusion MRI parameters. By minimizing the subjectivity in manual ROI selection and disadvantages of averaging over a heterogenous region, the technique presented herein can be expanded into other areas of cancer imaging that utilize quantitative diffusion parameter as a marker.Acknowledgements
No acknowledgement found.References
- Tang L. and Zhou XJ. Diffusion MRI of cancer: From low to high b-values. J Magn Reson Imaging 2018, online early view; PMID:30311988.
- Just N. Improving tumour heterogeneity MRI assessment with histograms. Br J Cancer. 2014; 111(12):2205-13.
- Padhani A, Liu G, Mu-Koh D, et al. Diffusion-weighted magnetic resonance imaging as a cancer biomarker: Consensus and recommendations. Neoplasia. 2009; 11(2):102-125.
- Kang Y, Choi SH, Kim YH, et al. Histogram analysis of apparent diffusion coefficient maps with standard- or high-b-value diffusion-weighted MR imaging - Correlation with tumor grade. Radiology. 2001; 261(3):882-890.
- Karaman MM, Sui Y, Wang H, et al. Differentiating low- and high-grade pediatric brain tumors using a continuous-time random-walk diffusion model at high b-values. Magn Reson Med. 2015; 76:1149-1157.
Figures