2911
Crossover intraindividual comparison of ionic and non-ionic macrocyclic gadollinium based contrast media in orthotopic glioblastoma model: Pathologic correlation of dynamic contrast enhancement characteristics at 9.4T MRI1Radiology, Chungbuk University Hospital, Cheongju-si, Korea, Republic of, 2Radiology, Chungbuk National University College of Medicine and Medical Research Institute, Cheongju-si, Korea, Republic of, 3Division of Magnetic Resonance Research, Korea Basic Science Institute, Cheongju-si, Korea, Republic of
Synopsis
The DCE parameters including Ktrans and Ve have been used to assess glioblastoma treatment responses reflecting tumor cellularity and tumor vasculature. We hypothesized that the enhancement pattern of the ionic macrocyclic contrast agent used in glioblastoma DCE study, which interacts with the negative charge on the surface of the tumor cell, was different from that of the nonionic one. We demonstrated it with prospective DCE experiments using the orthotopic glioblastoma models as well as Ktrans and Ve from ionic were more correlated with tumor pathology than nonionic. These findings may aid clinical choice of GBCA in DCE-MRI study.
Indoduction
Dynamic contrast enhancement (DCE) patterns of DCE-MRI depending on chelate ionicity of macrocyclic gadolinium-based contrast agents (GBCA) are expected to be different in brain glioblastoma. This experiment aimed to intra-individually compare the ionic and non-ionic macrocyclic GBCAs in orthotopic human glioblastoma model with DCE-MRI.Methods
The orthotopic human glioblastoma model was established stereotactically (U373-MG, 1 x 10⁶ cells) in 92 nude mice (BALB/c nude, female, 18~20g). DCE-MRI (9.4-T, Varian Inc., Palo Alto, CA) scans were performed in 8~13 days tumor incubation period. The crossover DCE-MRI scans (T1W-GRE sequence, TR/TE = 160.0/2.5msec, flip angle = 30o, 30 dynamic, every 1 minute up to 30) were performed with two different macrocyclic GBCAs 6 hours apart in 65 mice (ionic; Gd-DOTA; Dotarem; Guerbet, Roissy CdG, Cedex, France: n=41, non-ionic:Gd-DO3A-butriol; Gadovist; Bayer Healthcare, Leverkusen, Germany: n=44) including crossover set (n=20). DCE-parametrical maps by model free and pharmacokinetic model (TOFT by Nordic) were compared. Ktrans and Ve maps were compared with Ki67 proliferation index (Ki67index) on Ki67 stain and microvessel counts (MVC) on CD31 voxel-wisely.Results
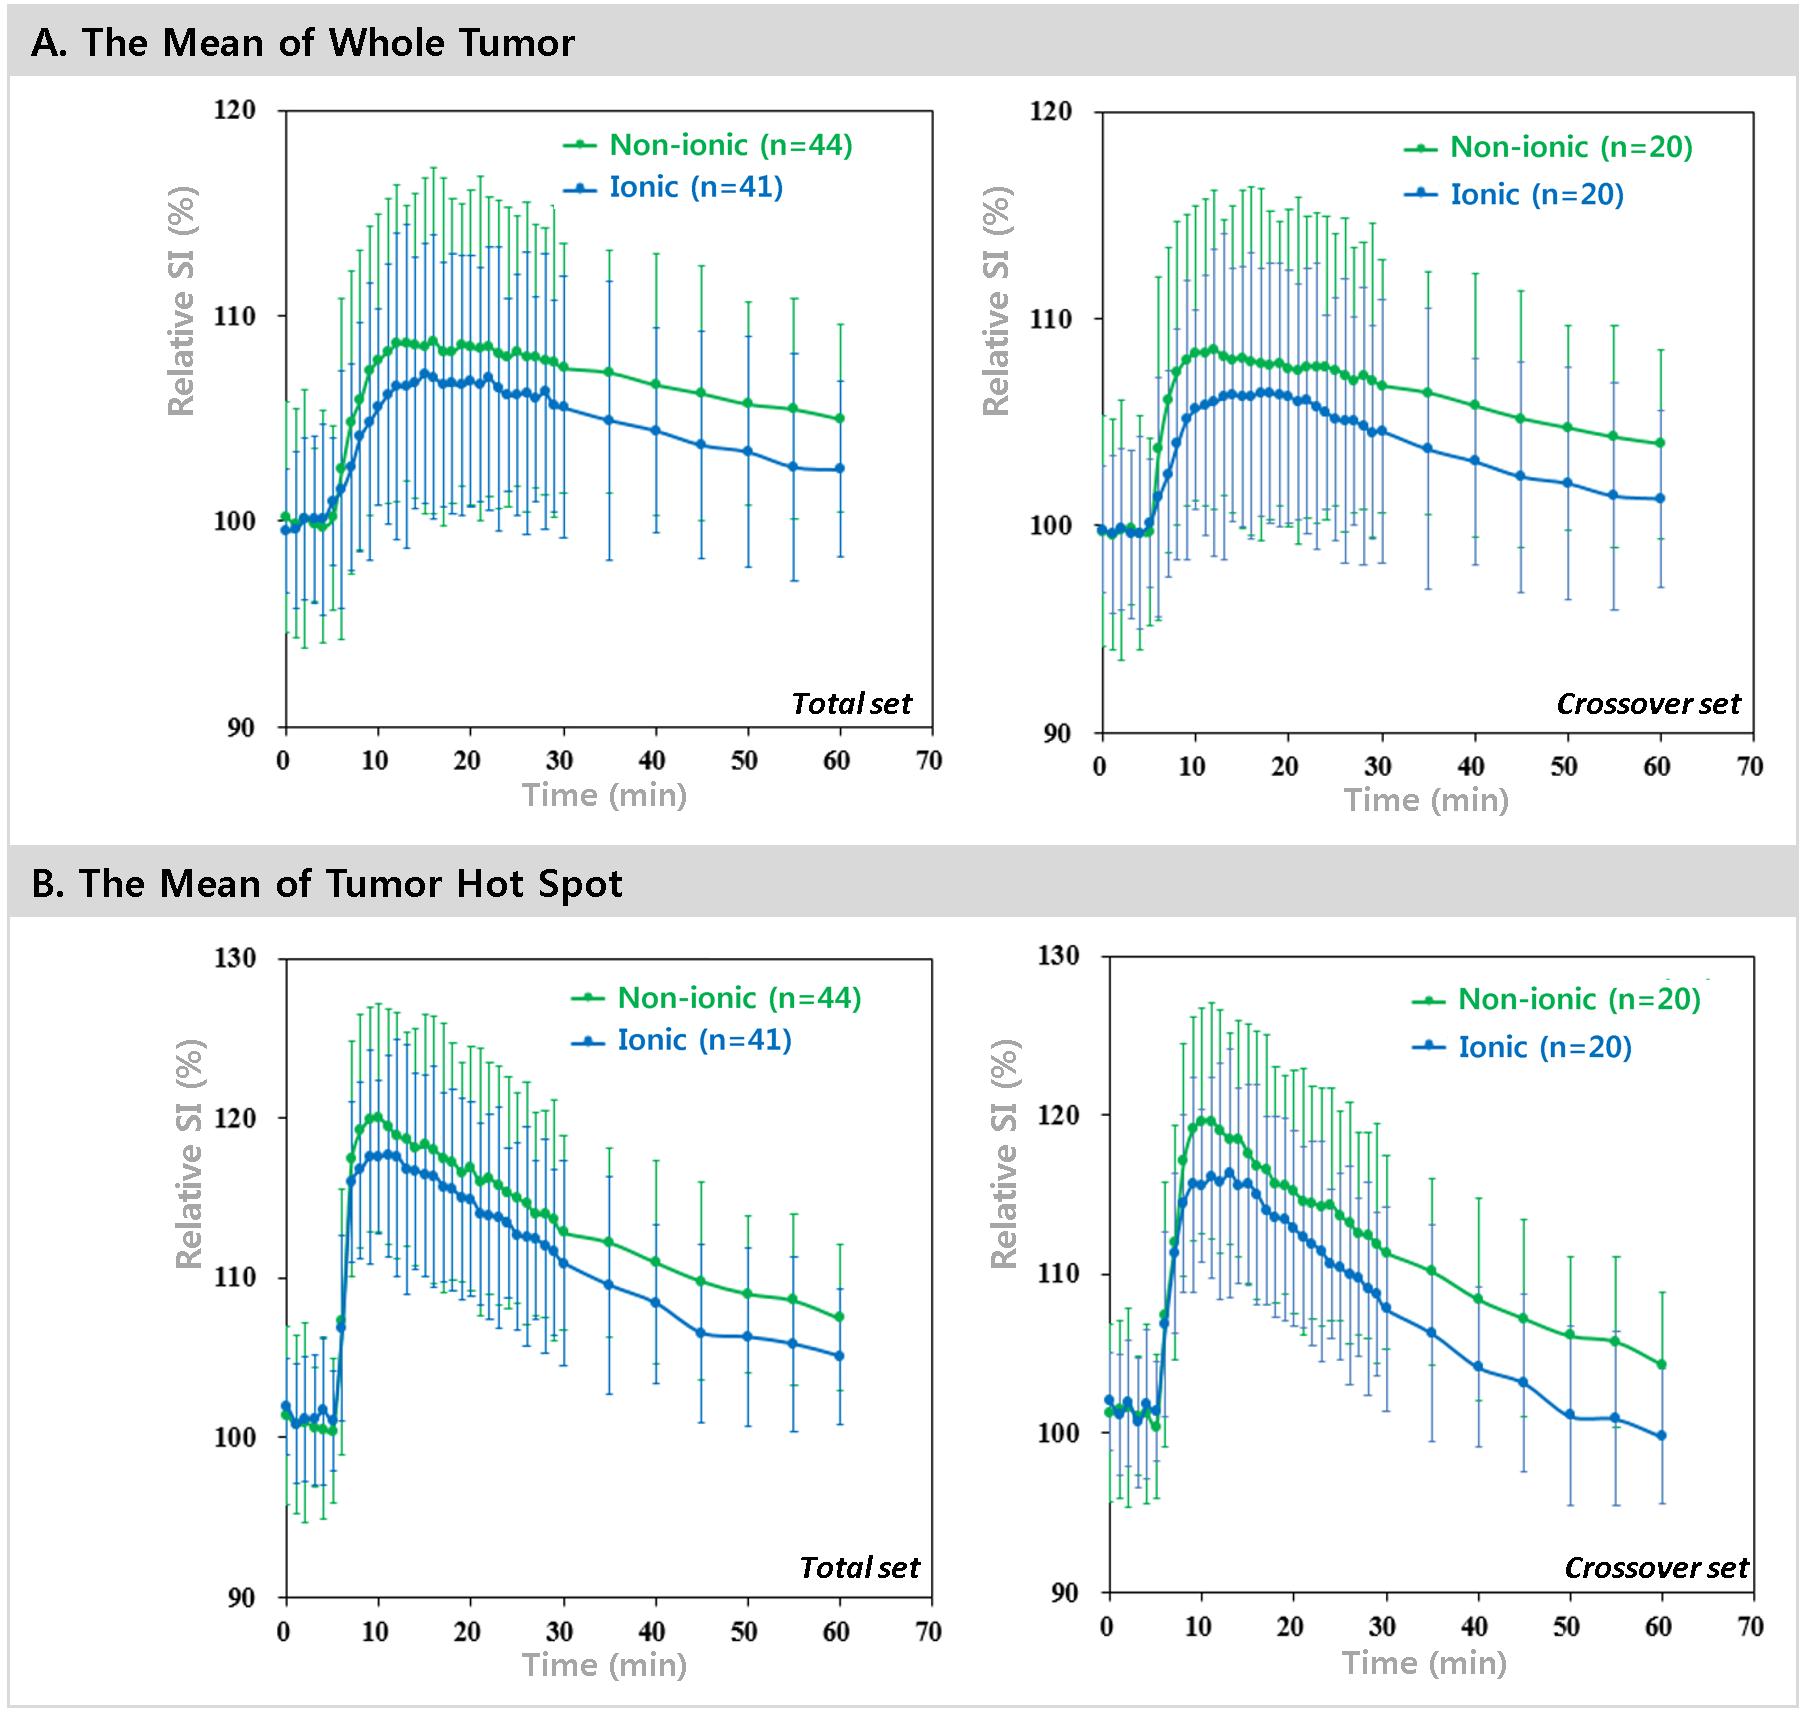
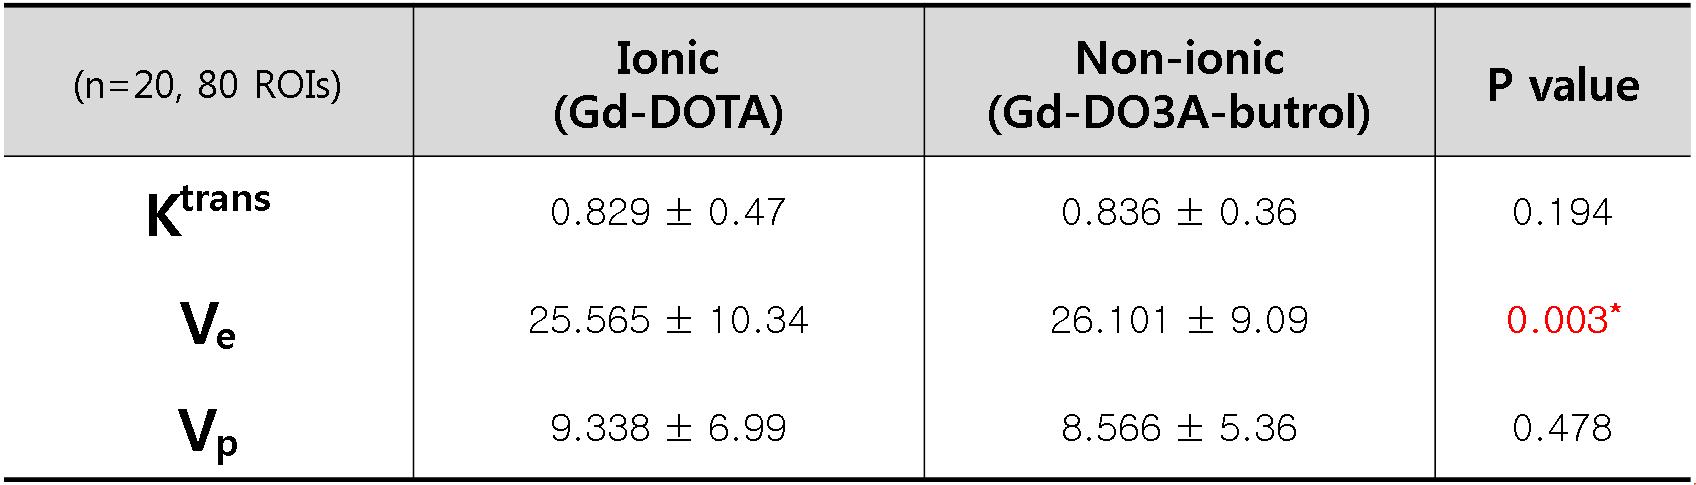
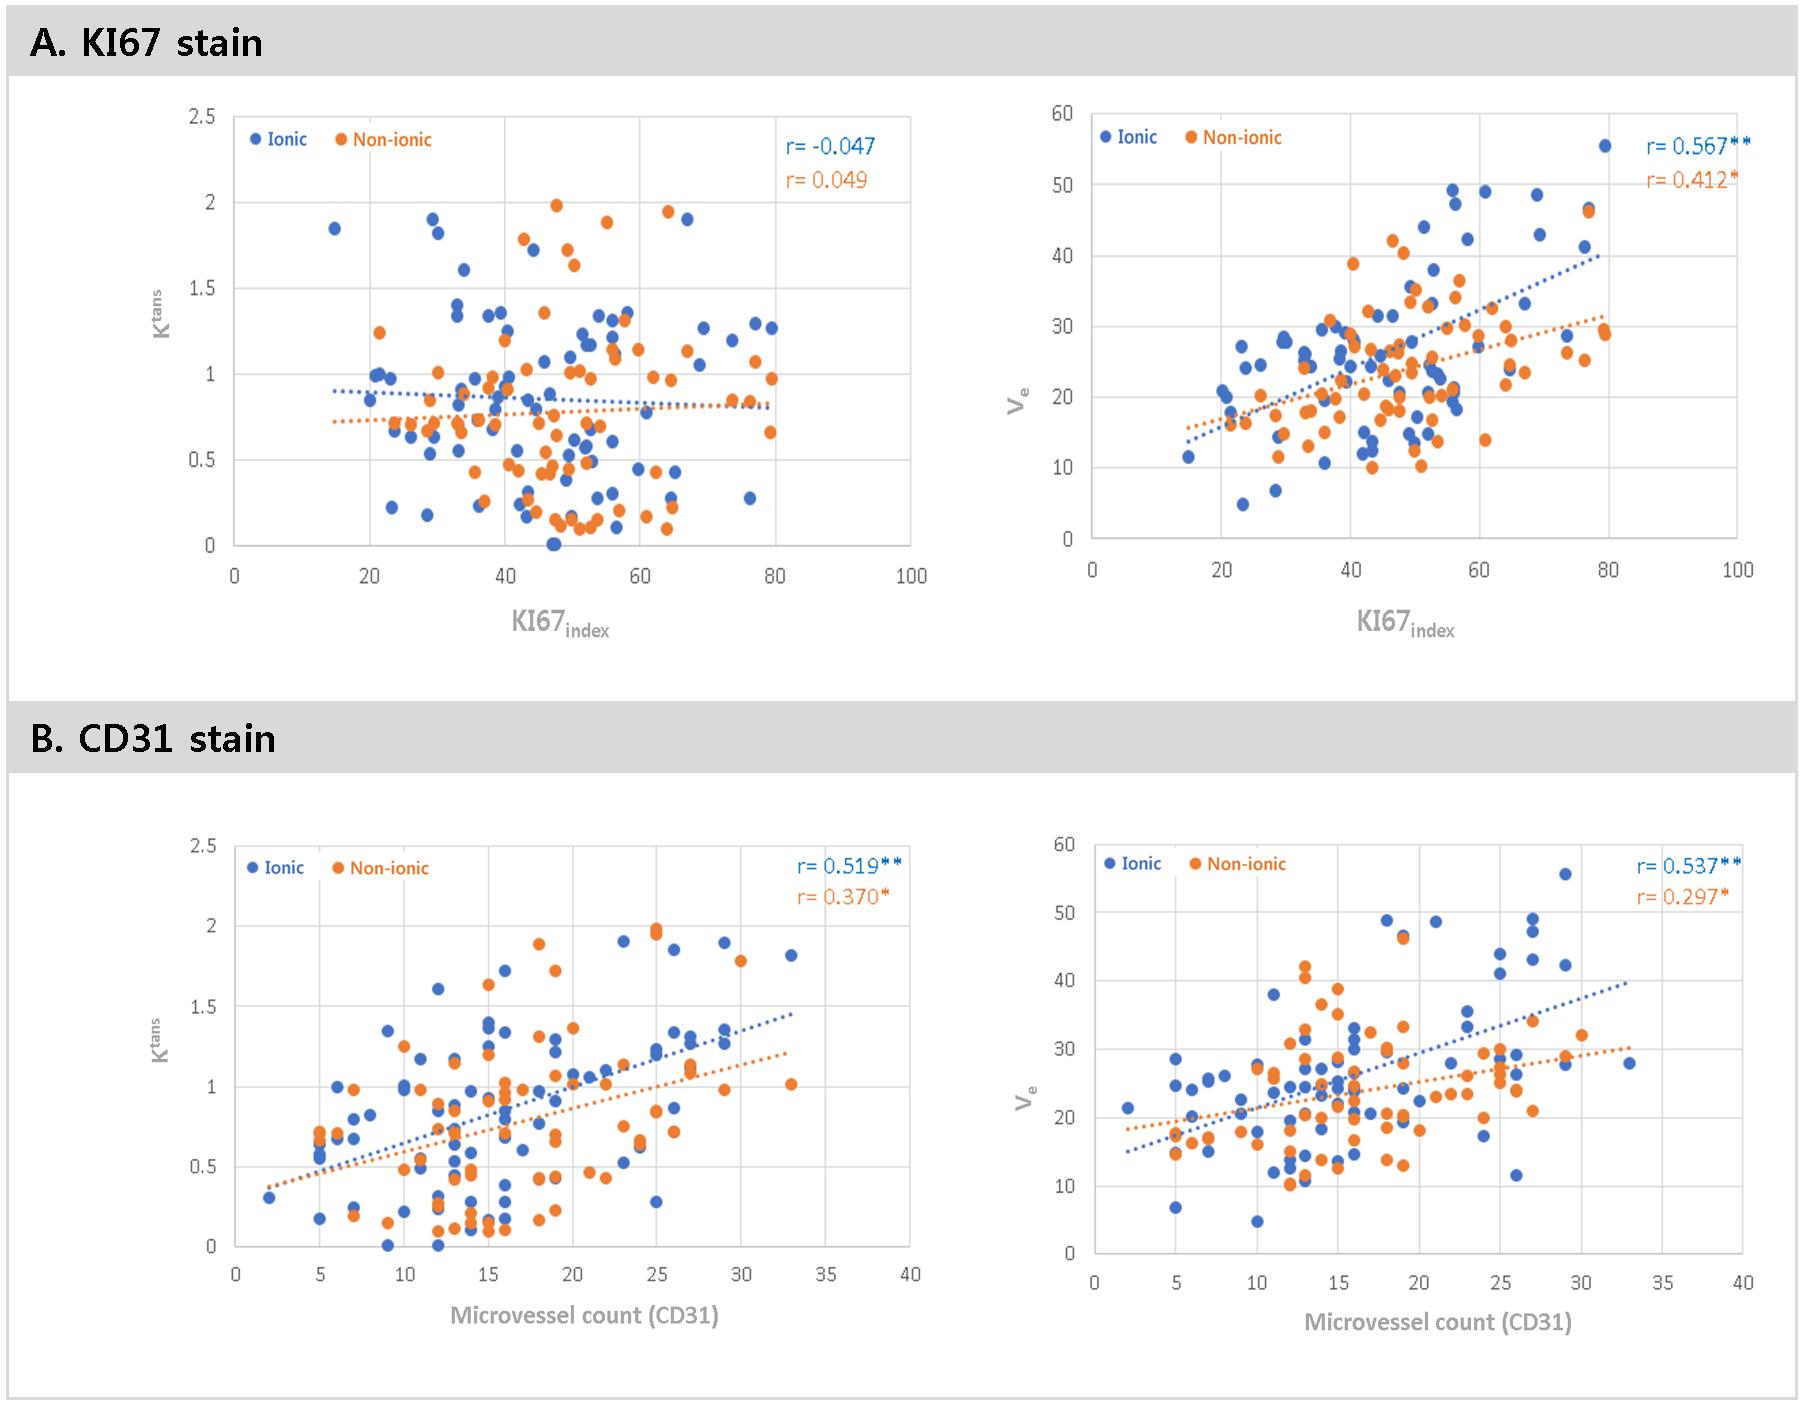
Time intensity curves were different depending upon the ionicity of GBCA. The mean relative SI of tumor were washed-in slowly reached high in a short period of time, and washed-out rapidly in ionic GBCA both of total set (p < 0.001) and crossover set (p < 0.001) (figure 1). The Ve of ionic was small significantly by voxel wise comparison in 20 crossover set (p < 0.01) (table 1). Ki67index was more correlated with Ve of ionic GBCA (p<0.01). MVC was also more correlated with Ktrans and Ve of ionic GBCA (p<0.01) (figure 2).Discussion
The gradual rise and decreased rapidly in ionic GBCA and the rapid and higher initial peak of nonionic have been also replicated in previous study.1 It might be the approximately 1.5-fold higher T1 relaxivity of nonionic GBCA in addition to the doubled Gd concentration per unit volume. Ionic decreased rapidly after signal peak might be chealate negative charge. In general, the negative charge of chealate is interfered by the negative charge of the tumor endothelial cell surface, and the negative changes at tumor cell matrix also pushed the ionic CA out to the vascular space.1,2 This was replicated successfully in our prospective study using orthotopic human GBM model. Ktrans and Ve maps from ionic GBCA was more correlated with Ki67index and MVC. It is possible that higher relaxivity and extracellular space accumulation in non-ionic GBCA can overestimate tumor vascular permeability. Our comparisons suggest that ionic GBCA in DCE-MRI are more advantageous in pathologic correlation, and it is the first report as far as we know. Non-ionic GBCA rapid rise and persistent in time intensity curve and the higher T1-relaxivity can cause higher SNR, CNR, and larger tumor volume. At the initial diagnosis, these characteristics may be beneficial, however the recent clinical trial showed ionic GBCA was not inferior than the other clinically.3 Because the main role of DCE-MRI is the predictor of tumor recurrence or pseudo-progression following chemotherapy or radiation treatment, we suggest that the choice of ionic GBCA in DCE-MRI may be more advantageous in accurate pathologic correlation. It can be used clinically for the early glioblastoma recurrence, the determination of the biopsy location, and the target therapy.Conclusion
DCE patterns of ionic macrocyclic GBCA were different in glioblastoma DCE MRI and reflected tumor pathology more than nonionic one. This suggests possible advantage of ionic GBCA in characterizing globlastoma in patients in DCE-MRI studyAcknowledgements
No acknowledgement found.References
1. Renz DM, Diekmann F, Schmitzberger FF, et al. Pharmacokinetic approach for dynamic breast MRI to indicate signal intensity time curves of benign and malignant lesions by using the tumor flow residence time. Investigative radiology 2012;48:69-78.
2. Chen B, Le W, Wang Y, et al. Targeting Negative Surface Charges of Cancer Cells by Multifunctional Nanoprobes. Theranostics 2016;6:1887-1898.
3. Maravilla, K. R., San-Juan, D., Kim, S. J., et al. Comparison of Gadoterate Meglumine and Gadobutrol in the MRI Diagnosis of Primary Brain Tumors: A Double-Blind Randomized Controlled Intraindividual Crossover Study (the REMIND Study). American Journal of Neuroradiology. 2017;38(9):1681-1688
Figures