2910
Detection of Tumor Progression in Patients with Glioblastoma using Multiparametric MRI1Radiology, Perelman School of Medicine at the University of Pennsylvania, Philadelphia, PA, United States, 2Medical Data Research Center, Providence Health & Services, Portland, OR, United States, 3Pathology and Laboratory Medicine, Perelman School of Medicine at the University of Pennsylvania, Philadelphia, PA, United States, 4Hematology-Oncology, Perelman School of Medicine at the University of Pennsylvania, Philadelphia, PA, United States, 5Neurosurgery, Perelman School of Medicine at the University of Pennsylvania, Philadelphia, PA, United States, 6Cellular and Molecular Physiology, University of Liverpool, Liverpool, United Kingdom
Synopsis
The study was performed to determine whether progression probabilities (PP) from DTI and DSC parameters can aid in differentiating glioblastomas with true-progression (TP) from pseudo-progression (PsP). MRI data from thirty-nine patients were included. All patients underwent at least two MR scans before pathological confirmation. TP patients tended to have high baseline PP values compared with PsP patients. An increase of PP of more than 25% at follow-up scans was noted in 12/15 TP patients, whereas stable or decreased PP were observed in 21/24 PsP patients. These results indicate that monitoring changes in PP values may aid in identifying TP.
PURPOSE
Early detection
of tumor progression is critical in patients with glioblastoma as these
patients can either be enrolled in novel clinical trials or undergo repeat
surgery in comparison to patients exhibiting pseudo-progression (PsP), who can continue
conservative management. However, in the absence of a true predictor, routine
follow-up with MRI is recommended until the patient shows clinical
deterioration or develops a marked increase in tumor volume, which can
substantially delay clinical management and affect survival. DTI and DSC have
been shown to be helpful in differentiating PsP from TP 1-3. We have
previously demonstrated that a combination of FA, linear anisotropy (CL) and maximum
rCBV was the best model in differentiating PsP from TP with high accuracy. This
model was used in assessment of treatment response to CAR-T therapy in
glioblastoma patients4. In the present study, these three parameters
were used to determine progression probabilities (PP) at each imaging time
point to evaluate whether PP values at baseline and follow-up can better detect
TP.METHODS
Thirty-nine glioblastoma patients (17M/12F, age 24-78) exhibiting new enhancing lesions within six months after TMZ and radiotherapy were included. All patients underwent at least two MR scans. Most patients underwent repeat surgery after the second MRI. Pathological evaluation of the surgical tissue categorized patients as PsP (n=15) with <75% of tissue exhibiting malignant features and TP (n=13) with >75% recurrent tumor. Additionally, 9 patients demonstrated decreased contrast enhancement at ≥ 2 consecutive follow-up MRI and were thus classified as PsP. 2 patients demonstrated increased contrast enhancement at follow-up MRI and were grouped as TP. All MRI studies were performed on a 3T scanner with a 12-channel phased-array head coil. DTI data were acquired using a single shot spin echo EPI sequence with parallel imaging using GRAPPA; TR/TE = 5000/86 ms, NEX = 3, FOV = 22 × 22 cm2, b = 1000 s/mm2, number of diffusion weighting directions = 30, in-plane resolution = 1.72 × 1.72 × 3 mm3. DSC T2* weighted gradient-echo echo planar images were obtained using the following parameters: TR/TE = 2000/45 ms, FOV = 22 × 22 cm2, in-plane resolution = 1.72 × 1.72 × 3 mm3, and 20 slices covering the brain. DTI maps including MD, FA, CL, CP and CS maps were computed using in house software. Leakage corrected CBV maps were generated using Nordic ICE (Nordic Imaging Lab). Contrast-enhanced T1 weighted images, FLAIR, CBV and DTI maps were co-registered and a semi-automated segmentation routine was used to segment the contrast-enhancing ROI1. The median MD, FA, CL, CP CS and rCBV values from this ROI were used to analyze the data. The progression probabilities (PP) were computed for each patient at each time point using the following regression equation1
f(FA,CL,rCBVmax)=1/1+exp(−(β0+β1FA+β2CL+β3rCBVmax))
where β0 = -16.17, β1 = 194.01, β2 = -285.65, and β3 = 1.21. Lesions were considered TP if the predictive PP was ≥ 50% and PsP if predictive PP was ≤ 50%4.
RESULTS
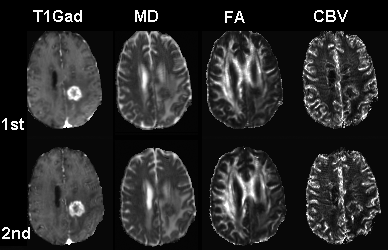
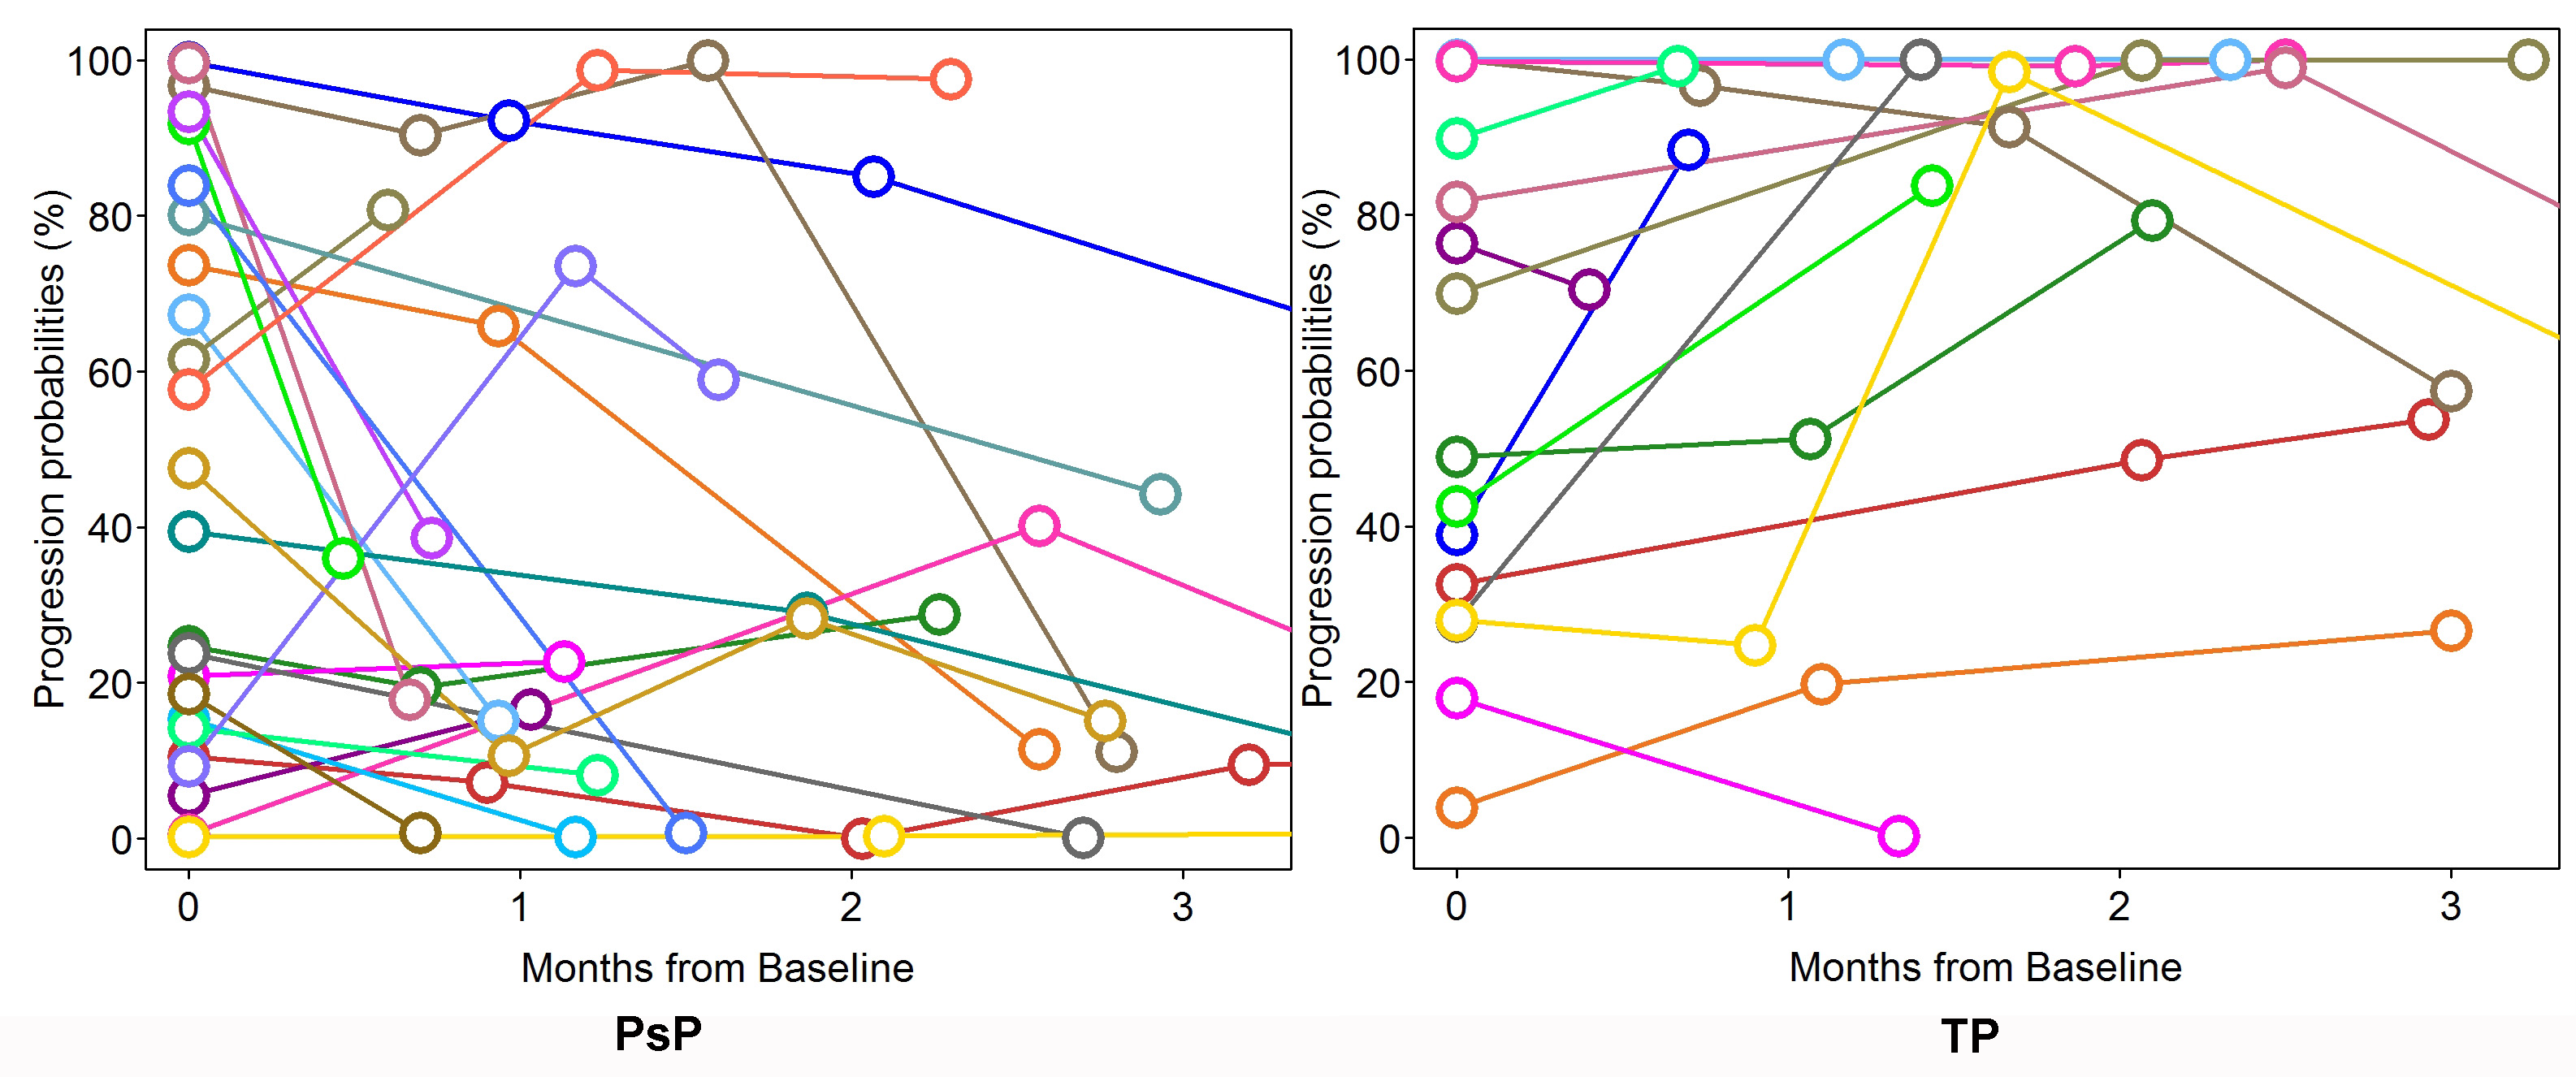
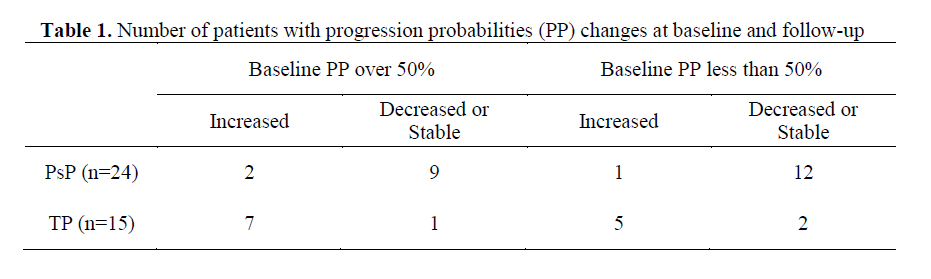
Representative MD, FA and CBV images from a patient at baseline (1st) and follow-up (2nd) study are shown in Fig.1. The plots of predictive PP in PsP and TP patients are shown in Fig. 2. PP values at baseline and follow-up are summarized in Table 1. TP patients had higher baseline PP values compared with PsP (57 ± 32 vs 45 ± 36). Any follow-up PP values more than 25% from the baseline was termed as increased. Otherwise it was classified as stable or decreased. 8 out of 15 TP patients had high baseline PP values with over 50%. Of these, 7 patients demonstrated increased PP, whereas only one patient showed decreased PP on follow-up. Out of the 7 remaining TP patients with less than 50% baseline PP values, 5 patients showed increased PP and 2 patients remained stable. On the other hand, 11/24 PsP patients demonstrated baseline PP values over 50%. Of these, 9 patients demonstrated decreased PP, 2 patients showed increased PP on follow-up. Of the remaining 13 patients with less than 50% baseline PP values, 12 patients showed stable PP while only one patient demonstrated increased PP.DISCUSSION
TP patients tend to have higher baseline PP compared with PsP patients. A majority of the TP patients demonstrated >25% increase in PP compared to baseline PP values despite no apparent changes in contrast enhancement, indicating tumor progression4, 5. On the other hand, relatively unchanged or decreased PP reflects PsP, indicating that the PP model may aid in accurate detection of TP, which might aid in their earlier management in future prospective studies.Acknowledgements
This work was supported by NIH grant 1R21CA170284References
1. Wang S, Martinez-Lage M, Sakai Y, et al. Differentiating Tumor Progression from Pseudoprogression in Patients with Glioblastomas Using Diffusion Tensor Imaging and Dynamic Susceptibility Contrast MRI AJNR 2016; 37(1): 28-36.
2. Prager AJ, Martinez N, Beal K, et al. Diffusion and perfusion MRI to differentiate treatment-related changes including pseudoprogression from recurrent tumors in high-grade gliomas with histopathologic evidence. AJNR 2015; 36(5): 877-885
3. Kong DS, Kim ST, Kim EH, et al. Diagnostic dilemma of pseudoprogression in the treatment of newly diagnosed glioblastomas: the role of assessing relative cerebral blood flow volume and oxygen-6-methylguanine-DNA methyltransferase promoter methylation status. AJNR 2011; 32(2): 382-387.
4. Wang S, O’Rourke DM, Chawla S, et al.
Multiparametric Magnetic
Resonance Imaging in the Assessment of Anti-EGFRvIII Chimeric Antigen ReceptorT cell Therapy
in Patients with Recurrent Glioblastoma
(in press).
5. Boxerman JL, Ellingson BM, Jeyapalan S, et al. Longitudinal DSC-MRI for Distinguishing Tumor Recurrence From Pseudoprogression in Patients With a High-grade Glioma. American journal of clinical oncology 2017; 40(3): 228-234
Figures