2906
Differentiation between glioma recurrence and treatment effects using DWI, ASL, proton MRS and amide proton transfer (APT) imaging at 3 Tesla1Paul C. Lauterbur Research Center for Biomedical Imaging, Shenzhen Institutes of Advanced Technology, Chinese Academy of Sciences, Shenzhen, China, 2Department of Neurosurgery, Cancer Center, Sun Yat-Sen University, Guangzhou, China, 3Department of Medical Imaging, Cancer Center, Sun Yat-Sen University, Guangzhou, China
Synopsis
Conventional MR structural imaging is insufficient for assessment of posttreatment gliomas and advanced imaging is needed to improve diagnostic certainty. The present study compared DWI, ASL, proton MRS and APT for distinction between glioma recurrence and treatment effects. Total 25 patients were enrolled. Results show similar diagnostic performance of APT and ASL, both of which could distinguish recurrent tumor from treatment lesion (P<0.05) with AUC greater than 0.8, superior to that of ADC and proton MRS. Herein, APT and ASL would facilitate posttreatment glioma diagnosis.
Introduction
Differentiation of tumor recurrence from treatment effects plays an important role in reliable evaluation of treatment response and proper design of therapeutic strategies. However, conventional morphological MR imaging techniques, such as T1w, T2w and Gd-enhanced T1w imaging, are insufficient to do so 1. Currently, advanced imaging methods, including diffusion weighted imaging (DWI), arterial spin labeling (ASL), proton MR spectroscopy (MRS), and amide proton transfer (APT) imaging have been employed to aid tumor characterization 2-5. The present study aims to compare their diagnostic performance in differentiation of recurrent glioma from treatment effects in posttreatment glioma patients.Materials and methods
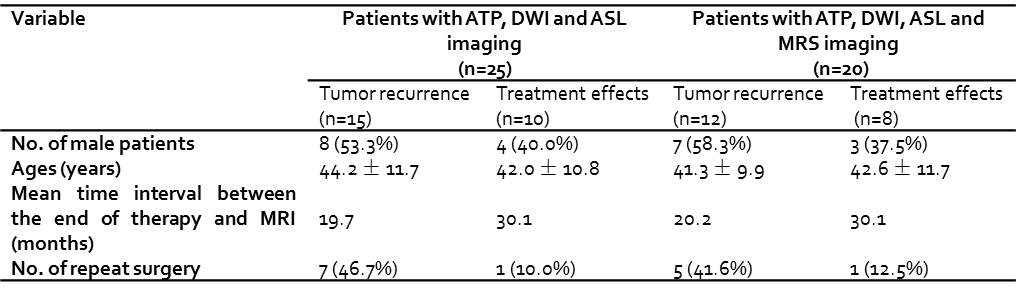
Patient recruitment: The study was approved by local institutional ethics committee. A total of 25 patients were retrospectively enrolled, with the inclusion criteria of: (1) initial diagnosis of histologically proven malignant gliomas; (2) complete radiation therapy or chemoradiotherapy; (3) developed new or enlarged enhancing lesions; (4) had repeat surgical resection afterwards or longitudinal clinical follow-up MRI for at least half a year with intervals of 2–3 months.
MRI study: Multi-parametric MR imaging was performed on a 3T scanner (Discovery MR750, GE), including: DWI (TR = 3s, TE = 65 ms, b-values = 0, 1000 s/mm2), 3D ASL imaging (TR = 4.7 s, TE = 11 ms, TI = 1.5 s, B1 = 1.98 μT, NEX = 3), APT imaging (TR = 2.5 s, TE = 23 ms, 3 saturation pulses with duration of 400 ms, average B1 of 1.0-1.5 μT, spatial resolution = 1.9×1.9×6 mm3), and Gd-enhanced T1w imaging (TR = 155 ms, TE = 1.9 ms). Of the 25 patients, 20 patients also underwent MRS (TR = 1 s, TE = 144 ms) with imaging voxels positioned on Gd-enhanced area and contralateral normal appearing white matter (CNAWM). Tumor recurrence or treatment effect was confirmed from longitudinal routine MRI changes and medical records. Specifically, tumor recurrence was determined either by histology if repeated surgery was performed, or as continuous enlargement of the lesion on at least two consecutive follow-up MR images together with neurological deterioration. The treatment effects were defined as lesion size reduction or stabilization lasting at least 6 months without treatment strategy change.
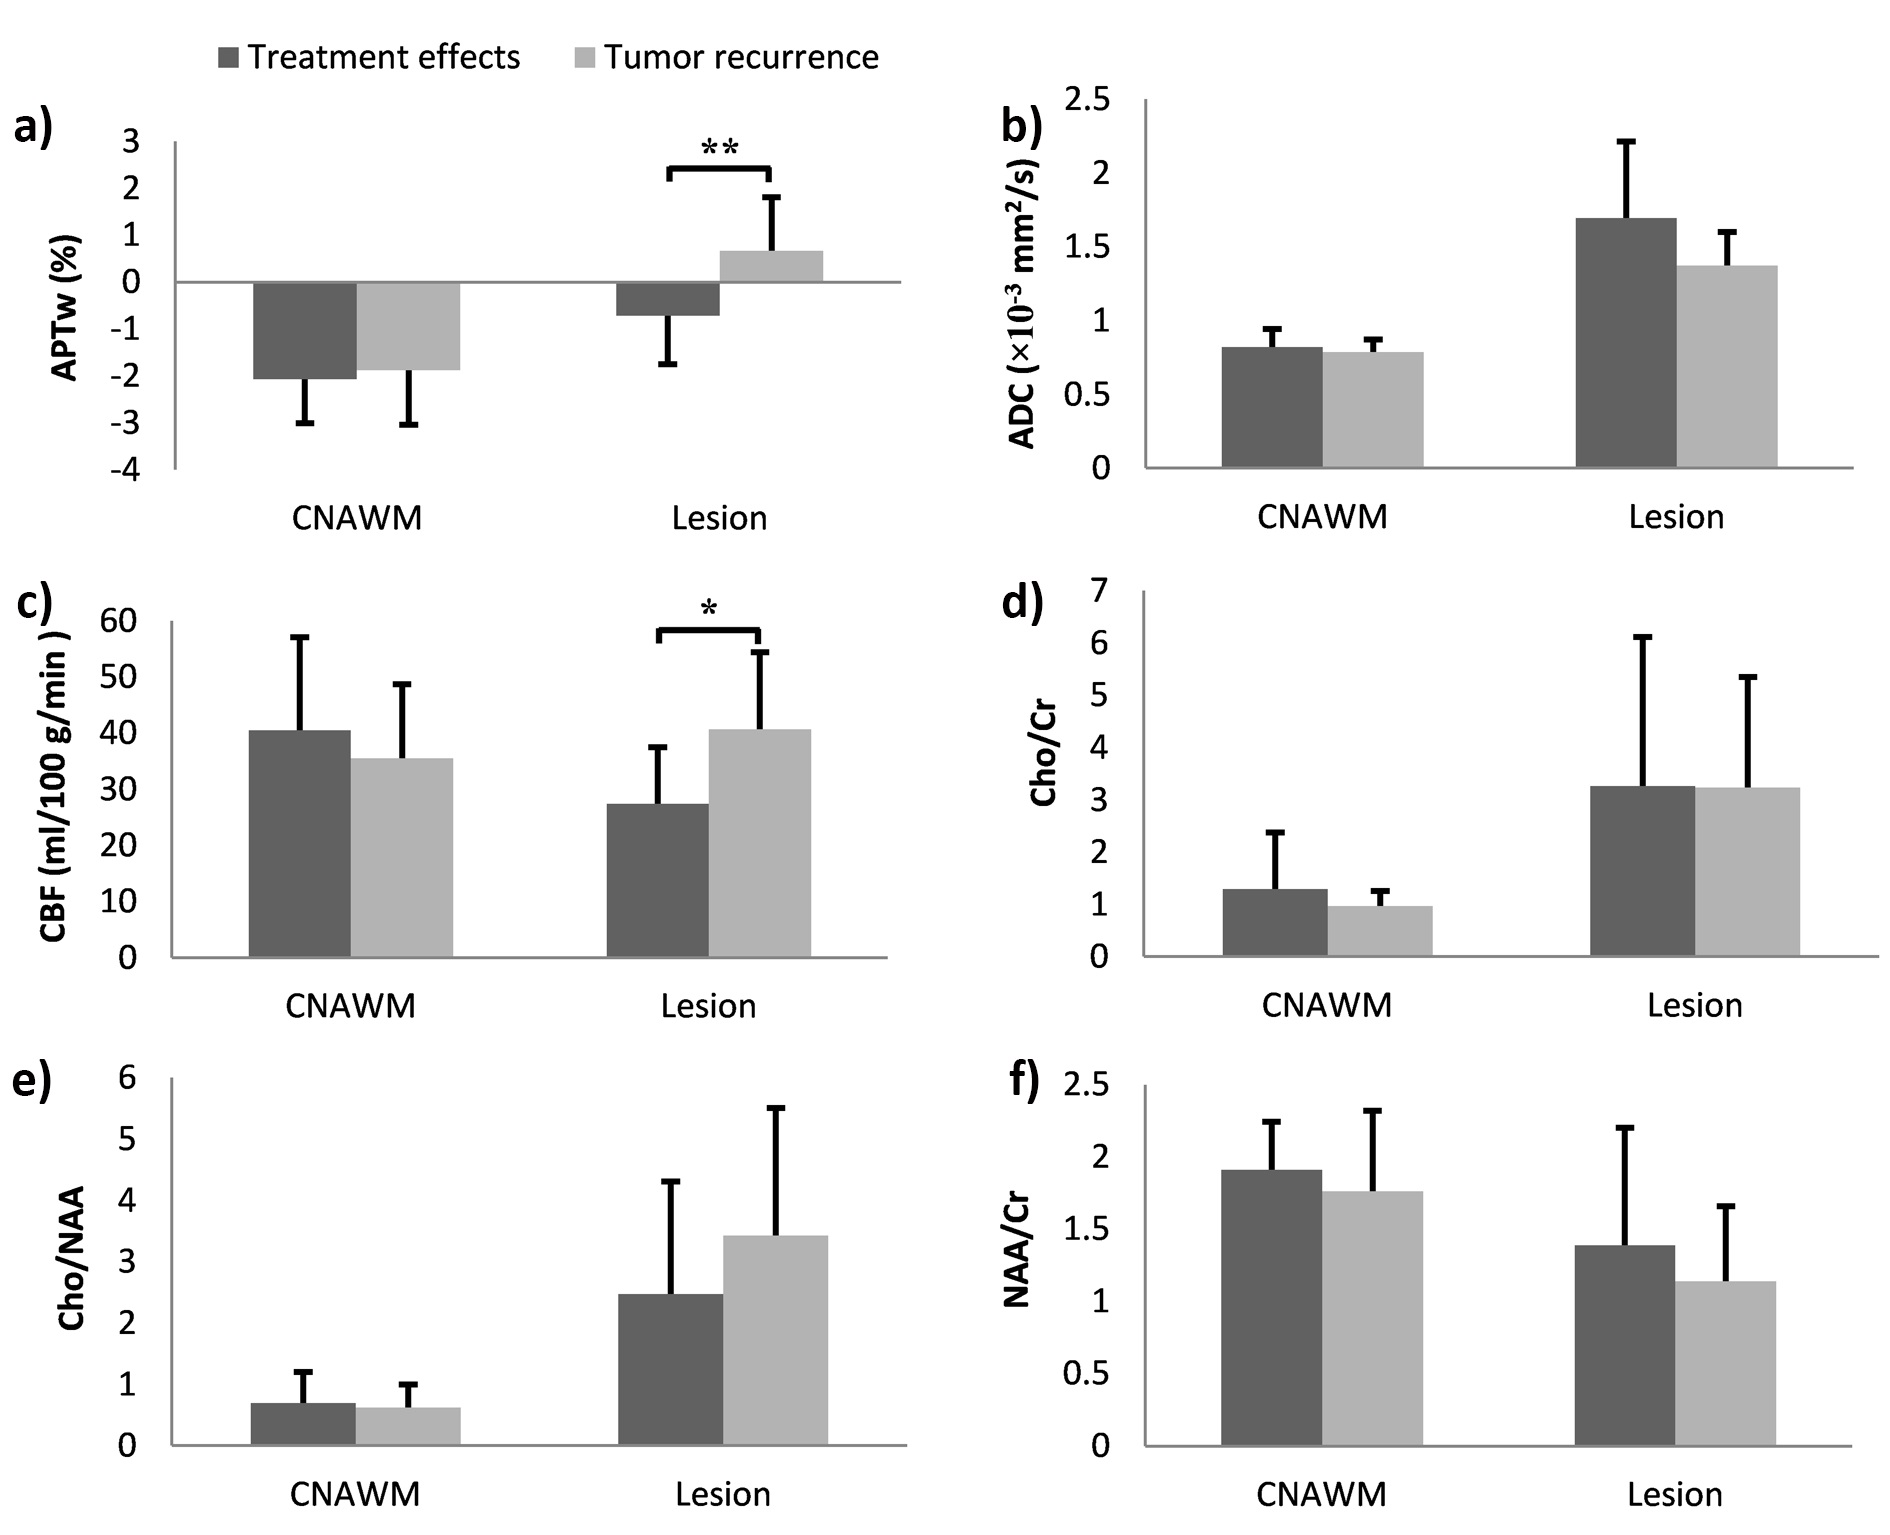
Image analysis: Ratios of Cho/Cr, Cho/NAA and NAA/Cr obtained from MRS were recorded for each voxel. Normalized Z-spectra (Z) was corrected for B0 inhomogeneity. APT-weighted effect was calculated as APTw=Z(-3.5 ppm)-Z(3.5 ppm). ADC map was calculated using least-squares mono-exponential fitting of the diffusion-weighted signal intensities as a function of b-value. CBF maps were generated from ASL data on the GE workstation. CNAWM and lesion regions were manually determined on the APTw maps with reference to Gd-T1w and conventional structural images. Then, the ROIs were transferred to co-registered ADC and CBF maps. Indices were averaged across slices and among patients for each group.
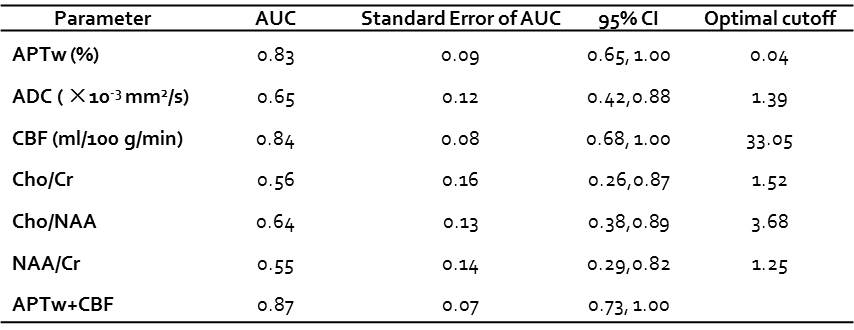
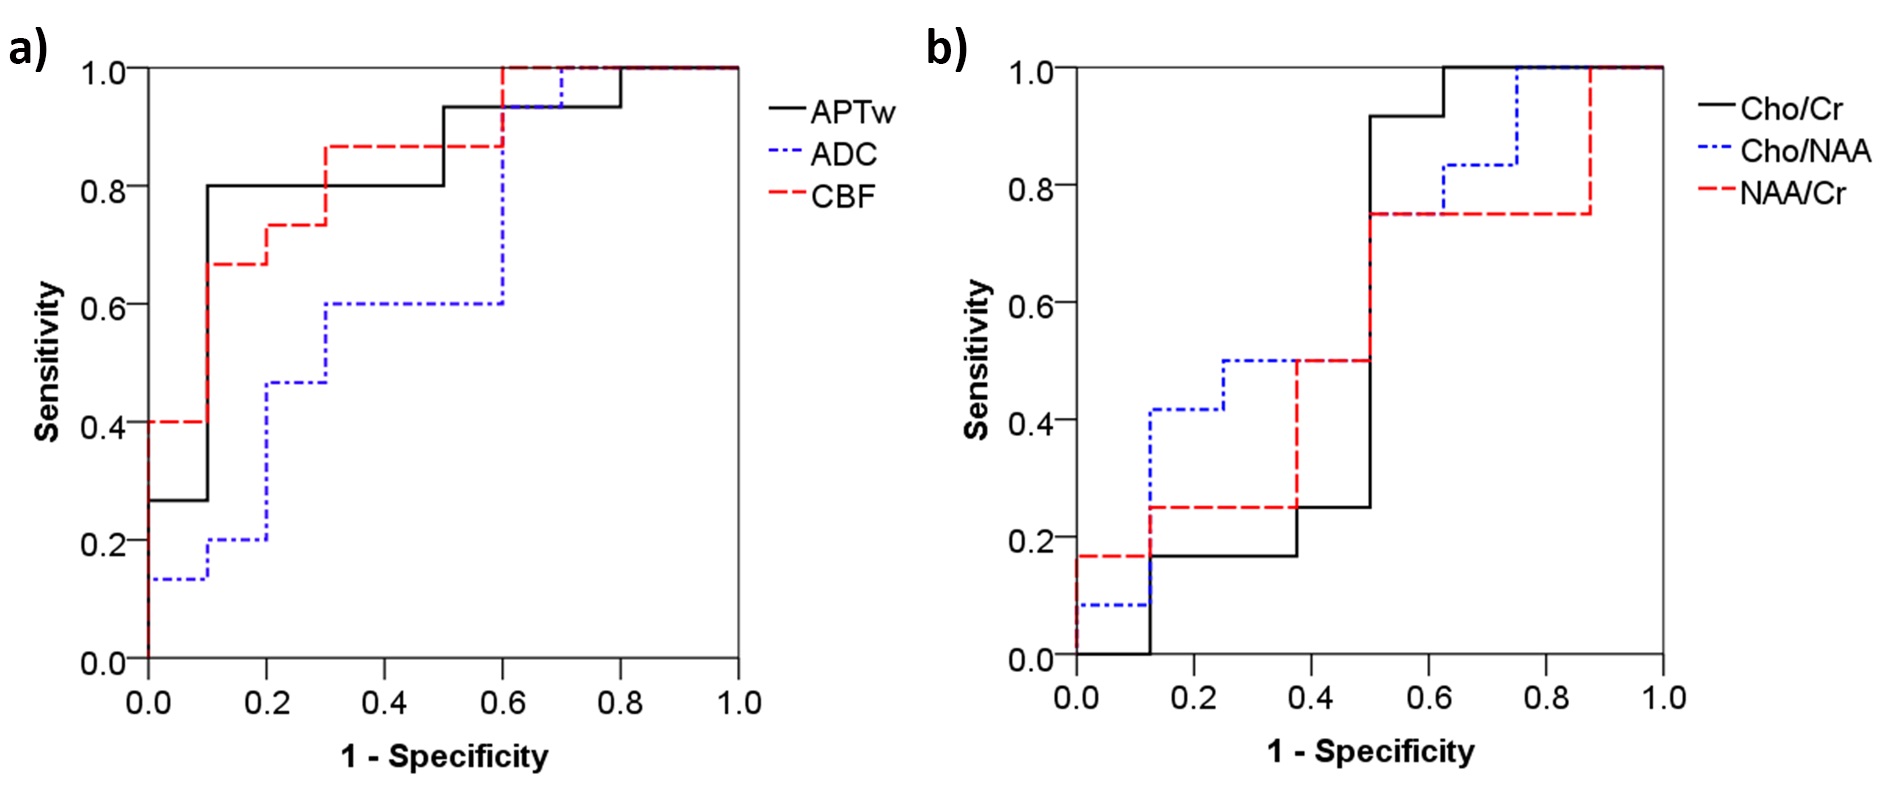
Statistical analysis: Unpaired Student’s t-test was performed between the two groups with P<0.05 regarded as statistically significant. The receiver operating characteristic (ROC) curve was plotted and compared among different imaging techniques 6. The optimal cutoff value was determined as the one with highest sum of sensitivity and specificity. Multivariate logistic regression analysis was used to evaluate the diagnostic performance of combined MR techniques.
Results
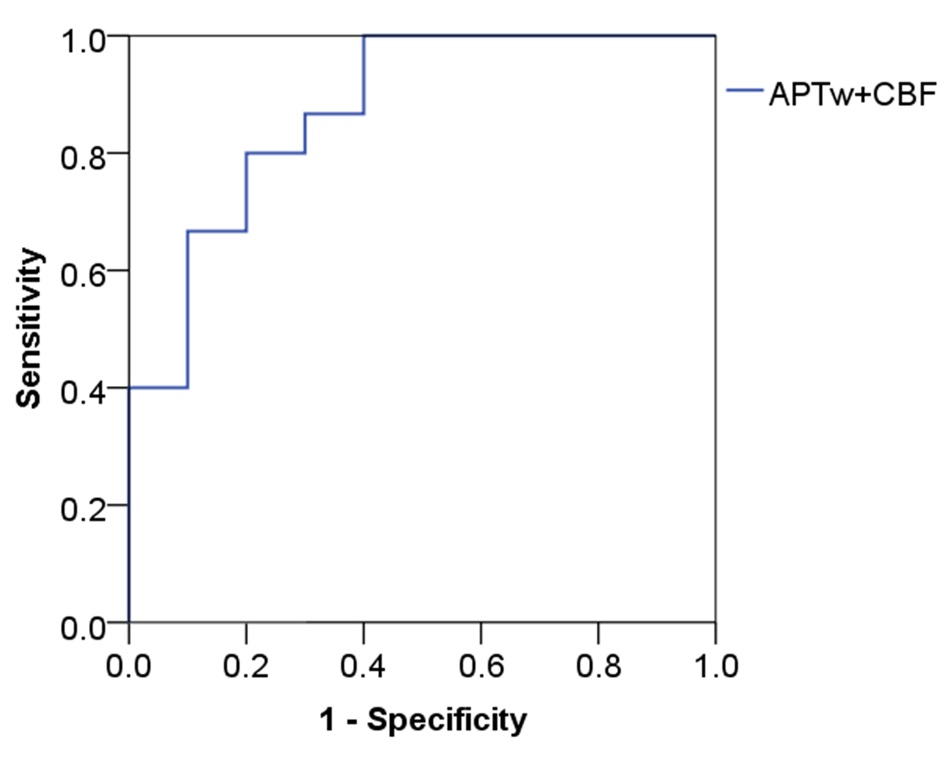
Table 1 summarizes the enrolled patient information. The recurrent gliomas show significantly higher APTw effect (0.68 ± 1.14%) and CBF (40.7 ± 13.7 ml/100 g/min) than those in the treatment-related lesion (-0.71 ± 1.03% and 27.4 ± 10.1 ml/100 g/min, respectively). On the contrary, indices of Cho/Cr, Cho/NAA, NAA/Cr and ADC showed no significant difference between the two groups (Fig. 1). The optimal cutoff value for APTw was 0.04%, which yielded a sensitivity of 80.0% , specificity of 90.0%, and the area under the ROC curve (AUC) of 0.83. Meanwhile, the optimal cutoff value for CBF was 33.05 ml/100 g/min, with a sensitivity of 86.7%, specificity of 70.0% , and the AUC of 0.84. No significantly difference was observed between the ROC curves of APTw and CBF (P=0.91). Slightly higher AUC of 0.87 was achieved with the combination of APTw and CBF (Fig. 3 and Table 2). In comparison, MRS index ratios and ADC were found to be inferior in distinction between glioma recurrence and treatment effects with lower AUC and achievable sensitivity and specificity.Conclusion
Our preliminary patient study shows that both APTw and CBF were superior to ADC and proton MRS indices in differentiating recurrent tumors from treatment effects. The combination of APTw and CBF would further improve the diagnostic performance of posttreatment gliomas.Acknowledgements
Grant Support: National Basic Research Program of China (2015CB755500), NSFC (81571668 and 81871348), Guangdong Special Support Program (2016TQ03R272), and Shenzhen Science and Technology Program (GJHZ20160229200622417, JCYJ20170307165550864 and JCYJ20170413161350892).References
1. Brandsma D and van den Bent MJ, Pseudoprogression and pseudoresponse in the treatment of gliomas. Curr Opin Neurol. 2009; 22(6): 633-638.
2. Yang Y, Dong-Hoon L, Shin-Lei P, et al., Assessment of Glioma Response to Radiotherapy Using Multiple MRI Biomarkers with Manual and Semiautomated Segmentation Algorithms. J Neuroimaging. 2016; 26(6): 626-634.
3. Hong X, Liu L, Wang M, et al., Quantitative multiparametric MRI assessment of glioma response to radiotherapy in a rat model. Neuro-Oncology. 2014; 16(6): 856-867.
4. Bo M, O. BJ, Xiaohua H, et al., Applying amide proton transfer-weighted MRI to distinguish pseudoprogression from true progression in malignant gliomas. J Magn Reson Imaging. 2016; 44(2): 456-462.
5. Zhou J, Tryggestad E, Wen Z, et al., Differentiation between glioma and radiation necrosis using molecular magnetic resonance imaging of endogenous proteins and peptides. Nat Med. 2011; 17(1): 130-134.
6. DeLong ER, DeLong DM, and Clarke-Pearson DL, Comparing the areas under two or more correlated receiver operating characteristic curves: a nonparametric approach. Biometrics. 1988; 44(3): 837-845.
Figures