2904
Differentiating the treatment-related effect from tumor recurrence using amide proton transfer‐weighted (APTW) and pseudo-continuous arterial spin labeling (pcASL) MRI1Department of Radiology, Zhujiang Hospital of Southern Medical University, Guangzhou, China, 2Philips Healthcare, Guangzhou, China, 3Division of MR Research, Department of Radiology, Johns Hopkins University School of Medicine, Baltimore, MD, United States
Synopsis
Discriminating treatment-related effect from tumor recurrence with is critical for treatment decision-making. Amide proton transfer (APT) and pseudo-continuous arterial spin labeling (pcASL) are two non-invasive advanced magnetic resonance imaging (MRI) techniques. In this study we combined two techniques hoping to explore their diagnostic performance in differentiating treatment-related effect from tumor recurrence.
Purpose
Maximal, safe resection, followed by radiation therapy and chemotherapy is typical treatment for patients with newly diagnosed high-grade gliomas1. This treatment strategy can lead to a treatment-related change which can appear as diverse patterns of a progressive, contrast-enhancing lesion on post-treatment MRI. Discriminating treatment-related effect from tumor recurrence with non-invasive method is challenging but critical for selecting the appropriate treatment strategy. APT MRI is a new endogenous molecular imaging technique based on chemical exchange-dependent saturation transfer (CEST) 2. Previous studies have demonstrated that APT MRI had the potential to distinguish viable malignancy versus radiation necrosis and predict tumor response to therapy3. The pcASL technique, a newly developed PWI sequence, has been explored in the evaluation of perfution of brain tumors4, 5. The purpose of this work was to investigate the diagnostic performance of APT and pcASL MRI for differentiating treatment-related effect from recurrence in patients with post-treatment high-grade gliomas.Methods
Results and Discussion
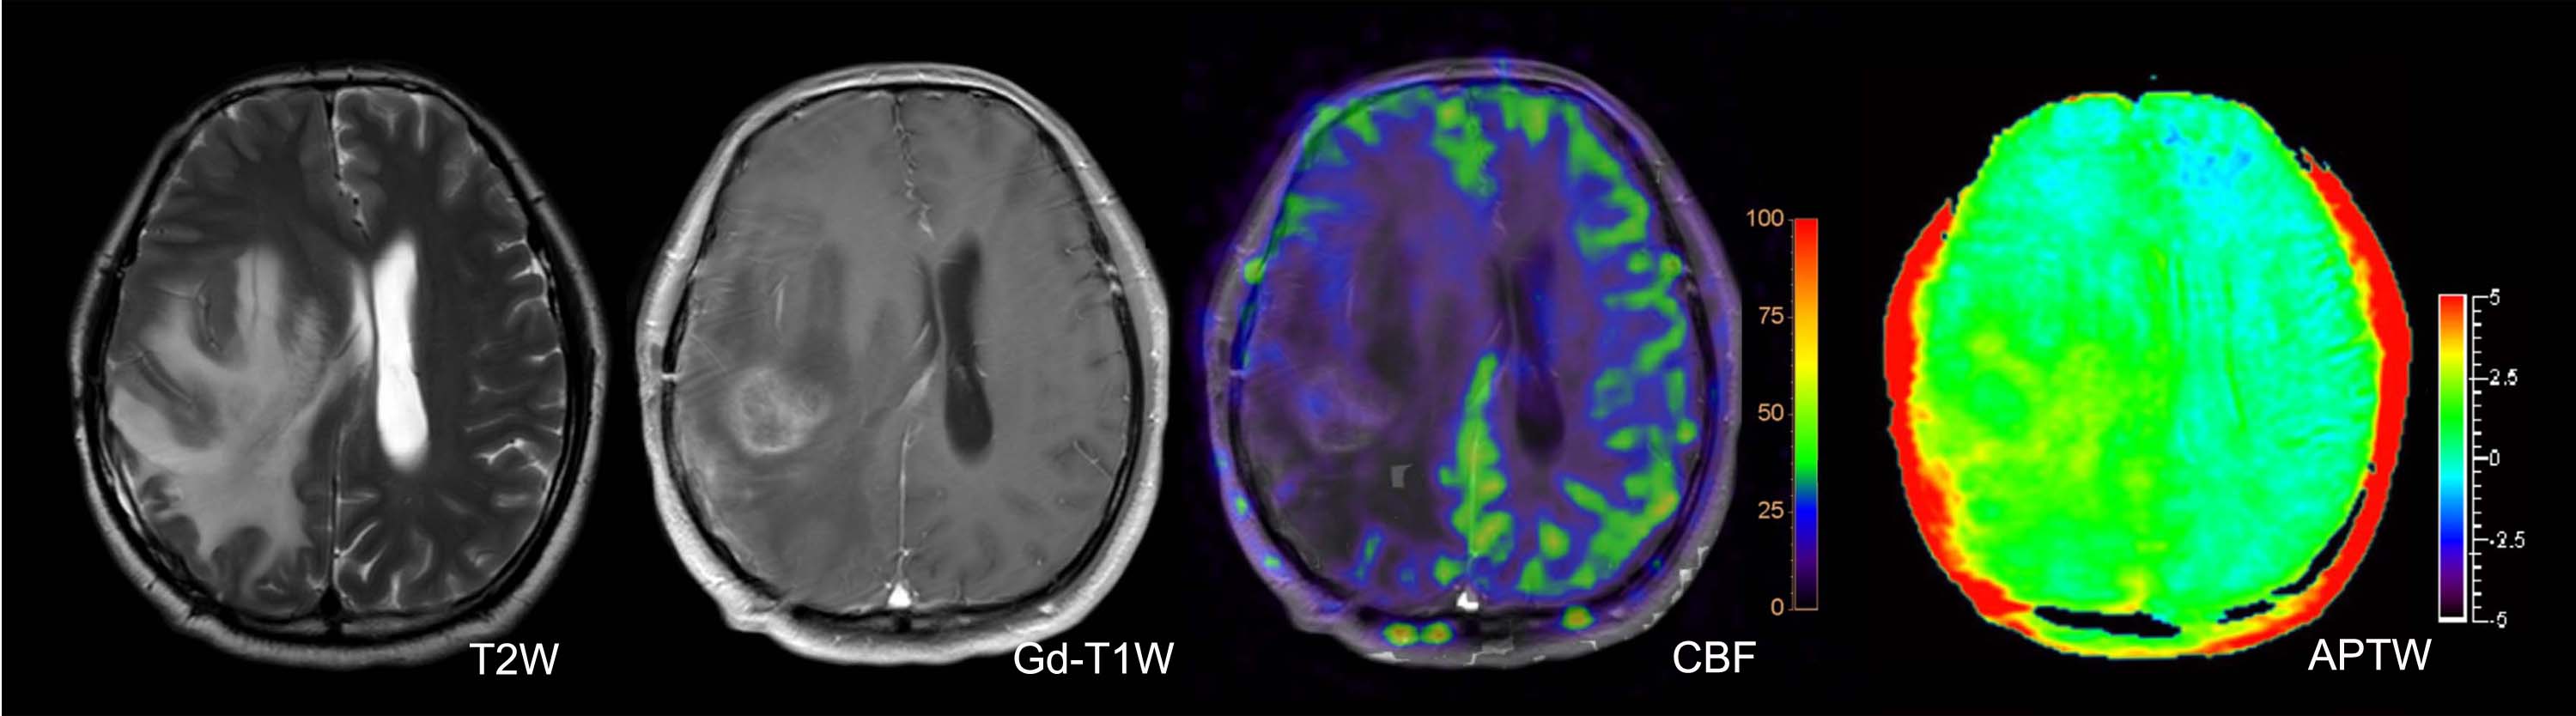
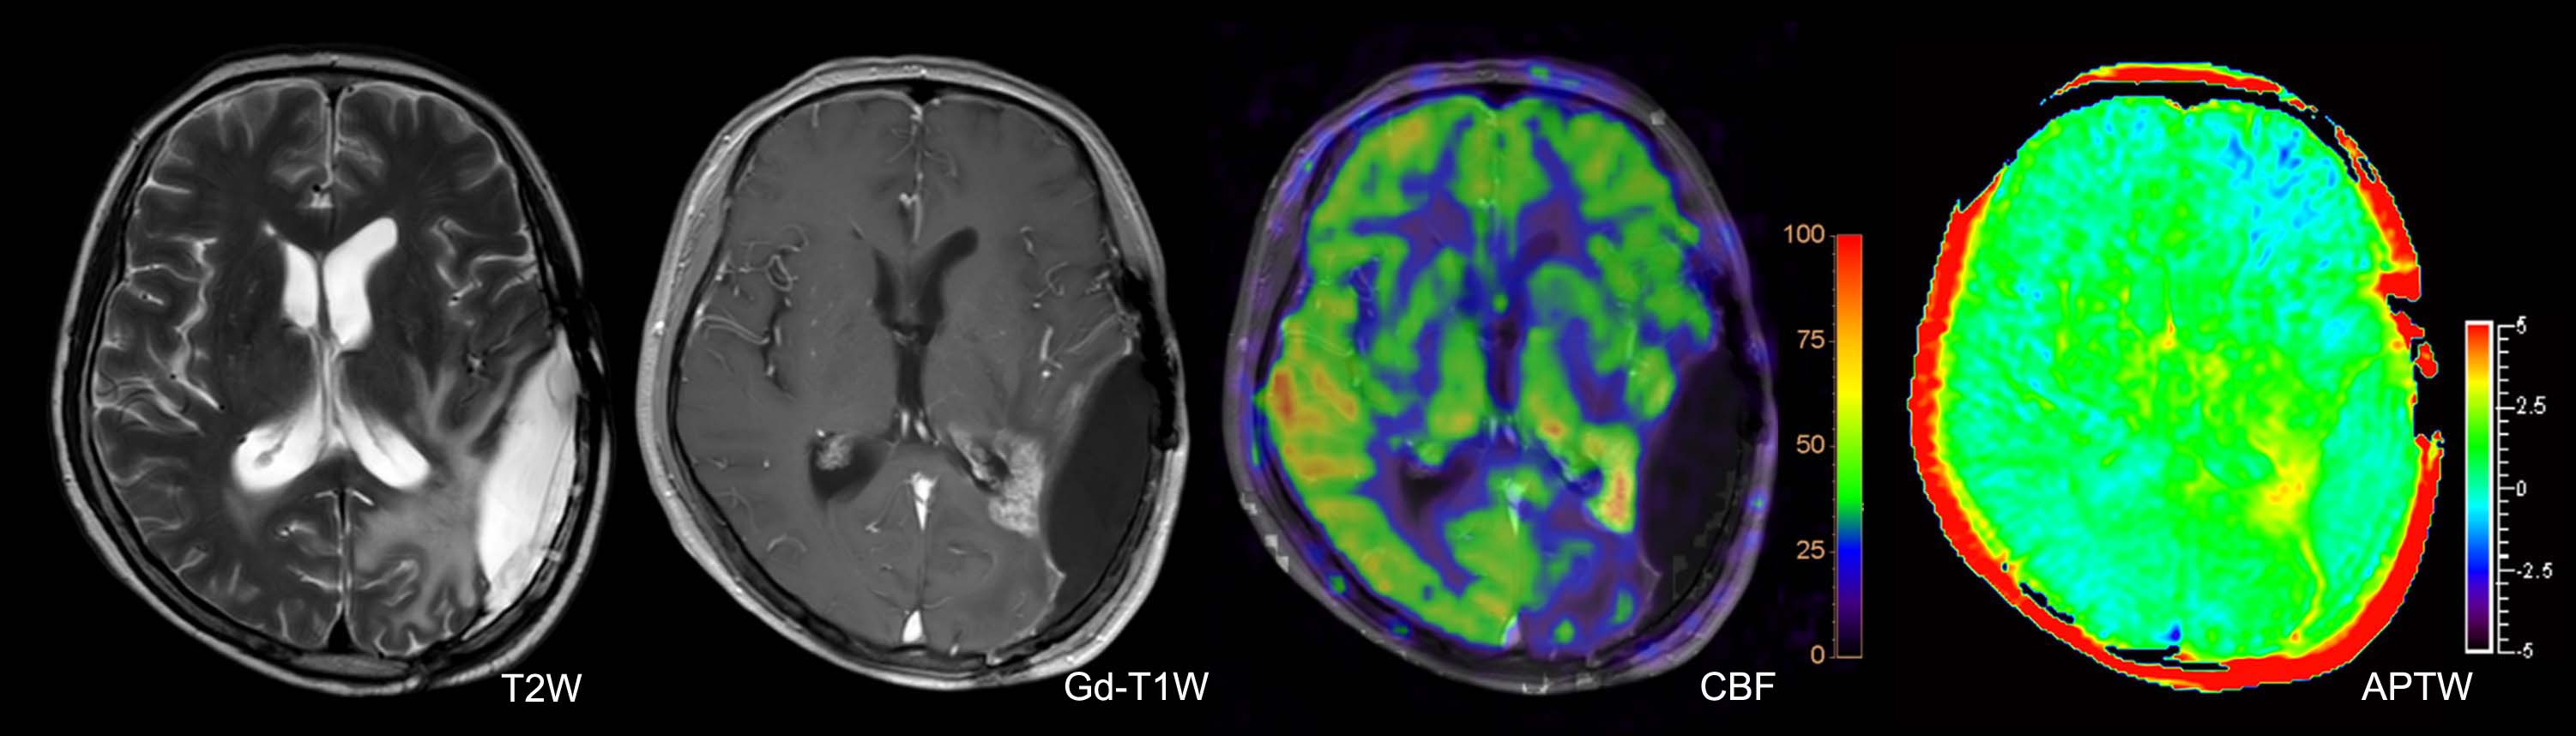
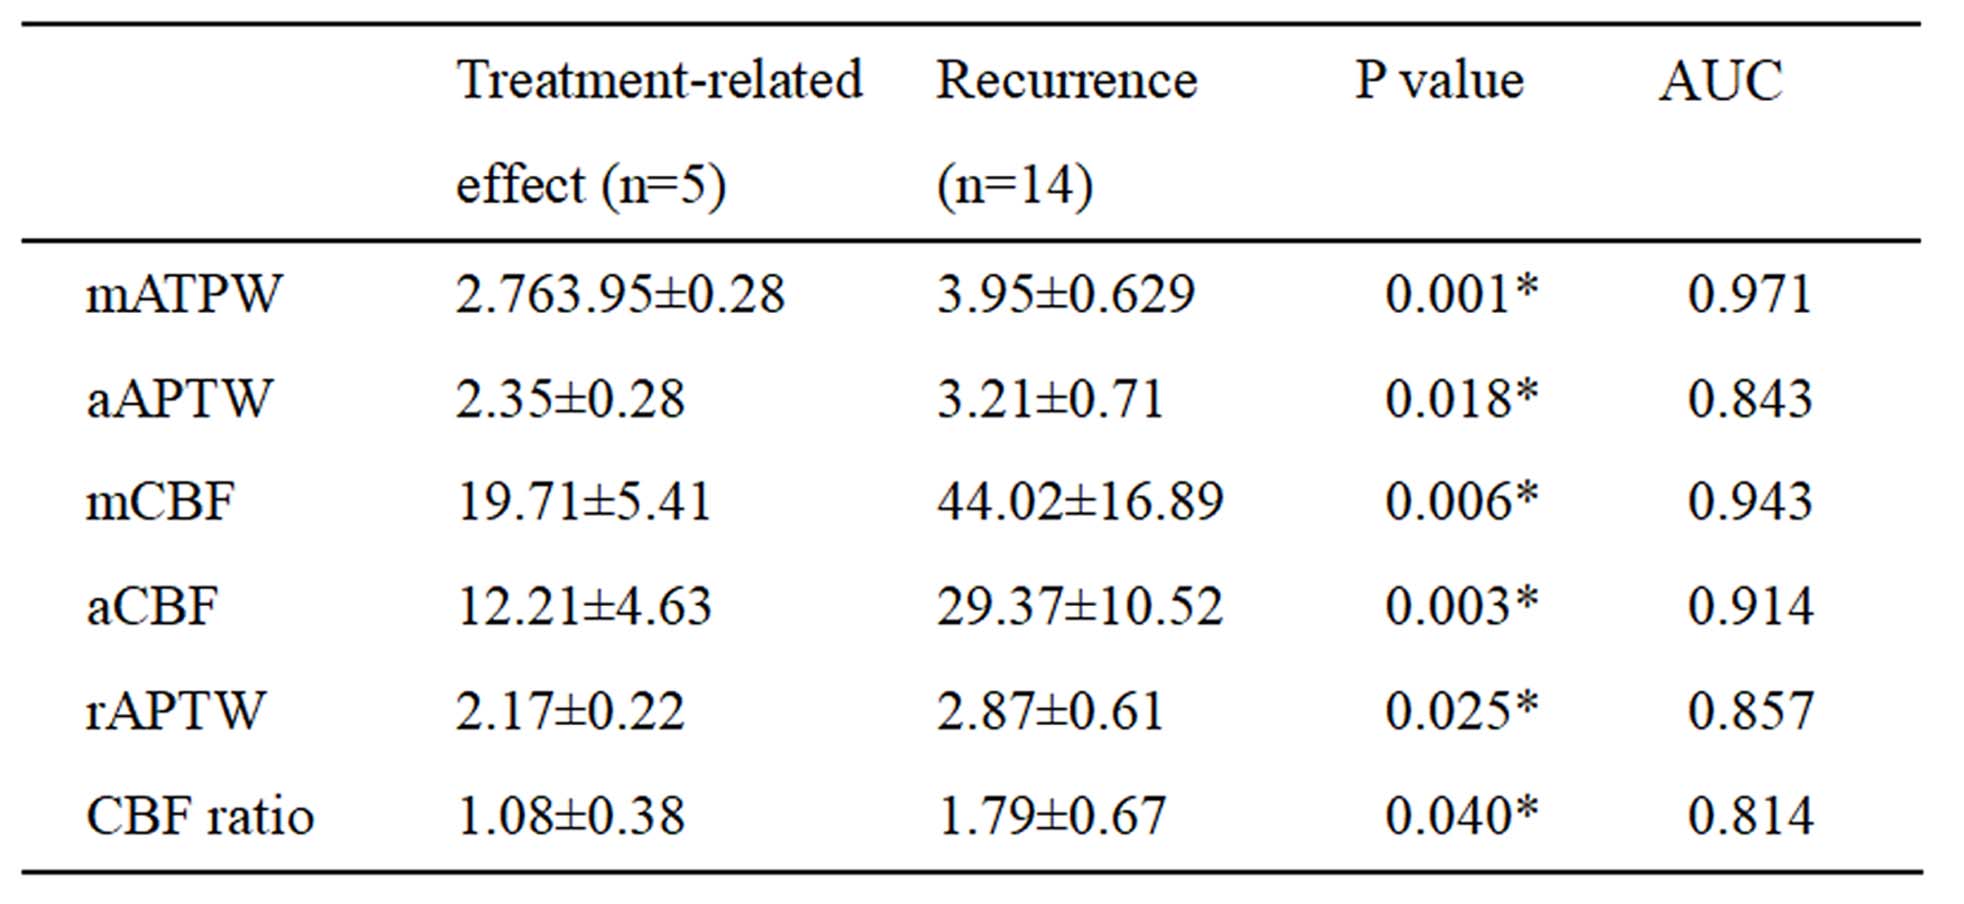
All cases were confirmed by surgical diagnoses or clinical-radiologic follow-up in which 5 were treatment-related effect (Figure 1) and 14 were tumor recurrence (Figure 2). mAPTW, aAPTW, rAPTW, mCBF, aCBF and CBF ratio in lesions were significantly larger in the recurrence group than in the treatment-related effect group (p < 0.05). (Table 1) The mATPW showed the best performance for discriminating recurrence from treatment-related effect, followed by mCBF, aCBF, rAPTW, aAPTW, while CBF ratio showed the lowest diagnostic performance.
Conclusion
Our findings indicate that APTW and pcASL imaging are useful for assessing the state of high-grade gliomas after surgery followed by radiotherapy and chemotherapy. These two supplementary non-invasive methods showed the potential to improve the diagnostic performance in the identification between recurrence and treatment-related effect.Acknowledgements
No acknowledgement found.References
1.Stupp R, Mason WP, van den Bent MJ, et al. Radiotherapy plus concomitant and adjuvant temozolomide for glioblastoma. N Engl J Med 2005;352:987–996.
2. Zhou J, Lal B, Wilson DA, Laterra J, van Zijl PC. Amide proton transfer (APT) contrast for imaging of brain tumors. Magn Reson Med 2003;50(6):1120‐1126.
3. Zhou J, Tryggestad E, Wen Z, et al. Differentiation between glioma and radiation necrosis using molecular magnetic resonance imaging of endogenous proteins and peptides. Nature Medicine 2011; 17: 130–134.
4. Lehmann P, Monet P, de Marco G, et al. A comparative study of perfusion measurement in brain tumours at 3 Tesla MR: arterial spin labeling versus dynamic susceptibility contrast-enhanced MRI. Eur Neurol 2010; 64: 21–26.
5. Järnum H, Steffensen EG, Knutsson L, et al. Perfusion MRI of brain tumours: a comparative study of pseudo-continuous arterial spin labeling and dynamic susceptibility contrast imaging. Neuroradiology 2010; 52: 307–317.
6.Jochen Keupp, Jinyuan Zhou, and Osamu Togao. 3D Clinical APTw MRI with Improved Contrast Homogeneity. #1506, 2016 ISMRM
Figures