2903
MOLLI versus SMART1 mapping for quantitative brain tumor DCE MRI on a 3T GE 750w: Initial experience1Medical Imaging, The Ottawa Hospital, Ottawa, ON, Canada, 2Ottawa Hospital Research Institute, Ottawa, ON, Canada, 3Radiology, University of Ottawa, Ottawa, ON, Canada, 4Faculty of Medicine, University of Ottawa, Ottawa, ON, Canada, 5Physics, Carleton University, Ottawa, ON, Canada
Synopsis
In radiotherapy of high-grade gliomas, radiation changes (RC) are common. RC and tumor recurrence (TR) may both demonstrate progressive Gd contrast enhancement on follow-up, rendering conventional MRI unhelpful. DCE MRI, however, shows promise for distinguishing RC from TR. We set up a new protocol for brain tumor DCE-MRI on a 3T GE 750w. This protocol involved bookend T1 mapping performed with both MOLLI and SMART1. We found that both T1 mapping sequences gave similar results. Although patient numbers are low at this time, the technique appears promising for distinguishing radiation changes from tumor recurrence.
Introduction
In radiotherapy of high-grade gliomas, radiation-induced injury of brain parenchyma (aka "radiation changes", or RC) is common. RC and tumor recurrence (TR) may both demonstrate progressive Gd contrast enhancement on follow-up, rendering conventional MRI unhelpful (1). Dynamic contrast-enhanced (DCE) MRI shows promise for distinguishing RC from TR (2). The DCE-MRI tracer kinetic parameters Ktrans (volume transfer constant) and Vp (plasma volume fraction) are generally higher in TR than in RC (3).
For this prospective clinical study, a new protocol was set up for brain tumor DCE-MRI on a 3T General Electric 750w. The "Bookend Method", involving T1 mapping pre- and post-DCE, was used to convert DCE signal to Gd concentration ( [Gd] ) (4). Two different Look-Locker-based T1 mapping pulse sequences were used: Modified Look Locker Imaging (MOLLI) and Saturation Method using Adaptive Recovery Times for cardiac T1 (SMART1 map) (5-6).
It was hypothesized that DCE-MRI would distinguish RC from TR equally well regardless of T1 mapping method.
Methods
Twelve patients have so far been enrolled in this DCE-MRI research study. Each patient had received chemoradiation for high grade glioma, then subsequently developed new enhancing lesion(s) on conventional follow-up MRI.
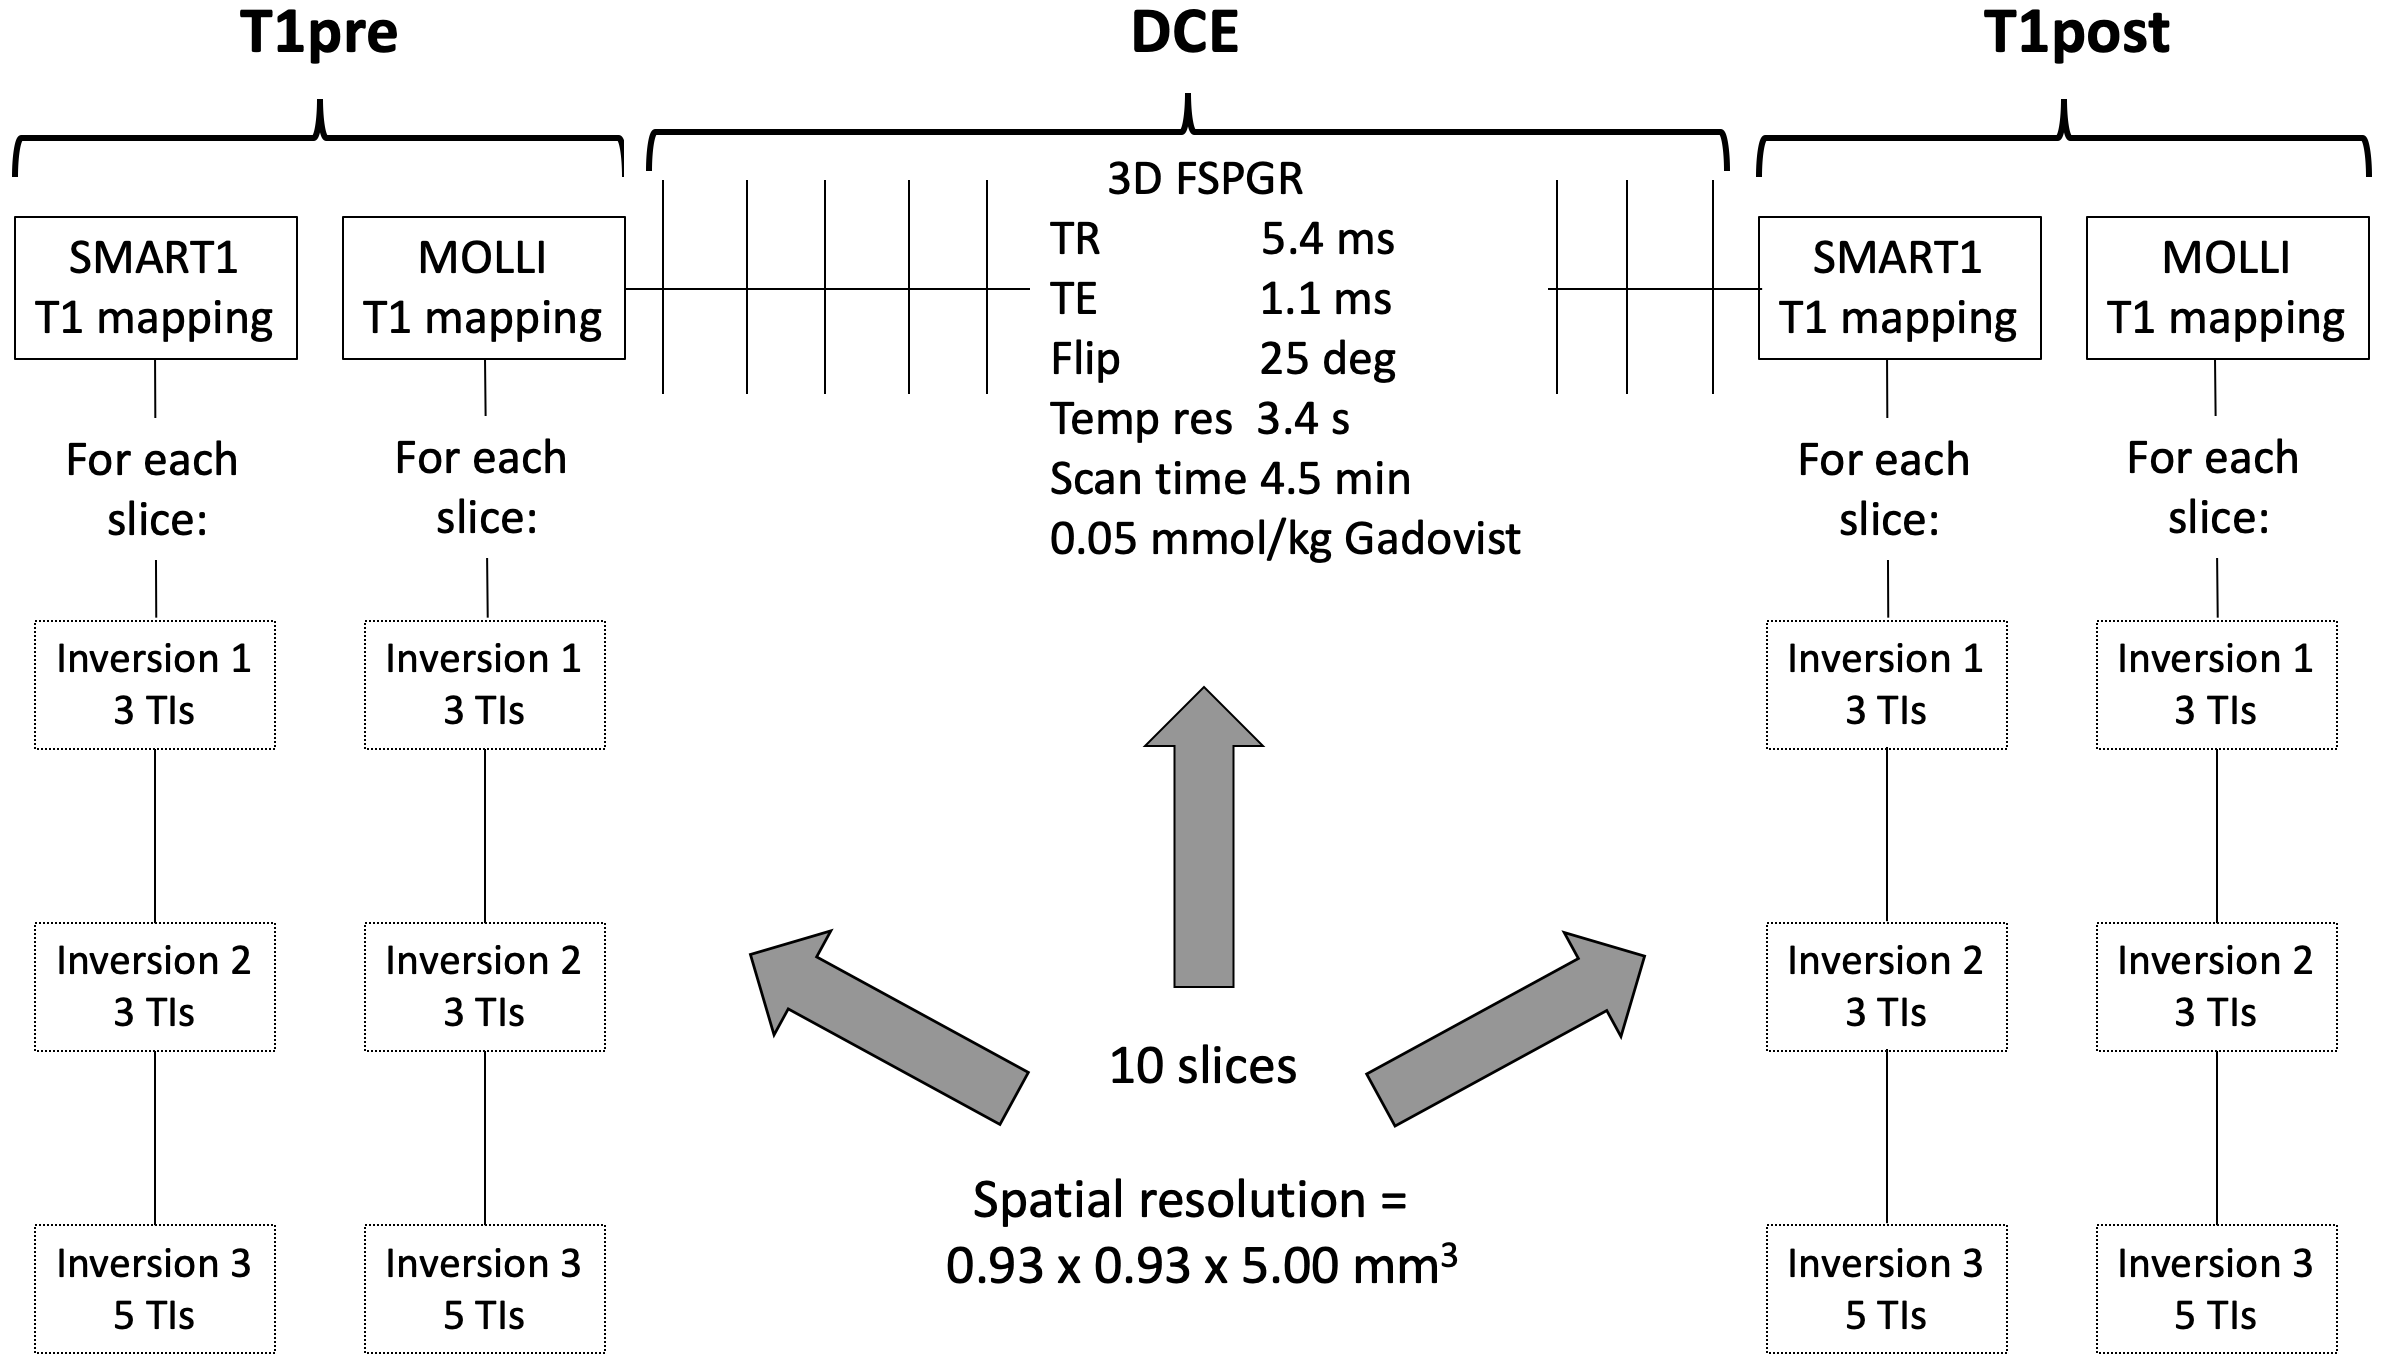
Before and after DCE, both MOLLI and SMART1 mapping were performed (Figure 1). For both MOLLI and SMART1, inversion pulses and FIESTA readout were used because they had provided the best accuracy in phantoms (data not shown). Although this was a neuro application, the MOLLI and SMART1 pulse sequences still required a cardiac gating signal. This was simulated by shining a 1 Hz strobe light into the peripheral gating pulseox probe. MOLLI and SMART1 thus differed only in TI sampling times.
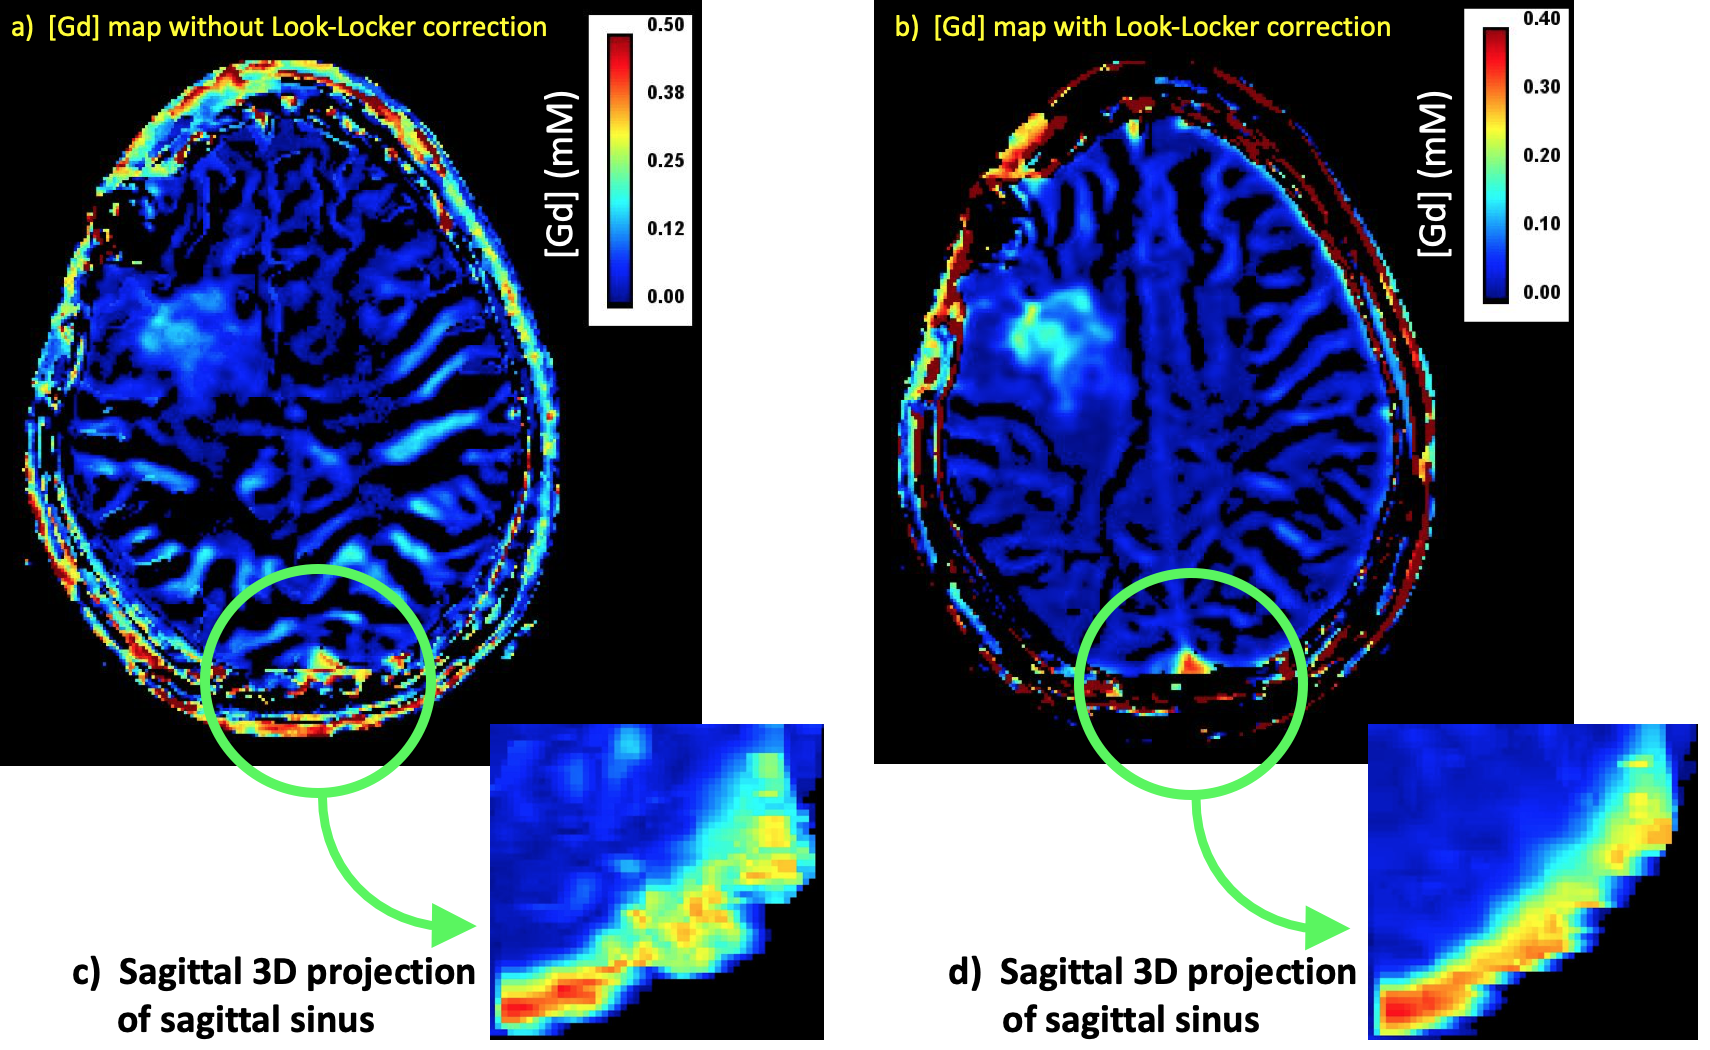
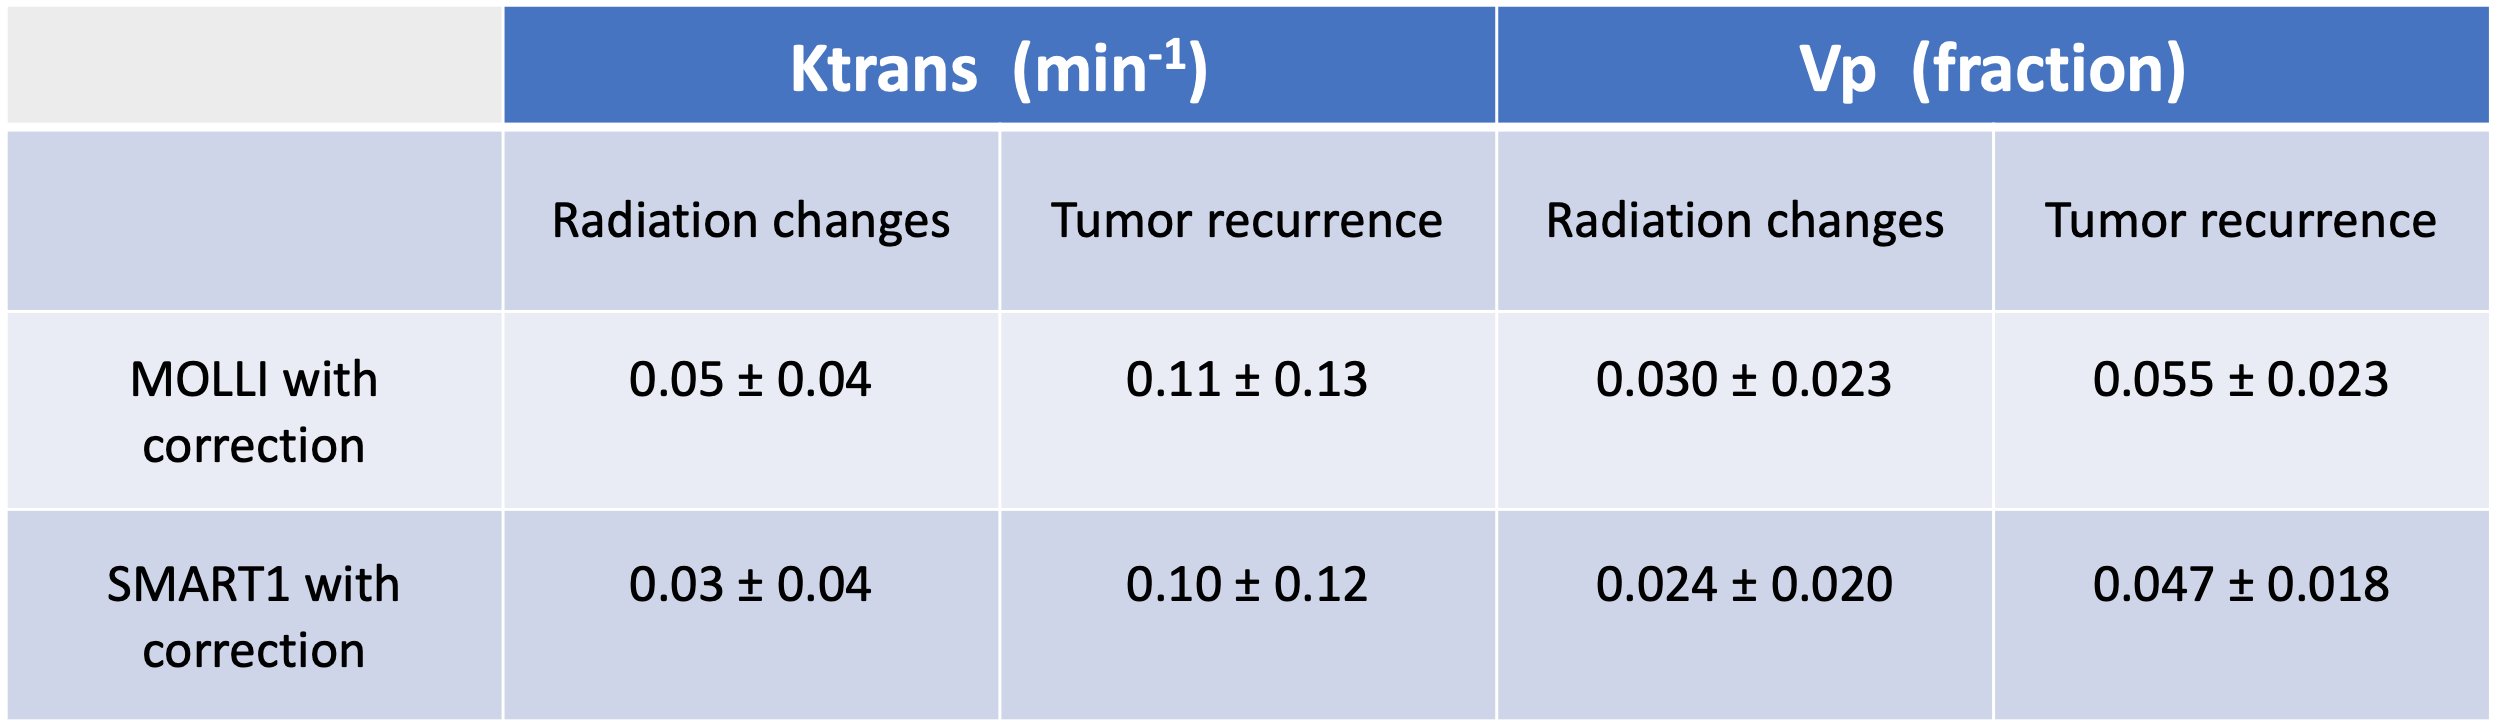
Voxelwise T1 values were found by fitting to the standard equation A - B exp(-TI/T1). Post-DCE [Gd] (Table 2) was calculated via [ (1/T1post) - (1/T1pre) ] / r1, with r1=4.1 mM-1s-1 (7). The Bookend Method converted the DCE data into voxelwise [Gd]-vs-time curves, using the pre- and post- T1 maps from either MOLLI or SMART1 (4). An automated arterial input function (AIF) was generated from these data. We would have preferred to compute the AIF using phase, but phase SNR was lacking, partly due to the short TE (1.1 ms). All T1 and [Gd] computations were repeated using the controversial (8) but commonly used Look-Locker correction (B/A)-1. The Extended Tofts Model was applied to the corrected data using commercial software (OLEA Sphere 3.0) which generated Ktrans and Vp maps. "Hotspot" regions of interest (ROIs) were drawn around localized areas of greatest enhancement to obtain one Ktrans value and one Vp value for each patient.
Receiver operating characteristic (ROC) analysis (Medcalc software bvba) was performed on eight patients who had histopathological data from subsequent surgery or who had the results of serial follow-up MRIs and clinical examinations using the Response Assessment in Neuro-Oncology (RANO) criteria (n=4 RC, n=4 TR). Four other patients were excluded from ROC analysis because their RC/TR status is still indeterminate.
Results
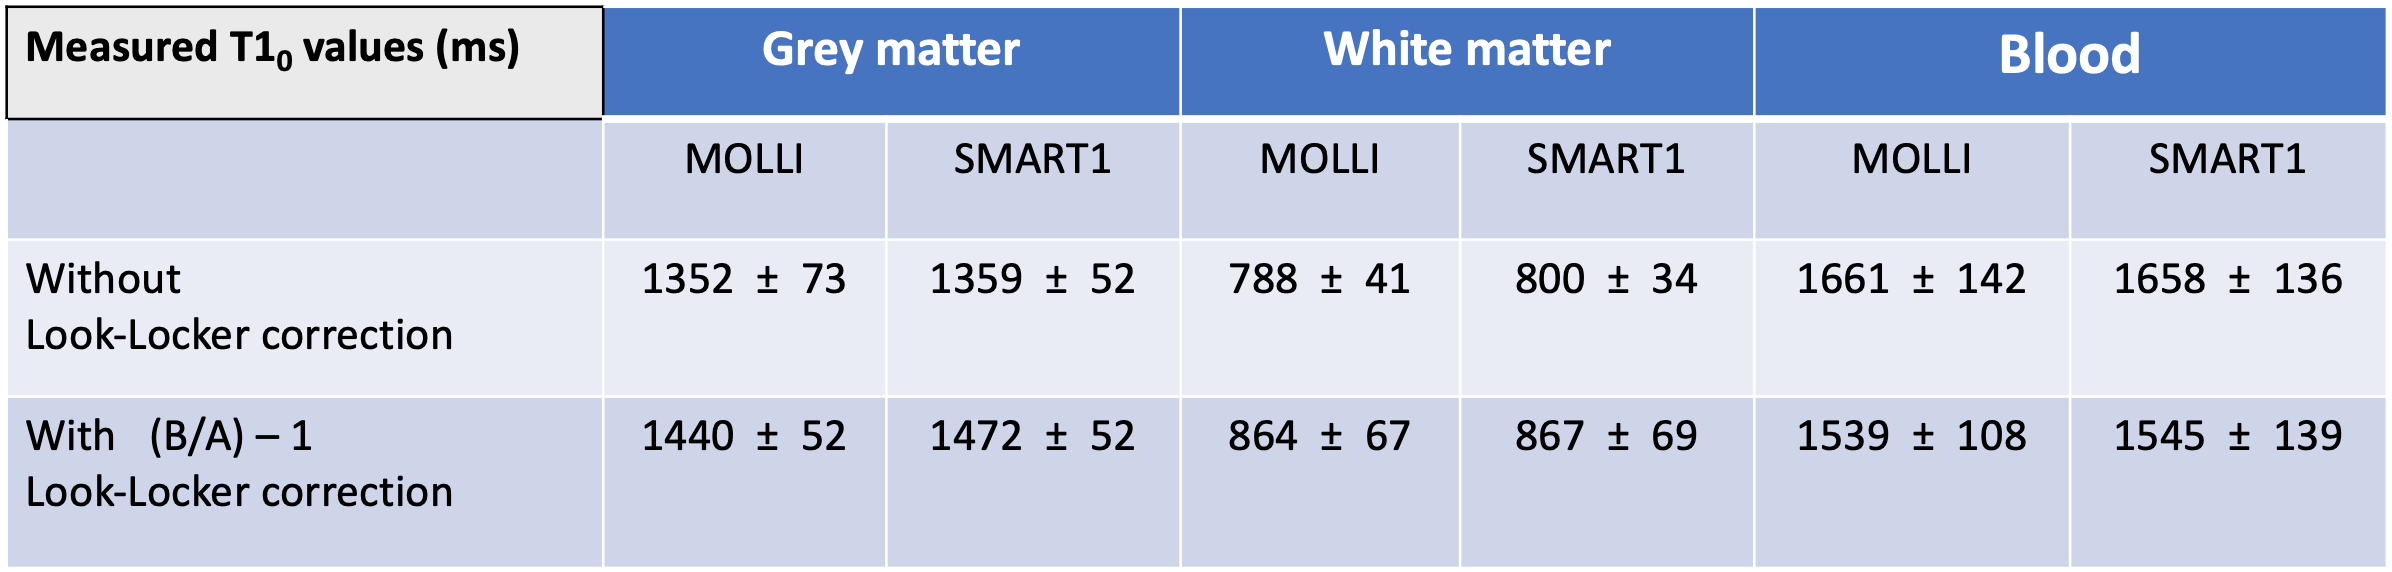
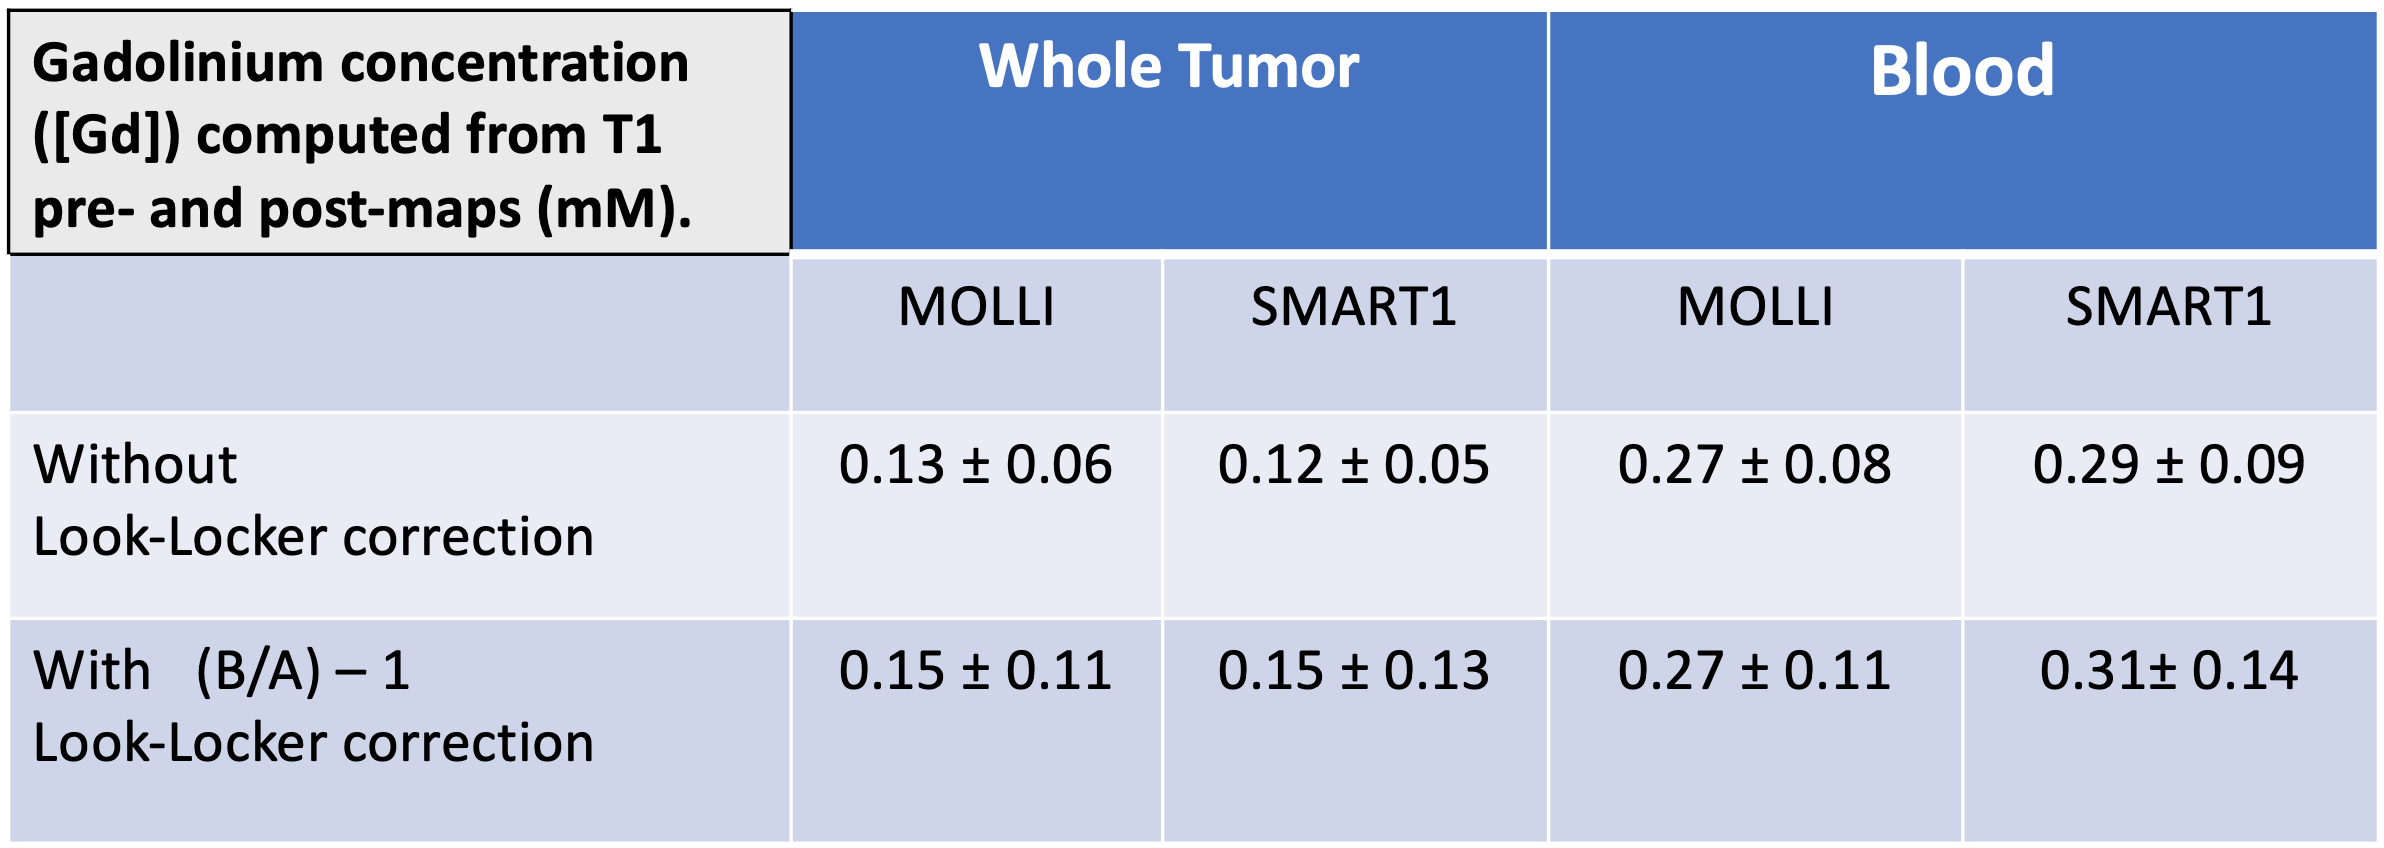
MOLLI and SMART1 yielded very similar T1, [Gd], Ktrans, and Vp values (Tables 1-3).
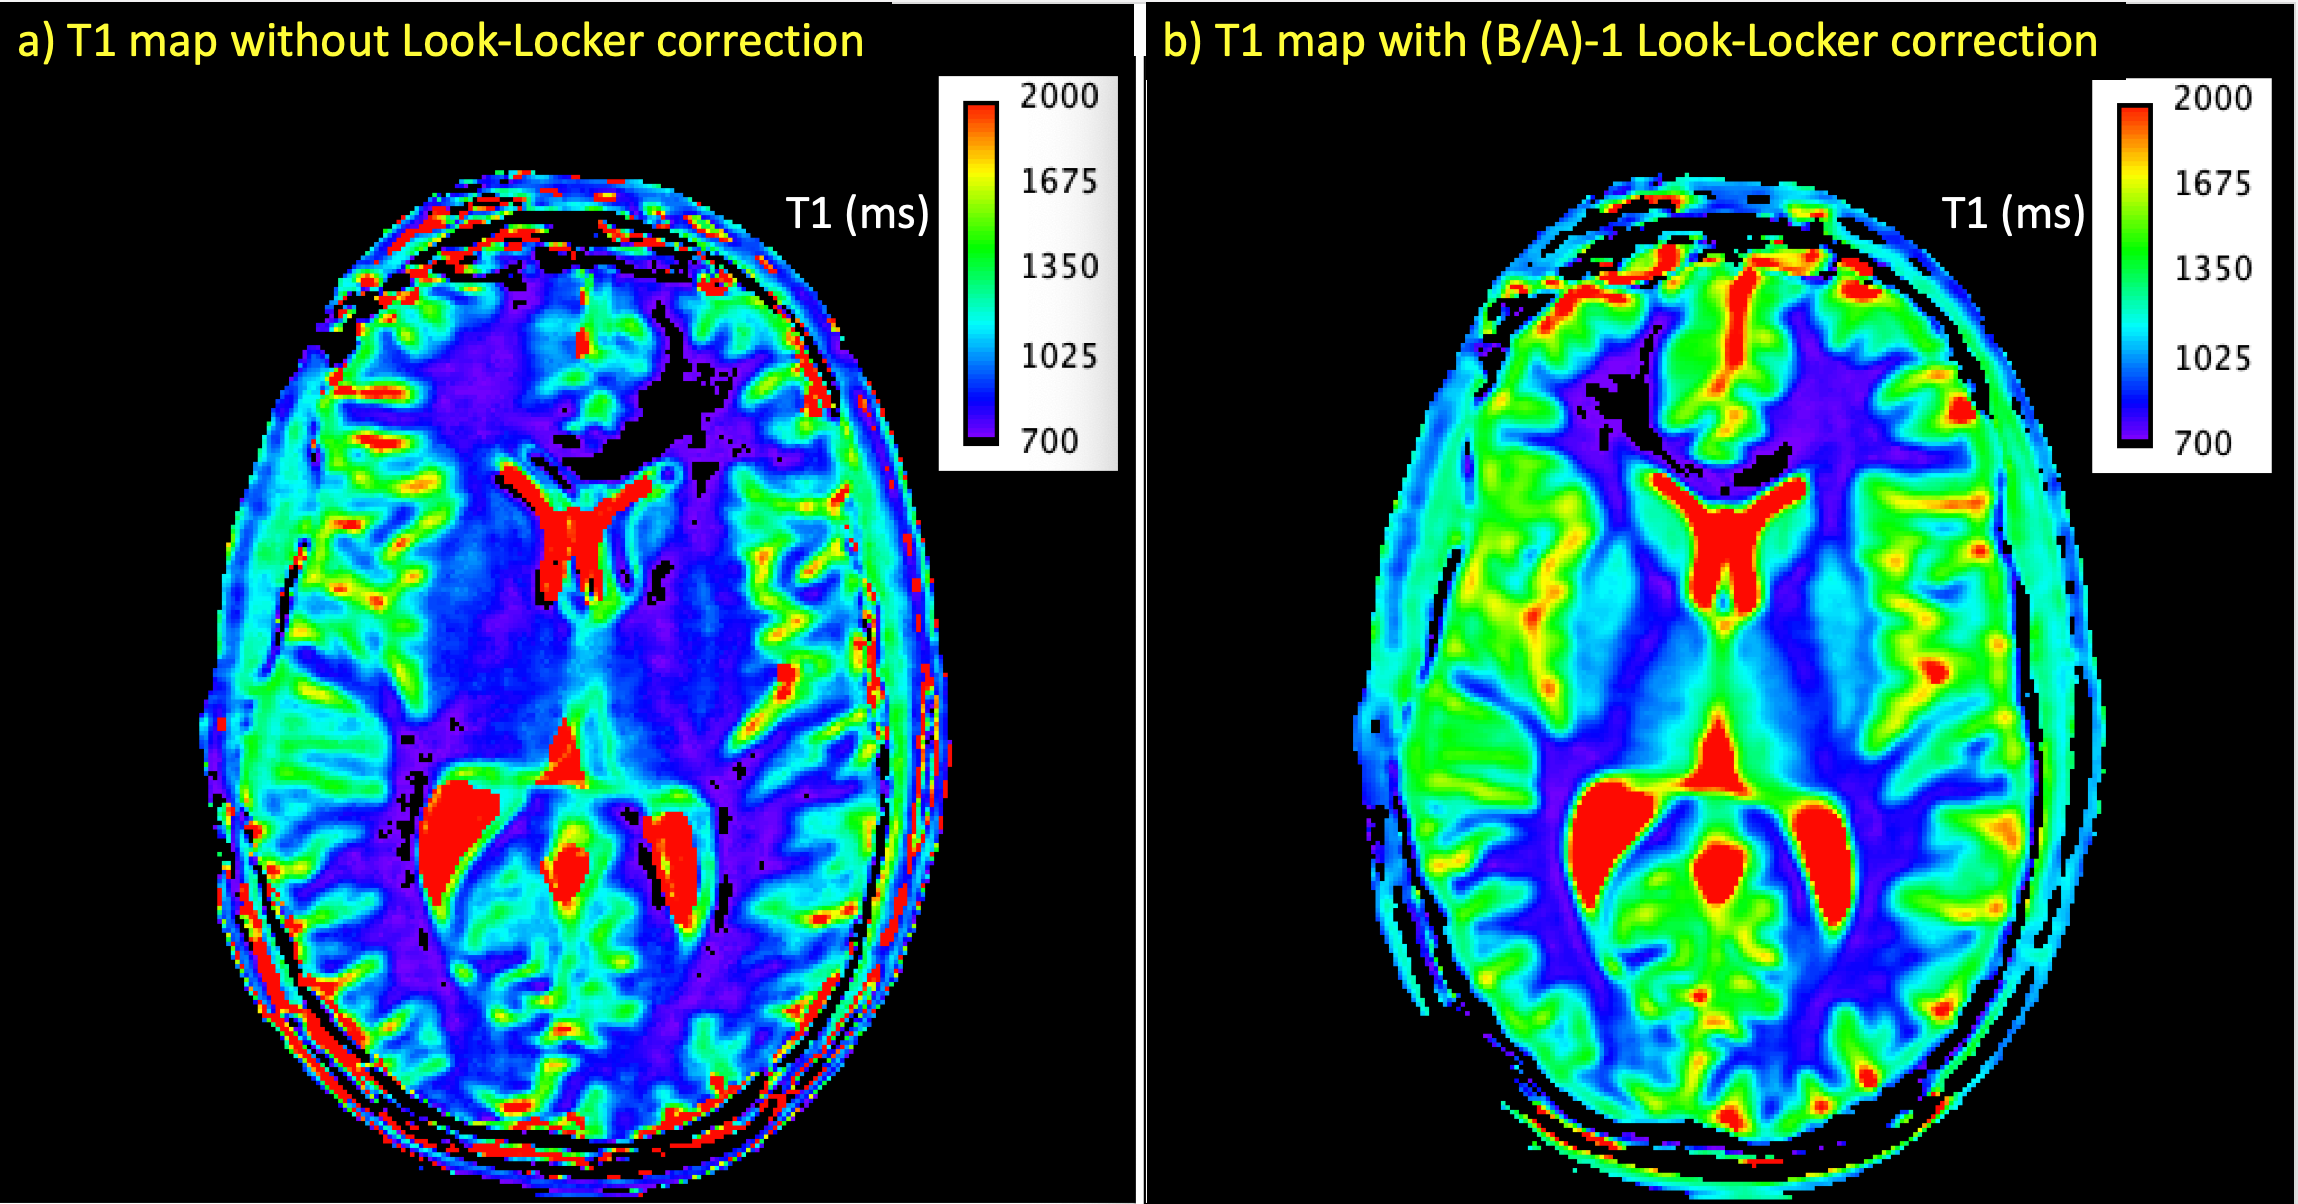
The Look-Locker correction significantly affected T1 values (Table 1) but had little effect on [Gd] (Table 2). This correction also appeared to reduce distortions on T1 and [Gd] maps (Figs 2-3).
For distinguishing RC from TR, ROC AUC ± SE was 0.81 ± 0.20 for all parameters except SMART1 Vp, which was 0.88 ± 0.14. This corresponded to sensitivity=100%, specificity=75% for detecting tumor recurrence.
Limitations
In this preliminary report, patient numbers were insufficient to make strong statistically-based conclusions about the ROC analysis (n=4 RC, n=4 TR).
The Look-Locker correction appeared to reduce distortions in parametric maps (Figs 2-3). However, at this time we do not have a proven explanation for this.
AIFs were obtained from the DCE magnitude data. Despite the short echo time (1.1 ms), short repetition time (5.4 ms), substantial flip angle (25 deg), and low Gd dose (0.05 mmol/kg), it is likely that the AIFs were subject to some inflow and saturation effects (9).
For both MOLLI and SMART1, we used an inversion pulse and an unvarying 60 beats-per-minute simulated gating pulse. This setup therefore removed much of what makes the SMART1 pulse sequence different and advantageous in the cardiac setting.
Conclusion
In an initial experience of performing brain tumor DCE-MRI on a 3T GE 750w, it was found that it did not matter whether the MOLLI or SMART1 pulse sequence was used for T1 mapping. Although patient numbers are low at this time, the technique appears promising for distinguishing radiation changes from tumor recurrence (100% sensitivity, 75% specificity for detecting tumor recurrence).
Acknowledgements
MOLLI and SMART1 sequences, as well as funding for this study, were provided by General Electric.References
1) Verma, Nishant et al. “Differentiating Tumor Recurrence from Treatment Necrosis: A Review of Neuro-Oncologic Imaging Strategies.” Neuro-Oncology 15.5 (2013): 515–534
2) Larsen, Vibeke A., et al. "Evaluation of dynamic contrast-enhanced T1-weighted perfusion MRI in the differentiation of tumor recurrence from radiation necrosis." Neuroradiology55.3 (2013): 361-369.
3) Thomas, Alissa A., et al. "Dynamic contrast enhanced T1 MRI perfusion differentiates pseudoprogression from recurrent glioblastoma." Journal of neuro-oncology 125.1 (2015): 183-190.
4) Greg O. Cron, Giles Santyr, and Frederick Kelcz. "Accurate and rapid quantitative dynamic contrast‐enhanced breast MR imaging using spoiled gradient‐recalled echoes and bookend T1 measurements." Magnetic Resonance in Medicine: 42.4 (1999): 746-753.
5) Slavin, Glenn S., and Jeff A. Stainsby. "True T1 mapping with SMART 1 Map (saturation method using adaptive recovery times for cardiac T 1 mapping): a comparison with MOLLI." Journal of Cardiovascular Magnetic Resonance 15.1 (2013): P3.
6) Slavin:. Proc. ISMRM 2012, 1244.
7) Stalder, Aurélien F., et al. "Variable echo time imaging: Signal characteristics of 1‐M gadobutrol contrast agent at 1.5 and 3T." Magnetic Resonance in Medicine: An Official Journal of the International Society for Magnetic Resonance in Medicine59.1 (2008): 113-123.
8) Slavin, Glenn S. "On the use of the" look-locker correction" for calculating T1 values from MOLLI." Journal of Cardiovascular Magnetic Resonance 16.1 (2014): P55.
9) Roberts, Caleb, et al. "The effect of blood inflow and B1‐field inhomogeneity on measurement of the arterial input function in axial 3D spoiled gradient echo dynamic contrast‐enhanced MRI." Magnetic resonance in medicine 65.1 (2011): 108-119.
Figures