2902
Assessment of early therapeutic response in glioblastoma using advanced DWI-MRI and histogram analysis1Brain Sciences, Imperial College London, London, United Kingdom, 2Neuroradiology, Imperial College Healthcare NHS Trust, London, United Kingdom, 3CRUK and EPSRC Cancer Imaging Centre, Institute of Cancer Research, Sutton, United Kingdom, 4Surgery and Cancer, Imperial College London, London, United Kingdom, 5Clinical Brain Sciences, University of Edinburgh, Edinurgh, United Kingdom
Synopsis
Glioblastoma is one of the most aggressive brain tumours, with a life expectancy of 12-15 months. Structural MRI lacks sensitivity for detecting early therapeutic response. DWI is sensitive to changes in cellular density and provides a marker of cell kill. There is little published data on which of the diffusion components detectable in diseased brain tissue in vivo is most sensitive to this. Voxel by voxel pre- and post-treatment analysis in ‘functional diffusion map’ studies are confounded by change in tumour size. We assess the utility of a spatially-independent histogram approach to detect early treatment response using advanced DWI models.
Introduction
Glioblastoma (GBM) account for ~70% of adult primary brain tumours [1]. Despite optimal current treatment, median survival remains only 12-15 months; prognosis is also highly variable; therapeutic response and outcome is dominated by individual tumour biology [2,3,4]. New treatments and improved approaches to stratifying treatment in individual patients are urgently needed. Current early evaluation of therapeutic response on imaging is limited by poor biological specificity of conventional MRI. Contrast enhancement correlates poorly with disease activity and with patients on alkylating chemotherapeutic agents e.g. temozolomide (TMZ) [5, 6].
DWI is increasingly used as an biomarker for tumour characterization and therapeutic assessment. Monoexponential ADC derived from two b-values (typically 0s/mm and 1000s/mm) are robust and reproducible across multiple centers [7]. Diffusion signal in vivo is however multiexponential, and reflects multiple diffusion processes within a single voxel, revealed by multiple b-value acquisition [8]. Low b-value components are dominated by perfusion effects, whereas increasing b-values may reflect various interstitial and intracellular diffusion processes [9]. The intravoxel incoherent (IVIM) model separates perfusion and diffusion components using a biexponential fit. The stretched exponential model provides an alternative to multiexponential fitting to noise-limited datasets, and considers signal as a continuous distribution of components with different diffusion coefficients. Voxel by voxel pre- and post-treatment analysis in ‘functional diffusion map’ (FDM) studies may be confounded by interval change in tumour size. Spatially-independent approaches such as histogram analysis can circumvent these issues, and provide simple, resilient processing for clinical use.
Purpose
The purpose of this study is to assess the utility of advanced quantitative diffusion MRI derived from multi b value acquisitions in the assessment of treatment response, using a spatially-independent approach.Methods
Initial data has been analysed for 8 patients (7M,1F; mean age 56 (range, 30-72)) prospectively enrolled into our multicentre study (recruitment target 120). All patients had biopsy confirmed GBM and completed standard of care (radiotherapy with concomitant and adjuvant TMZ). All imaging was performed using a Verio (3T) (Siemens, Erlangen, De); pre-treatment and mid treatment (day 21-25 from the start of RT). The MRI protocol included a ‘low b value’ acquisition (b= 0s/mm, 50s/mm, 150s/mm, 200s/mm, 500s/mm, 1000s/mm, TR 6100ms, TE 85ms) from which monoexponential diffusion indices ADC and biexponential indices, IVIM parameters D*, D and f were calculated. A ‘high b value’ acquisition (b=0 s/mm, 500s/mm, 1000s/mm, 1500s/mm, 2000s/mm, 2500s/mm, 3000s/mm, 3500s/mm, 4000s/mm, TR 7800ms, TE 121ms) was acquired to allow stretched exponential diffusion indices, DDC and α to be derived. T1-weighted contrast enhanced (TR 1900ms, TE 2.5ms) and T2-weighted FLAIR sequence (TR 5000ms, TE 329ms) were used to define ROI and clinical assessment of mid-treatment and end-treatment response using Response Assessment for Neuro-Oncology (RANO) criteria.
Histograms were generated from voxels located within manually segmented ROIs defined by increased signal on T2 FLAIR images. Changes in histogram percentile profiles were evaluated across the two timepoints and compared with RANO assessment at the mid treatment and end treatment timepoints.
Results
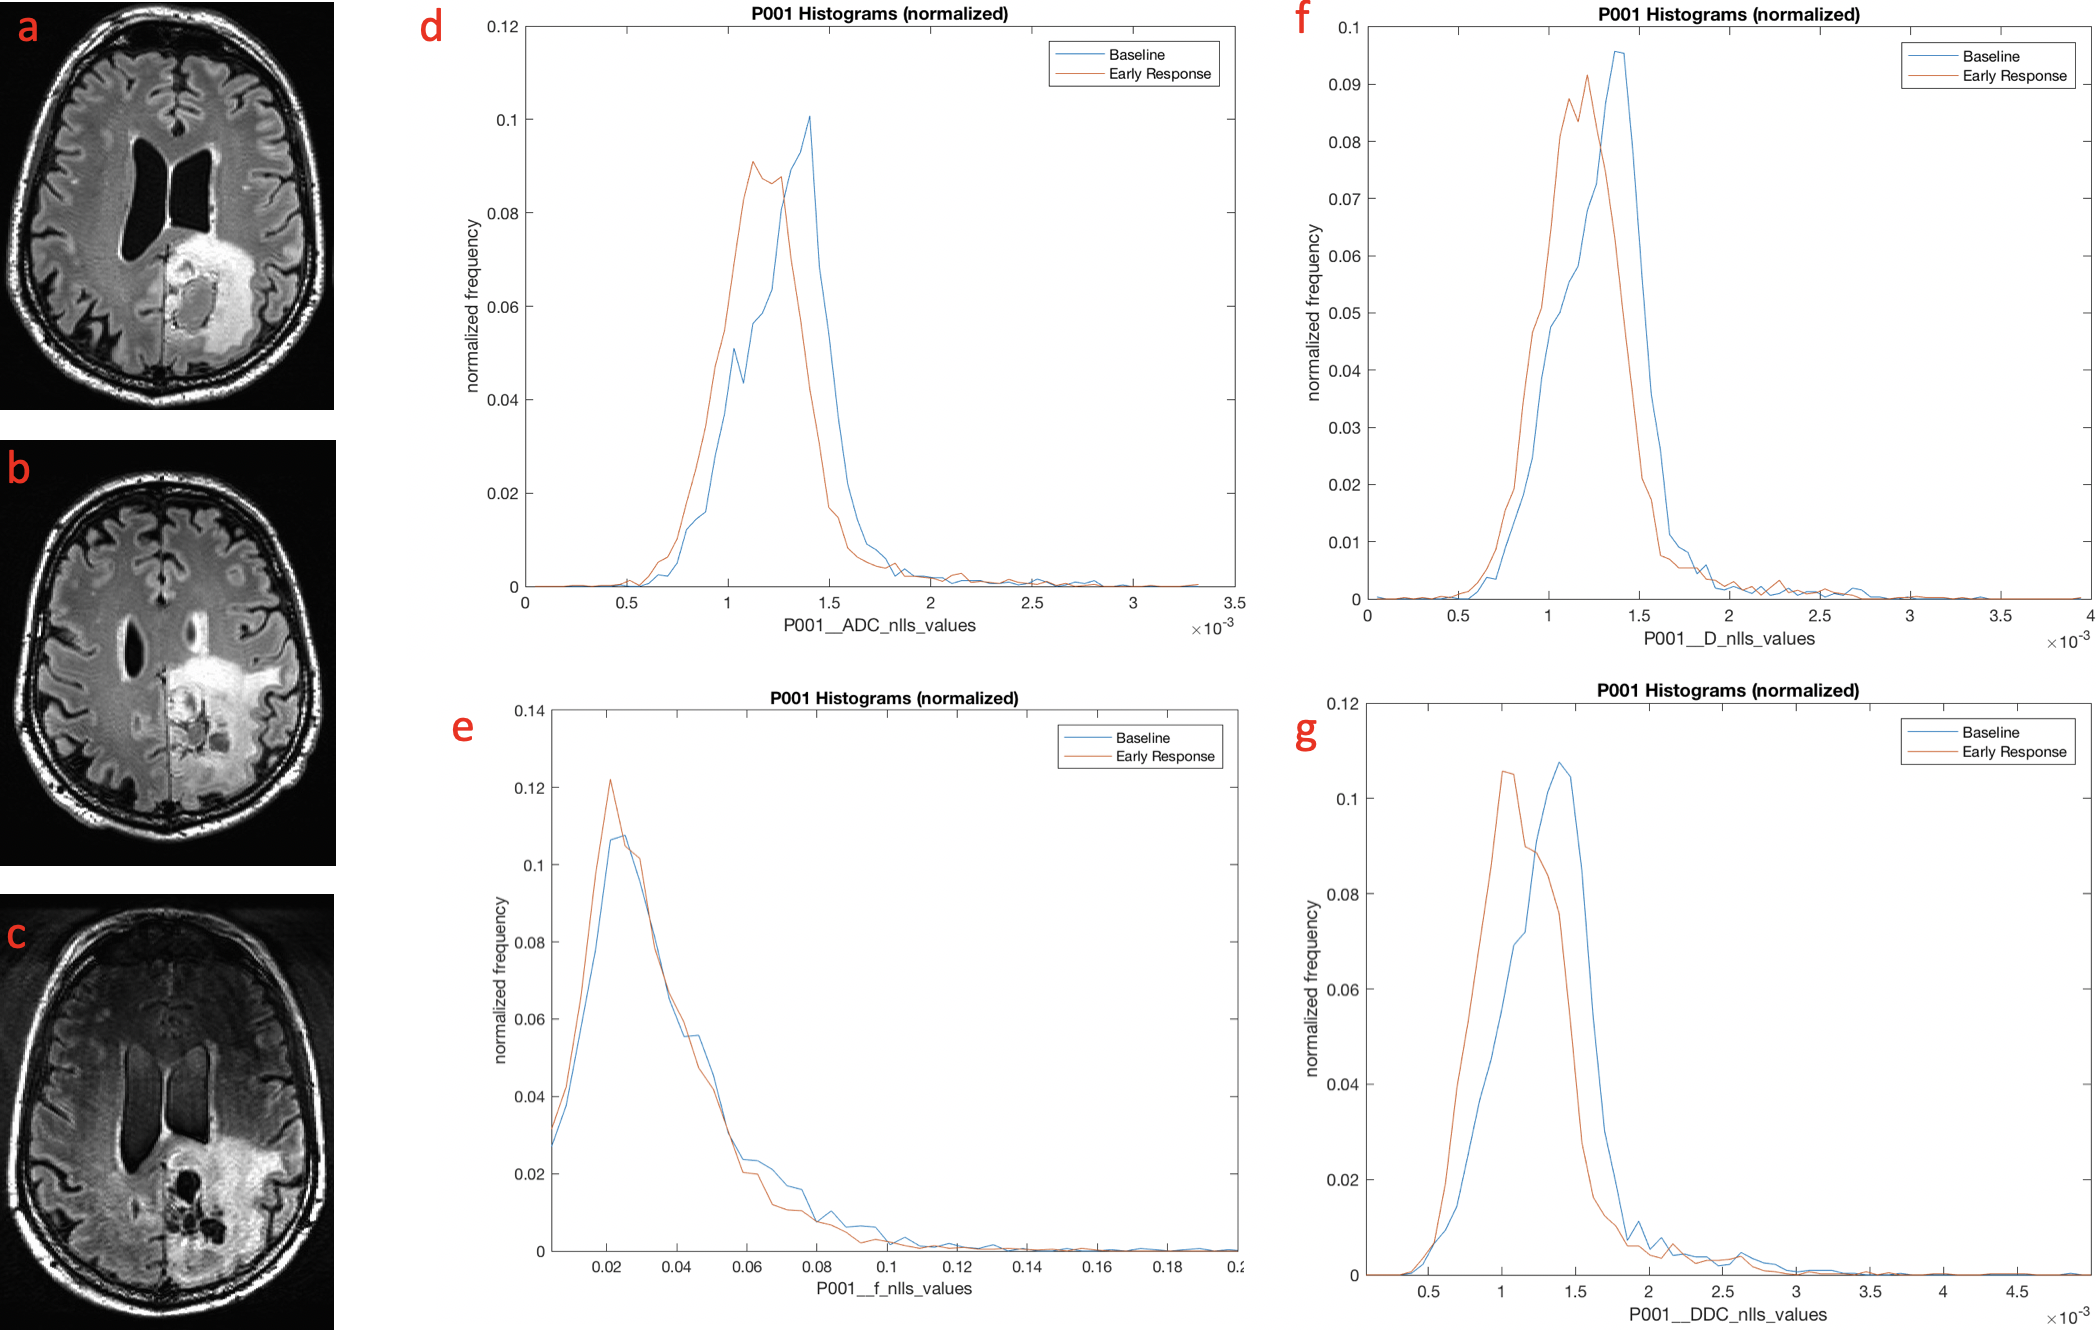
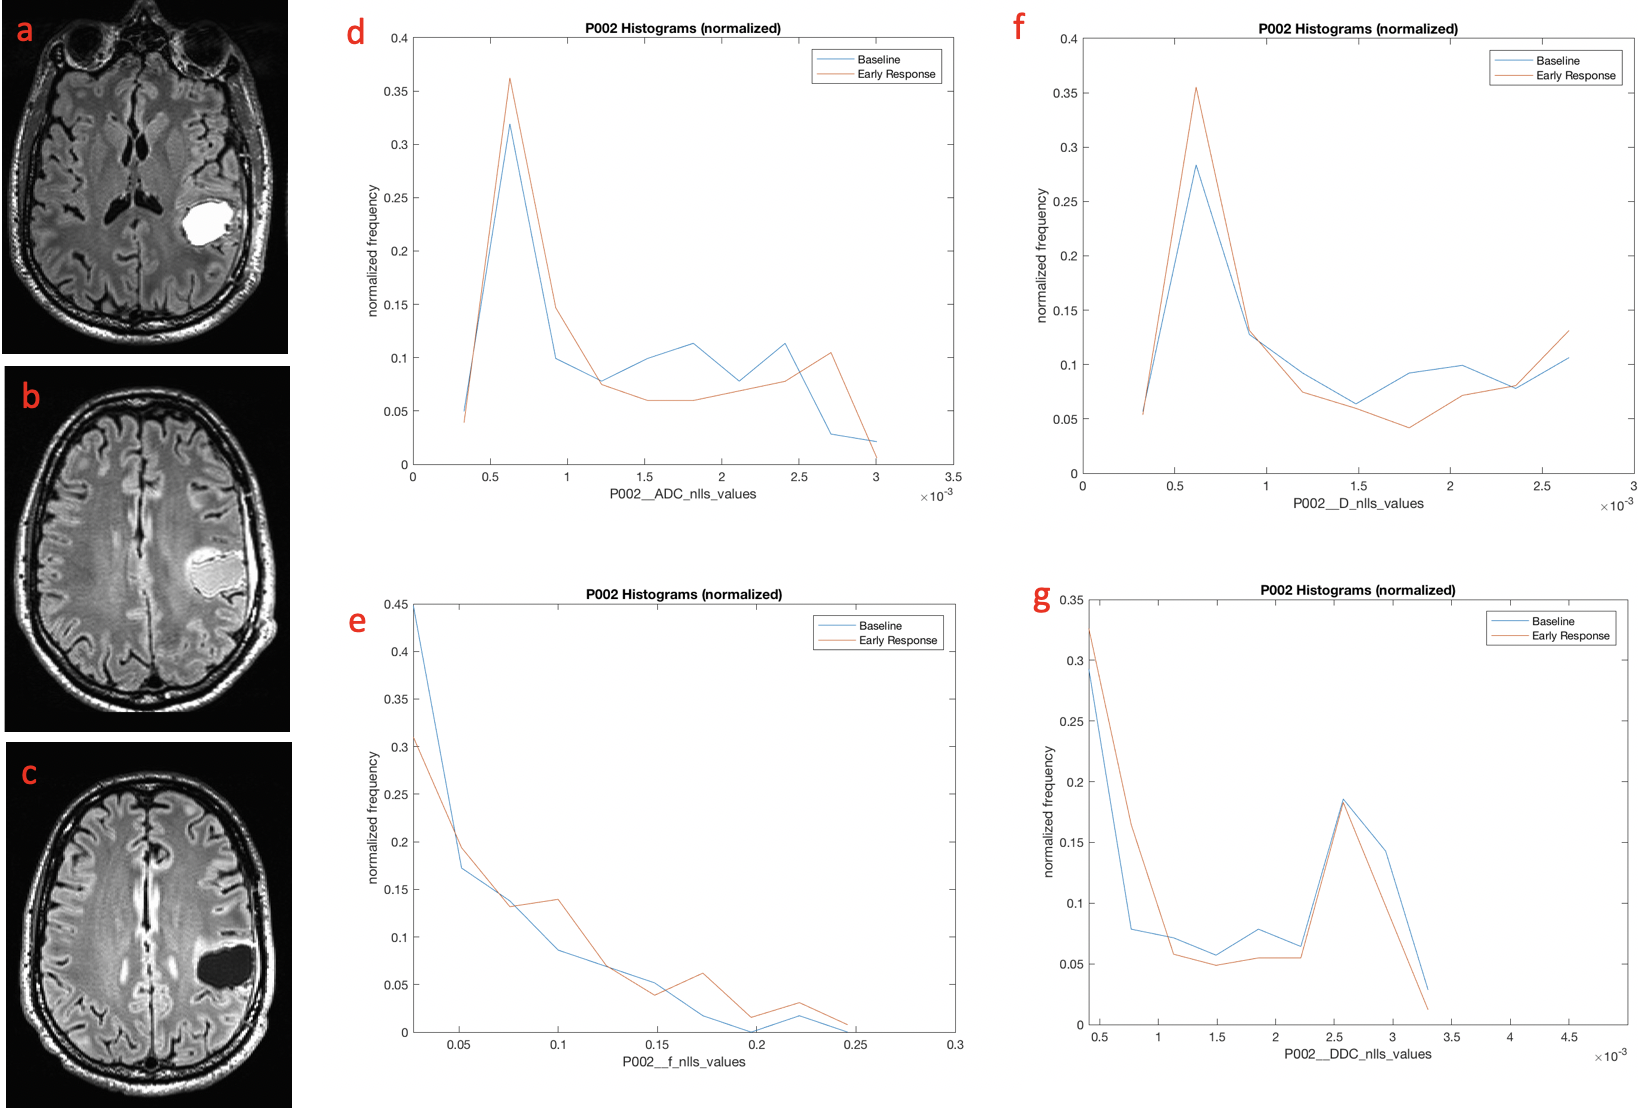
Following completion of treatment 4 patients had progressive disease, 2 stable disease and 1 demonstrated complete response according to RANO criteria. Patients with progressive disease showed a histogram shift to the left across all diffusion models, in keeping with increasing diffusion restriction and implying increased cellularity (Fig 1). Patients with stable disease or complete response showed little or no shift in the histogram (Fig 2).
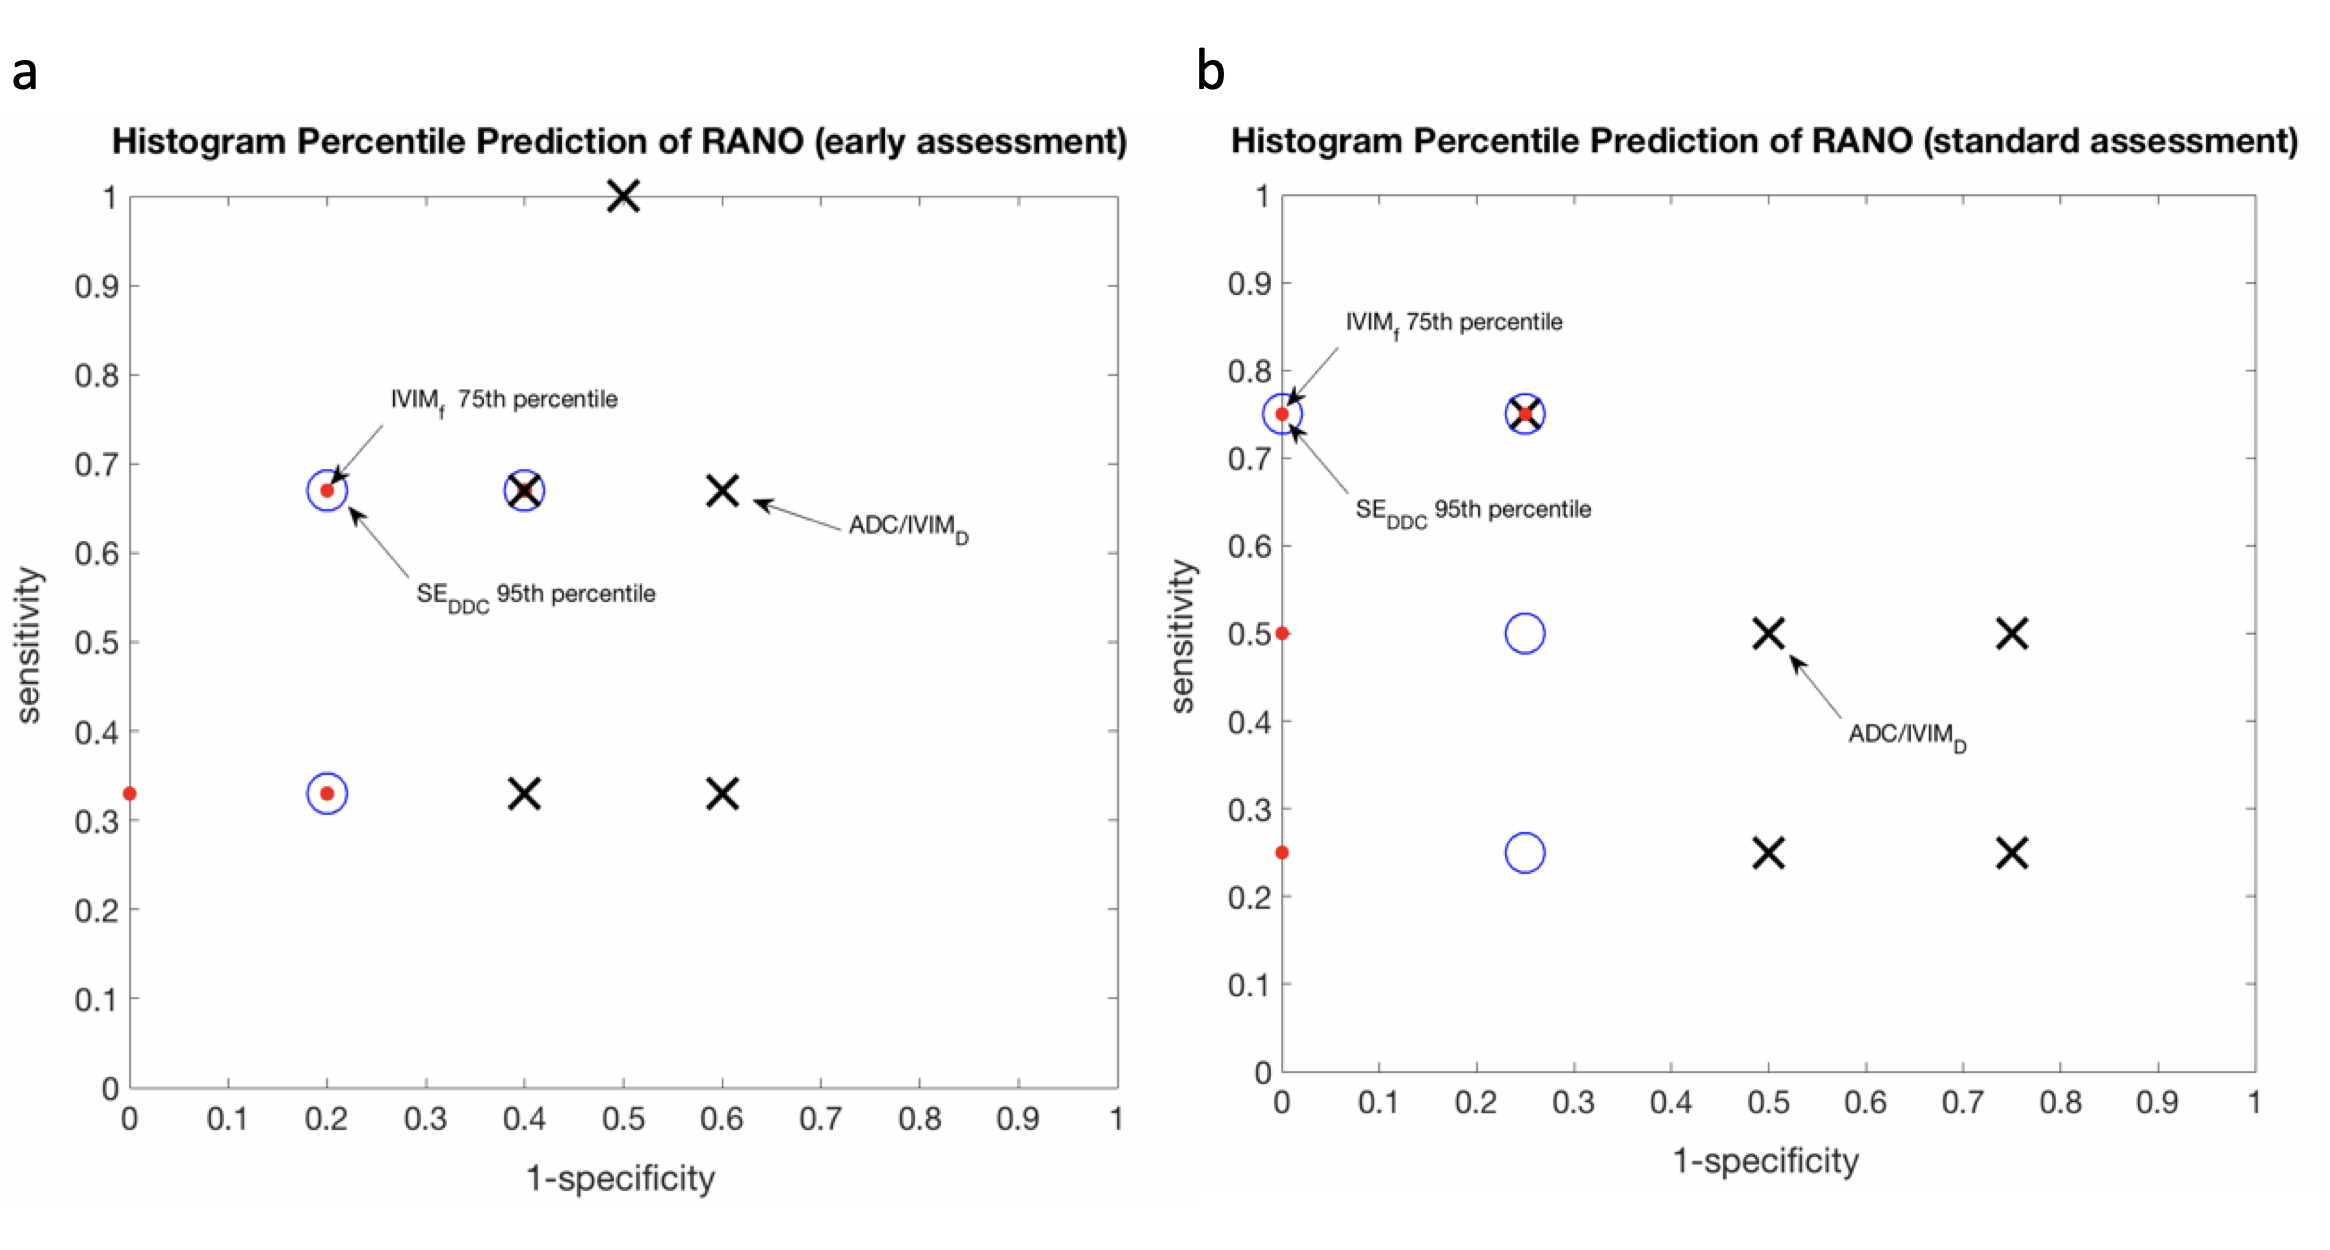
DDC and f are the most predictive of progression against RANO assessment, and appear superior to routine ADC. in 75thcentile (f) and 95thcentile (DDC) are the most sensitive histogram metrics for predicting early progressive disease (Fig 3).
Discussion
Published studies have used similar methods to differentiate between true progression and pseudoprogression, with the 5th centile, deemed to be the most sensitive [10,11]. To our knowledge this is the first study to use histogram analysis to identify a marker of early treatment response.
The limited number of subjects precludes meaningful statistical analysis, however preliminary results suggest association between early changes in specific diffusion components and subsequent treatment response. Spatially-independent diffusion parameter comparisons provide unbiased sampling of tumour heterogeneity and abrogate the confound of voxel-to-voxel misregistration due to tumour growth/shrinkage.
Further assessment of this evolving dataset, with on-going patient recruitment across multiple centres, will include characteristics of different (e.g. contrast-enhancing) tumour components and comparison of analysis methods; and will facilitate optimisation of diffusion MRI platforms for response assessment.
Conclusion
Our preliminary data suggest differential changes in diffusion parameters early in treatment, and provide proof of principle for multi b-value analysis and spatially-independent longitudinal assessment of diffusion imaging for therapeutic assessment in glioma.Acknowledgements
This work was funded by the Brain Tumour Charity, the Brain Tumour Research Campaign and an educational grant from Bayer Schering (DAIG08003).References
[1] Wen PY et al. Malignant gliomas in adults. N Eng J Med. 2008; 359-492.http://www.ncbi.nlm.nih.gov/pubmed/18669428
[2] Lassman AB et al. Incorporating molecular tools into clinical trials and treatment for gliomas? Curr Opin Neurol. 2007, 20:708–711. http://www.ncbi.nlm.nih.gov/pubmed/17992094
[3] Louis DN. Molecular pathology of malignant gliomas. Annu. Rev. Pathol. Mech. Dis. 2006, 1:97–117.
[4] Scheithauer BW et al. The 2007 WHO classification of tumors of the nervous system: controversies in surgical neuropathology. Neuropathology Brain Pathology. 2008, 18:307–316. http://www.brainlife.org/reprint/2008/Scheithauer_BW080602.pdf
[5] Brandsma D et al. Clinical features, mechanisms, and management of pseudoprogression in malignant gliomas. Lancet Oncol. 2008, 9(5):453-61.http://www.ncbi.nlm.nih.gov/pubmed/18452856
[6] Sorensen AG et al. Response criteria for glioma. Nat Clin Pract Oncol. 2008; 5:634-44.http://www.ncbi.nlm.nih.gov/pubmed/18711427
[7] M. Grech-Sollars et al., “Multi-centre reproducibility of diffusion MRI parameters for clinical sequences in the brain,” NMR Biomed., vol. 28, no. 4, pp. 468–485, 2015.
[8] T. C. Kwee et al., “Comparison of apparent diffusion coefficients (ADC) and distributed diffusion coefficients (DDC) in high-grade gliomas,” J. Magn. Reson. Imaging, vol. 31, no. 3, pp. 531–537, Mar. 2010. [9] D.-M. Koh, D. J. Collins, and M. R. Orton, “Intravoxel Incoherent Motion in Body Diffusion-Weighted MRI: Reality and Challenges,” Am. J. Roentgenol., vol. 196, no. 6, pp. 1351–1361, Jun. 2011.
[10] Y. S. Song et al., “True progression versus pseudoprogression in the treatment of glioblastomas: a comparison study of normalized cerebral blood volume and apparent diffusion coefficient by histogram analysis.,” Korean J. Radiol., vol. 14, no. 4, pp. 662–672, 2013.
[11] H. H. Chu et al., “Differentiation of true progression from pseudoprogression in glioblastoma treated with radiation therapy and concomitant temozolomide: comparison study of standard and high-b-value diffusion-weighted imaging.,” Radiology, vol. 269, no. 3, pp. 831–840, Dec. 2013.
Figures