2901
Discriminate glioblastoma recurrence versus radionecrosis: consider cerebrovascular reactivity mapping1University Hospital Zurich, Zurich, Switzerland
Synopsis
Exploiting the different vascular pathophysiology in brain glioblastomas compared to radionecrosis, we aim to improve the differential diagnosis of post-treatment contrast-enhancing lesions. To recognize recurrent glioblastoma after treatment, we investigate if relevant CVR differences exist between newly diagnosed brain glioblastomas and radionecrosis. For this purpose, we utilized blood oxygenation-level-dependent functional MRI (BOLD-fMRI) to study CVR.
INTRODUCTION
Therapy of brain glioblastomas is still associated with disappointing results, due the poor prognosis(1,2). Current consensus on glioblastoma treatment considers radiotherapy in association with chemotherapy after maximal safe-resection as the most effective mean to achieve best prognosis. For this, the treatment plans must be modulated based on patient’s response to treatment(1,3) and, therefore, the exact evaluation of therapy effectiveness/inefficacy is utmost relevant.
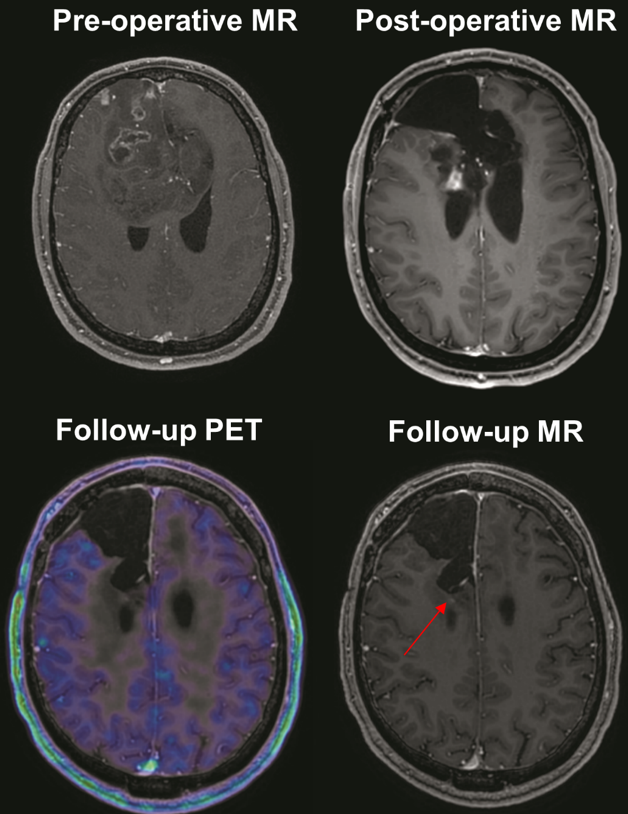
Correct discrimination of disease progression from therapy-induced changes like pseudoprogression or radionecrosis poses a significant radiological challenge: in fact, these share similar features on T1-weighted contrast enhanced MRI (the gold standard for follow-up).(3-6) Other techniques have been tested to identify tumor progression, among them MR perfusion imaging (MRP), MR spectroscopy, positron emission tomography (PET) and single-photon emission tomography (SPECT)(7-9). Whereas MRP does not currently allow a clear diagnosis of recurrence, PET and SPECT have shown interesting results and are used in some centers but still need refinements and are not routinely employed due to low spatial resolution, high cost, and other logistical and technical issues(5,10,11). Methods to discriminate recurrence from radionecrosis therefore are still needed.
Brain glioblastomas are associated with impaired cerebrovascular reactivity (CVR) both inside the lesion and in the affected brain overall when compared with healthy controls.(12-14) Theoretically, radionecrosis should have lower CVR values in comparison with glioblastoma, due to necrosis-related hypoperfusion(15) and should not show any infiltrative behavior, therefore displaying (near-)normal perilesional CVR.
Exploiting the different vascular pathophysiology in these different states could improve the differential diagnosis of post-treatment contrast-enhancing lesions. Aiming to help recognizing recurrent glioblastoma after treatment, we investigate if relevant CVR differences exist between newly diagnosed brain glioblastomas and radionecrosis. For this purpose, we utilized blood oxygenation-level-dependent functional MRI (BOLD-fMRI) to study CVR(16).
METHODS
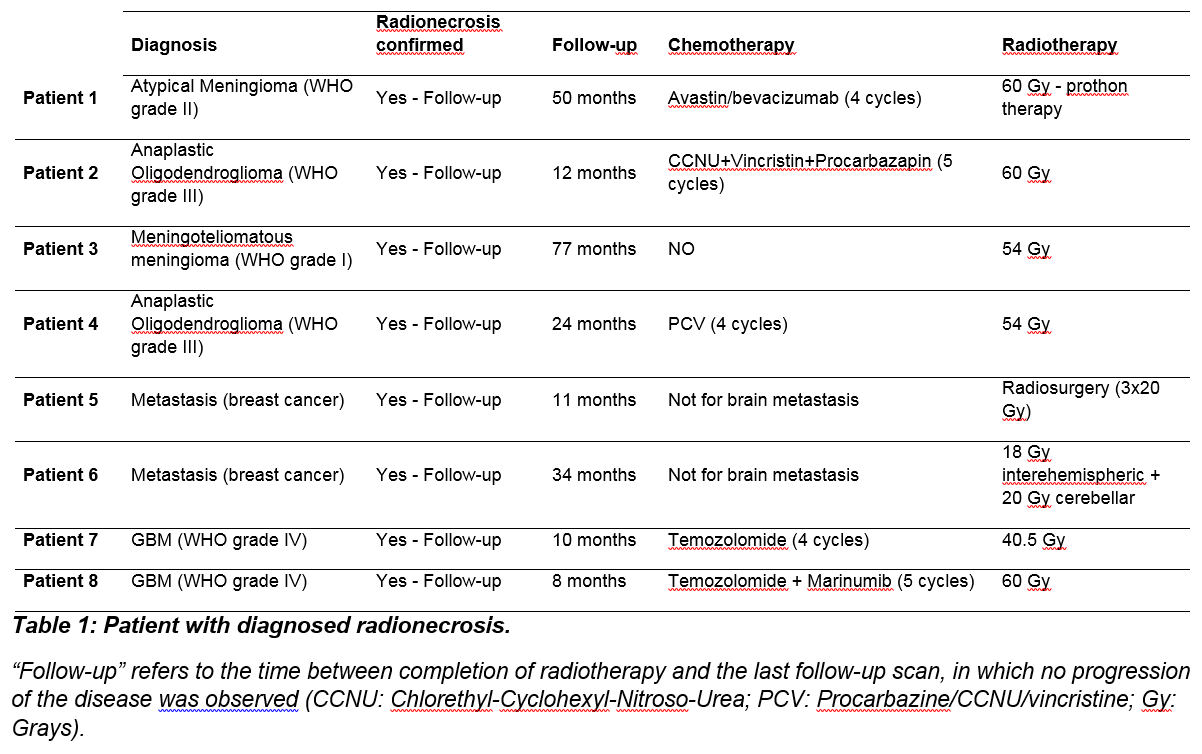
We identified eight patients with diagnosed radionecrosis and eight age/gender matched patients with de novo diagnosed glioblastomas. All of them had histological confirmation of the disease.
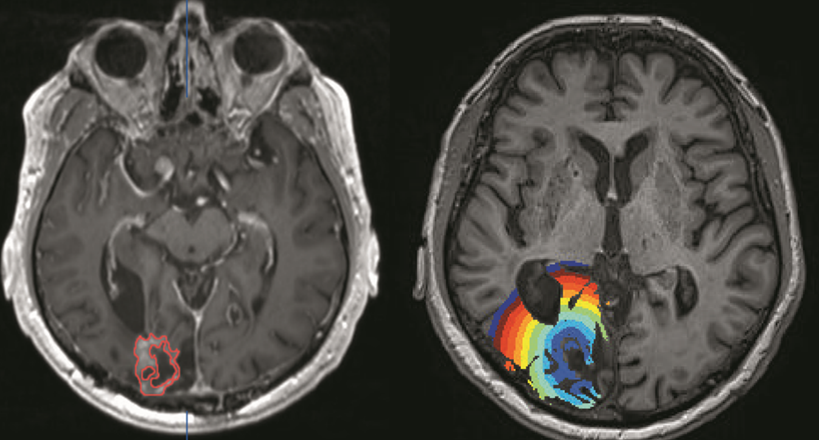
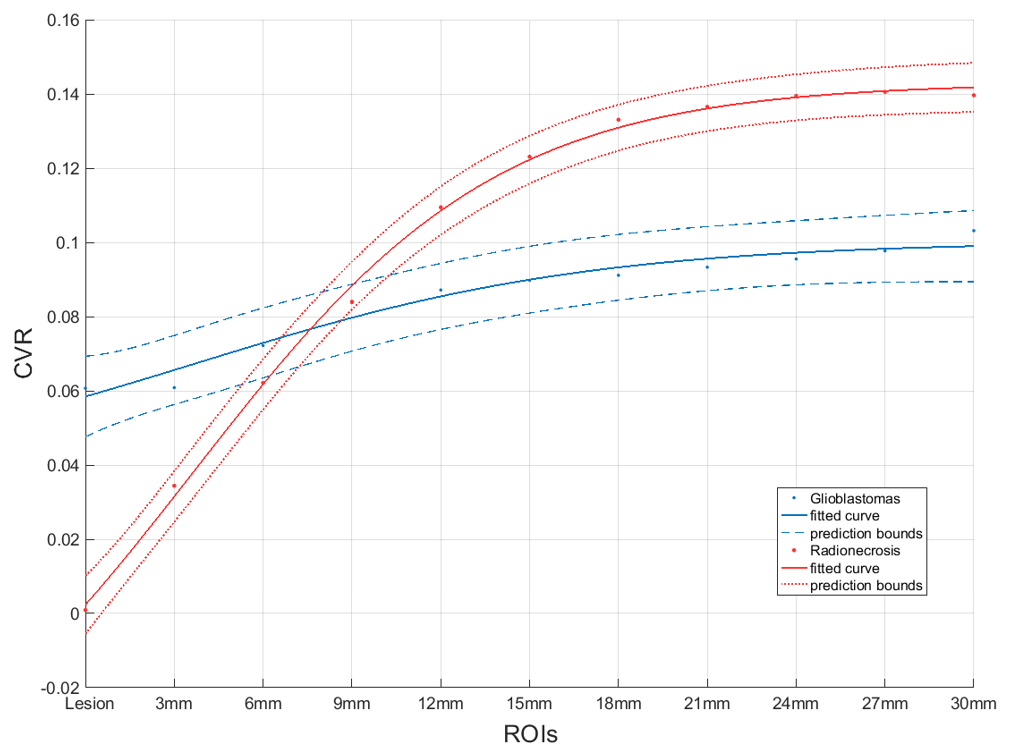
BOLD-CVR were acquired on a 3-Tesla MRI scanner using a 32-channel head-coil with voxel size 3×3×3 mm3, slice gap 0.3 mm. A 3D T1-weighted anatomical image was acquired with the same orientation as the fMRI scan for co-registration and overlay purposes (voxel size: 0.8×0.8×1.0 mm3). Further details on the setup have been described in previous publications(17,18). Iterative temporal decomposition of the BOLD-CVR data was used to avoid transient phases confounds. We performed an analysis of intralesional (as identified as T1-weighted imaging contrast-enhancing lesion) and perilisional BOLD-CVR in the two groups for comparison. The CVR data were fitted with a sigmoidal curve: CVR=a+(b-a)/{1+exp[-k*(RADIUS-d)]}, a, b, d, and k being fitting parameters.
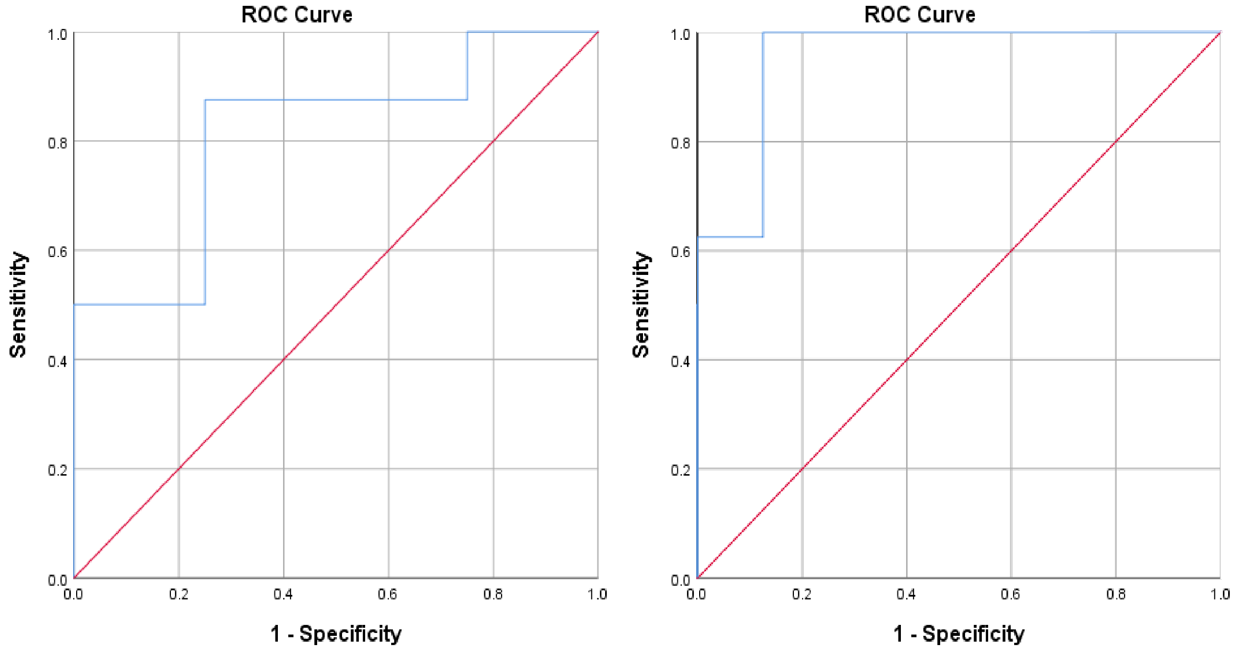
We performed a logistic regression analysis to obtain the predicted probabilities of group classification. The goodness of fit of the logistic regression was evaluated with a receiver operating characteristic (ROC) curve analysis.
RESULTS
Intralesional CVR values were lower in radionecrosis than in glioblastoma patients (0.0009±0.06 vs 0.06±0.05; p=0.04). The ROC curve showed a good ability of intralesional BOLD-CVR do discriminate the two groups (sensitivity: 87,5%, specificity 75%, AUC (95%-confidence-interval): 0.81 (0.592,1.0)).
Perilesionally, a faster recovery – from the lesion towards the outside – of the CVR values was observed in the radionecrosis group compared to glioblastomas, which showed also perilesional CVR impairment 3 cm away from the lesion. In radionecrosis cases, the CVR normalize – in average – at 2 cm away from the lesion.
Using the parameters of the sigmoidal fit (b-a/k) on top of the intralesional CVR, the classification of the pathology could be performed with a ROC area under the curve of 0.95 with a 95%- confidence-interval of 0.85-1.0). Only one case was wrongly classified: a radionecrosis patient suffering from cerebellar metastasis.
DISCUSSION & CONCLUSION
BOLD-CVR might have the potential to discriminate radionecrosis from glioblastomas recurrence. In this study, we exploited the vessels pathophysiology in glioblastoma and radionecrosis to differentiate them.
In patients with radionecrosis, intralesional CVR analysis shows lower values compared to de novo glioblastomas. Due to infiltrative behavior of glioblastomas but not of radiation-induced changes, the perilesional tissues show as well different CVR rate of change.
Recognizing different hemodynamic features both inside and around the lesion in “pure” glioblastomas versus radionecrosis delivers a scheme that, if confirmed by further investigations, can offer another tool to help in the differential diagnosis of recurrent glioblastoma after radiotherapy.
However, due to the presence of mixed radionecrosis-recurrences observed frequently in the clinical practice, the small cohorts included in our study, and the possible bias in identifying radionecrosis patients and classification parametrisation, further confirmation – in form of blinded prospective studies – of this diagnostic approach is required before solid conclusion on its clinical applicability are provided.
Acknowledgements
No acknowledgement found.References
1. Kazda T, Dziacky A, Burkon P, et al. Radiotherapy of Glioblastoma 15 Years after the Landmark Stupp's Trial: More Controversies than Standards? Radiol Oncol 2018;52(2):121-128.
2. Stupp R, Dietrich PY, Ostermann Kraljevic S, et al. Promising survival for patients with newly diagnosed glioblastoma multiforme treated with concomitant radiation plus temozolomide followed by adjuvant temozolomide. J Clin Oncol 2002;20(5):1375-1382.
3. Raimbault A, Cazals X, Lauvin MA, Destrieux C, Chapet S, Cottier JP. Radionecrosis of malignant glioma and cerebral metastasis: a diagnostic challenge in MRI. Diagn Interv Imaging 2014;95(10):985-1000.
4. Delgado-Lopez PD, Rinones-Mena E, Corrales-Garcia EM. Treatment-related changes in glioblastoma: a review on the controversies in response assessment criteria and the concepts of true progression, pseudoprogression, pseudoresponse and radionecrosis. Clin Transl Oncol 2017.
5. Langen KJ, Galldiks N, Hattingen E, Shah NJ. Advances in neuro-oncology imaging. Nat Rev Neurol 2017;13(5):279-289.
6. Siu A, Wind JJ, Iorgulescu JB, Chan TA, Yamada Y, Sherman JH. Radiation necrosis following treatment of high grade glioma--a review of the literature and current understanding. Acta Neurochir (Wien) 2012;154(2):191-201; discussion 201.
7. Walker AJ, Ruzevick J, Malayeri AA, et al. Postradiation imaging changes in the CNS: how can we differentiate between treatment effect and disease progression? Future Oncol 2014;10(7):1277-1297.
8. Rani N, Singh B, Kumar N, et al. Differentiation of Recurrent/Residual Glioma From Radiation Necrosis Using Semi Quantitative 99mTc MDM (Bis-Methionine-DTPA) Brain SPECT/CT and Dynamic Susceptibility Contrast-Enhanced MR Perfusion: A Comparative Study. Clin Nucl Med 2018;43(3):e74-e81.
9. Fierstra J, van Niftrik C, Warnock G, et al. Staging Hemodynamic Failure With Blood Oxygen-Level-Dependent Functional Magnetic Resonance Imaging Cerebrovascular Reactivity: A Comparison Versus Gold Standard ((15)O-)H2O-Positron Emission Tomography. Stroke 2018.
10. Deuschl C, Kirchner J, Poeppel TD, et al. (11)C-MET PET/MRI for detection of recurrent glioma. Eur J Nucl Med Mol Imaging 2018;45(4):593-601.
11. Verger A, Langen KJ. PET Imaging in Glioblastoma: Use in Clinical Practice. In: De Vleeschouwer S, editor. Glioblastoma. Brisbane (AU): Codon Publications Copyright: The Authors.; 2017.
12. Zaca D, Hua J, Pillai JJ. Cerebrovascular reactivity mapping for brain tumor presurgical planning. World J Clin Oncol 2011;2(7):289-298.
13. Pillai JJ, Mikulis DJ. Cerebrovascular reactivity mapping: an evolving standard for clinical functional imaging. AJNR Am J Neuroradiol 2015;36(1):7-13.
14. Fierstra J, van Niftrik C, Piccirelli M, et al. Diffuse gliomas exhibit whole brain impaired cerebrovascular reactivity. Magn Reson Imaging 2018;45:78-83.
15. Kim TH, Yun TJ, Park CK, et al. Combined use of susceptibility weighted magnetic resonance imaging sequences and dynamic susceptibility contrast perfusion weighted imaging to improve the accuracy of the differential diagnosis of recurrence and radionecrosis in high-grade glioma patients. Oncotarget 2017;8(12):20340-20353.
16. Chen JJ. Cerebrovascular-Reactivity Mapping Using MRI: Considerations for Alzheimer's Disease. Front Aging Neurosci 2018;10:170.
17. van Niftrik CHB, Piccirelli M, Bozinov O, et al. Iterative analysis of cerebrovascular reactivity dynamic response by temporal decomposition. Brain Behav 2017;7(9):e00705.
18. van Niftrik CH, Piccirelli M, Bozinov O, et al. Fine tuning breath-hold-based cerebrovascular reactivity analysis models. Brain Behav 2016;6(2):e00426.
Figures